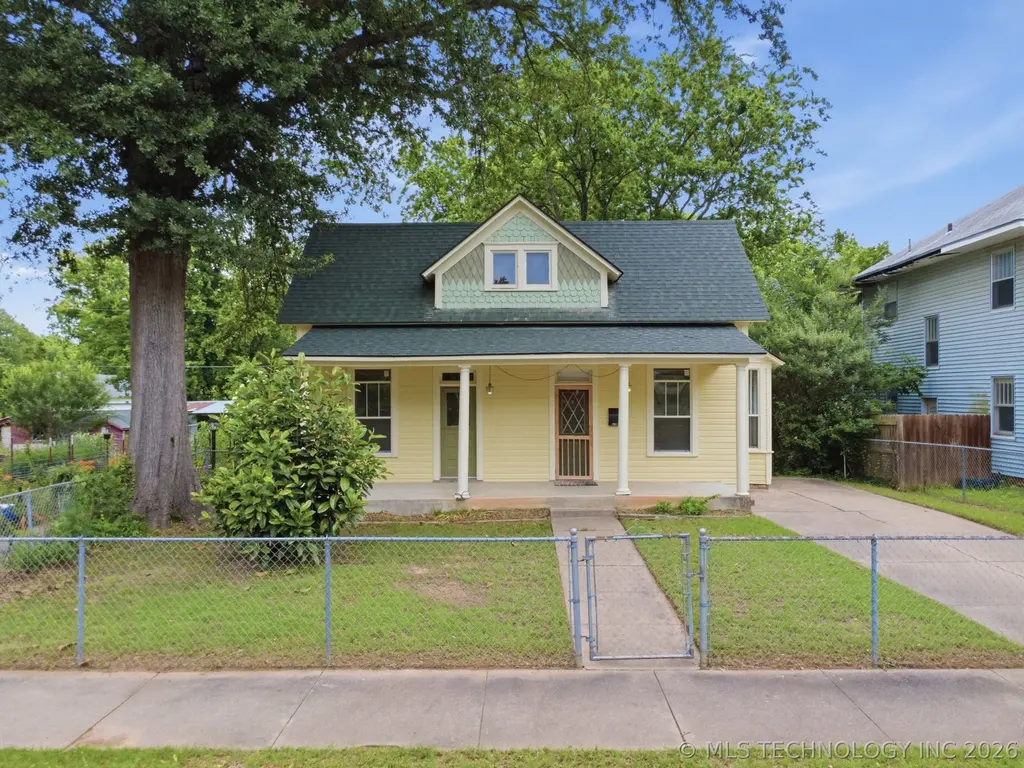
505 N Grand Ave · Okmulgee, OK
Flood risk 4/10 · Minor
- FEMA flood zone
- X (unshaded)
- Chance of flooding over 30 yrs
- 0.21%
- Est. flood insurance / yr
- $507 – $1,088
Fire risk 7/10 · Major
- Est. fire insurance / yr
- $2,463 – $4,575
Heat risk 6/10 · Moderate
- Hot days now (above 111°F)
- 7 days/yr
- Hot days in 30 yrs
- 19 days/yr
Wind risk 3/10 · Minor
- Chance of severe wind over 30 yrs
- 5.0%
Air-quality risk 2/10 · Minimal
- Unhealthy air days now
- 1 days/yr
- Unhealthy air days in 30 yrs
- 2 days/yr
Risk factors via First Street. Map © Google.
Why this score? — see what drove the C grade
The composite is a weighted blend of 9 inputs, each scored 0–100. Each bar is that input's sub-score; the figure is the points it added to the 100-point composite (weight × sub-score).
- Cash flow +26.8/30.0
- DSCR +9.2/10.0
- ARV discount +9.2/15.0
- 1% rule +5.9/10.0
- Livability +3.1/5.0
- Rent growth +2.5/5.0
- Condition / age +2.5/5.0
- Schools +0.4/10.0
- Appreciation +0.2/10.0
$99,000
🖨 Deal sheet 📄 Offer letter ✓ Due diligence
Listing remarks
Beautiful Southern Charm with Modern Updates. Step into this beautifully updated 2-bedroom, 1-bath home where timeless character meets modern efficiency. Original architectural details throughout, showcasing the home’s unique charm and warmth. Enjoy high ceilings, abundant natural light from new energy-efficient windows, and a formal dining room perfect for gatherings and everyday living. The inviting front porch offers the ideal spot to relax and enjoy the peaceful surroundings. Outside, mature trees provide shade and beauty, enhancing the home’s exceptional curb appeal. With tasteful updates, energy-efficient improvements, and charming original features throughout, this home o
Key facts
- Formal dining room
- Inviting front porch
- Natural light
Tags
Property features AI
Finance
- HOA & community: Sidewalks
Exterior
- Security: Smoke detector(s); No safety shelter
- Utilities: Electricity available; Natural gas available; Public water; Public sewer
- Home design: Single-story; Faces west; Crawlspace foundation
- Construction: Built with wood siding and wood frame; Asphalt/fiberglass roof
- Exterior features: Covered porch; Partial fencing; Mature trees
Interior
- Kitchen: Oven; Range; Stove; Refrigerator
- Flooring: Carpet; Wood
- Bathrooms: 1 full bathroom
- Heating & cooling: Central heating (Electric and Gas); Central air conditioning
- Interior features: High ceilings; Laminate counters; Ceiling fan(s); Vinyl windows
- Laundry & utility: Washer hookup; Gas water heater
Neighborhood map
What this means for you Summary
Snapshot
- This is a 3-bed/1.0-bath single-family listed at $99k.
Deal economics
- At list price, monthly cash flow is $270 ($3k/yr) — positive.
- The deal already cash-flows at list — no discount required.
- Meets the 1% rule at list price ($1k rent vs $99k).
- Recommended offer: $98k (1.5% below list) — sets the bar for market timing.
- Cap rate 9.6% vs local median 7.6% in Okmulgee — meaningfully above typical; check what's discounted (condition, days-on-market, listing class) to confirm the premium yield is real.
Location & tenants
- Location reads 61/100 on livability (#300 in OK) — a middle-class / working-renter tenant base. Strengths: cost of living A+, housing A+, health & safety A+; Watch: schools F, crime F, amenities F.
- Okmulgee (town): math 3% / reading 7% proficiency, ranked #264 of 270 in OK (top 98%) — low school quality limits family demand, transient renter base, plan for 1-2y turnover; 73% free/reduced lunch — lower-income household profile, screen leases tightly.
- Market conditions: 146 active listings in the ZIP; 5 comparable units currently listed for rent nearby; rentals at typical pace (median 24d on market — plan ~3-4 weeks tenant-placement turnaround); 12 units permitted in Okmulgee County in 2024 (0 in 5+ unit buildings).
Forward outlook
- Local home prices are declining (-3.0%/yr); year-one equity from $684 of loan paydown is wiped out by about $3k of value loss. Plan a longer hold.
- Okmulgee County population projected at -13% by 2050 — secular population decline; favor cash flow + early exit over multi-decade hold.
- At projected returns (-3.0% appreciation + 3.0% rent growth), your $28k cash investment doubles in ~10 years — after that, you're playing with house money.
Negotiation context
- It's been on market 15 days — a 2% lower offer ($98k) is reasonable based on typical stale-listing flexibility.
- Current owner paid $20k; list at $99k implies a 408% gain — meaningful room to come down on a strong offer.
Risks & watch-outs
- Watch-outs: built in 1920 — expect roof / HVAC / electrical / plumbing capex.
- Climate carrying-cost: major wildfire risk; extreme-heat days projected 7→19/yr by 2055 (HVAC capex compounding) — expect insurance premiums to compound above CPI over the hold.
Questions for the listing agent
- Built in 1920 — when were the roof, HVAC, electrical panel, plumbing, and water heater last replaced?
- Is there a deadline driving the sale (1031 exchange, divorce, estate, relocation)? That informs how much negotiation room exists.
- Schools are F-rated, which usually means shorter tenancies and higher turnover. Who's the typical renter profile here, and what's been the actual vacancy rate?
- Crime grade is F in this area — have there been break-ins, vandalism, or insurance claims at this property in the last 3 years? What carrier currently insures it and at what premium?
- What's the average days-on-market for RENTAL listings here right now (not sales)? A rising rental-DOM trend means longer vacancies and softer asking-rent achievability than the comps imply.
- What's the recent tenant-quality profile in this submarket — average credit score on applications, eviction rate, late-payment / NSF rate, and stable-employment percentage? A property-management company in the area should have these aggregated.
- How much new for-sale + rental construction is in the pipeline within 1–3 miles? Heavy new supply typically softens prices + rents 12–24 months out; constrained supply supports both.
Investment metrics
- 1% rule
- 1.09% ✓
- Cap rate
- 9.57%
- Cash-on-cash
- 11.69%
- DSCR
- 1.52
- GRM
- 7.6
CMA / ARV
- ARV (on-the-fly)
- $102,816
- Comps found
- 12
Show comp detail 12 sales within ~0.75 mi
| Address | Dist | Beds/Ba | Sqft | Sold | Price | $/sf | Match |
|---|---|---|---|---|---|---|---|
| 910 N Okmulgee Ave | 0.38mi | 3/1.0 | 1,218 (-0%) | 7mo | $50,000 | $41 | 75 |
| 1118 N Alabama Ave | 0.62mi | 3/1.0 | 1,182 (-3%) | 1mo | $15,000 | $13 | 64 |
| 1106 N Alabama Ave | 0.58mi | 3/1.0 | 1,304 (+6%) | 3mo | $109,900 | $84 | 60 |
| 602 N Collins Ave | 0.38mi | 2/2.0 (-1) | 1,333 (+9%) | 5mo | $75,000 | $56 | 54 |
| 1103 N Alabama Ave | 0.56mi | 3/2.0 | 1,260 (+3%) | 15mo | $141,000 | $112 | 52 |
| 901 E 9th St | 0.72mi | 2/1.0 (-1) | 1,200 (-2%) | 11mo | $123,000 | $103 | 49 |
| 812 W 6th St | 0.58mi | 2/1.0 (-1) | 1,326 (+8%) | 16mo | $8,000 | $6 | 41 |
| 701 S Muskogee Ave | 0.72mi | 2/1.0 (-1) | 1,133 (-7%) | 14mo | $148,000 | $131 | 37 |
| 805 N Sherman Ave | 0.69mi | 3/1.0 | 1,064 (-13%) | 11mo | $123,000 | $116 | 37 |
| 123 N Taft Ave | 0.61mi | 4/1.5 (+1) | 1,360 (+11%) | 17mo | $65,000 | $48 | 32 |
| 705 S Muskogee Ave | 0.73mi | 2/1.0 (-1) | 1,080 (-12%) | 12mo | $155,000 | $144 | 31 |
| 414 E 12th St | 0.74mi | 2/1.0 (-1) | 1,106 (-10%) | 17mo | $35,000 | $32 | 31 |
Match score weights: distance 35% · size 25% · config 20% · recency 20%. Top-matched comps best support the ARV.
Projected returns pro-forma
-3.0% appreciation · 3.0% rent growth · sell at horizon
- IRR
- 1.0%
- Equity multiple
- 1.04×
- Total profit
- $1,106
- Equity at exit
- $14,761
- IRR
- 10.6%
- Equity multiple
- 1.83×
- Total profit
- $22,918
- Equity at exit
- $8,560
Cash invested: $27,720 (down + closing). Projections, not guarantees.
Landlord ↔ Tenant lean methodology
- Overall (STATE)
- 83 Strongly Landlord-Friendly
- State Oklahoma
- 83 Strongly Landlord-Friendly · R+20
- County
- — inherits STATE
- City
- — inherits STATE
ZIP-level market 74447
- Home prices YoY
- -3.6%
- Active inventory
- 146
- Price-to-rent
- 7.6×
Monthly cashflow live
- Estimated rent
- $1,080 high interval (Pro) →
- Mortgage (P&I)
- −$519
- Tax from tax record
- −$23 /mo · $274/yr
- Insurance
- −$41
- HOA
- −$0
- Vacancy / Maint / Mgmt
- −$227
- Net cashflow
- $270
Break-even live
UW: 25.0% down · 7.5% · 30yr · 1.5% tax · 5.0% vac · 8.0% maint · 8.0% mgmt
Financing live
Cash to close
- Down payment
- $24,750
- Closing costs
- $2,970
- Reserves months
- —
- Total cash needed
- —
Loan-product check · same deal, 3 products live
Conventional
25% down · 7.5% · 30yr
- Down + closing
- —
- Monthly P&I
- —
- Monthly cashflow
- —
- DSCR
- —
- Eligible?
- —
Personal DTI + credit; lowest rate.
DSCR
20% down · 8.5% · 30yr
- Down + closing
- —
- Monthly P&I
- —
- Monthly cashflow
- —
- DSCR
- —
- Eligible?
- —
No personal income docs; deal must DSCR.
Hard money
10% down · 12.0% · 12mo
- Down + closing
- —
- Monthly P&I
- —
- Monthly cashflow
- —
- DSCR
- —
- Eligible?
- —
Short-term bridge; refi at stabilization.
Rent comps 5 comps
| Address | Beds | Baths | Sqft | Rent | $/sqft | DOM | Units | Dist |
|---|---|---|---|---|---|---|---|---|
| 324 E 6th St Unit 214 Okmulgee, OK | 2.0 | 1.0 | 891 | $1,200 | $1.35 | 23d | 1 | 0.32mi |
| 324 E 6th St Unit 204 Okmulgee, OK | 2.0 | 1.0 | 770 | $1,150 | $1.49 | 23d | 1 | 0.32mi |
| 324 E 6th St Unit 116 Okmulgee, OK | 2.0 | 1.0 | 776 | $1,060 | $1.37 | 23d | 1 | 0.32mi |
| 118 N Taft Ave Okmulgee, OK | 3.0 | 2.0 | 1212 | $1,000 | $0.83 | 14d | 1 | 0.67mi |
| 1104 W 8th St Okmulgee, OK | 2.0 | 1.0 | 1084 | $850 | $0.78 | 3d | 1 | 0.80mi |
Listing history 12 events
-
2026-06-18days on market $99,000 Active 15 DOM
-
2026-06-17days on market $99,000 Active 14 DOM
-
2026-06-16days on market $99,000 Active 13 DOM
-
2026-06-15days on market $99,000 Active 12 DOM
-
2026-06-13days on market $99,000 Active 10 DOM
-
2026-06-12days on market $99,000 Active 9 DOM
-
2026-06-09days on market $99,000 Active 6 DOM
-
2026-06-08days on market $99,000 Active 5 DOM
-
2026-06-08days on market $99,000 Active 4 DOM
-
2026-06-07days on market $99,000 Active 3 DOM
-
2026-06-04remarks 687-char remark
-
2026-06-04$99,000 Active 1 DOM
ⓘ Source: listings_history table (triggers on properties + properties_extension) + one-shot
backfill from property_details.listing_events for pre-trigger history.
Tax reassessment forecast OK · Resets to sale price
- Current annual tax
- $274 · $23/mo
- Projected year-2 tax
- $891 · $74/mo
- Expected delta
- +$617/yr (+$51/mo · 225.2%)
ⓘ Screening estimate from a state-policy table — verify with the county assessor before closing.
Climate risk First Street
- Flood 4/10 Moderate FEMA zone X (unshaded) · 21% chance over 30 yrs
- Wildfire 7/10 Severe
- Heat 6/10 Major 7 d/yr ≥111°F today · 19 d/yr by 30 yrs out
- Wind 3/10 Moderate 5% chance of damaging wind over 30 yrs
- Air quality 2/10 Low 1 unhealthy d/yr today · 2 by 30 yrs out
Nearby sold comps map
Loading sold comps map…
Walkable amenities ~0.75 mi
Loading nearby amenities…
Taxation est. · year 1
- Rental income
- $12,960
- − Mortgage interest
- −$5,546
- − Property taxes
- −$274
- − Insurance
- −$495
- − Repairs & maintenance
- −$1,037
- − Management
- −$1,037
- − Depreciation
- −$2,880
- Taxable income
- $1,692
- Est. tax owed @ 24.0%
- −$406
- After-tax cash flow
- $2,833/yr
For passive investors: Depreciation is non-cash, so a rental often shows a tax loss while cash-flowing — sheltering income. Rental losses are passive: they offset passive income freely, and up to $25,000/yr can offset ordinary (W-2) income if you actively participate and your MAGI is under $100k (phasing out to $0 by $150k); unused losses carry forward. On sale, claimed depreciation is recaptured at up to 25%, and gains may owe capital-gains tax (a 1031 exchange can defer both). Figures are a year-1 estimate at your 24.0% rate — not tax advice; consult a CPA.
Schools (NCES district)
- District
- Okmulgee
- NCES district ID
- 4022800
- Math proficiency
- 3% ▼ -5.00%
- Reading proficiency
- 7% ▼ -8.00%
- Median HH income
- $31,078
- Composite
- 3.66/100
- National rank
- #10069
- State rank
- #264 of 270 in OK
Livability — Okmulgee
- Score
- 61/100
- State rank
- #300
- US rank
- #17773
Category grades
Schools grade is shown separately in the Schools card above.
Census & demographics
- Census place
- Okmulgee, OK
- Population (ZIP)
- 15,500
Population outlook (Okmulgee County) Hauer SSP2
- Today (2025)
- 37,543 people
- By 2030
- 36,528 · -2.7%
- By 2040
- 34,430 · -8.3%
- By 2050
- 32,498 · -13.4%
- By 2075
- 28,814 · -23.3%
- By 2100
- 25,193 · -32.9%
Race, ethnicity, and origin ACS 2023
- Neighborhood character
- Diverse neighborhood (Simpson 0.69)
- Race & ethnicity
- White 54% Native American 15% Two or more races 15% Black 13% Hispanic / Latino 4%
- Common ancestry
- Slovak 2% Italian 1% Romanian 1%
- Foreign-born
- 1%
- Languages at home
- 97% English-only · Spanish 1%
Political lean MEDSL · Okmulgee
- 2024 margin
- Solid R (+42.7) · D 27.7% · R 70.4% · Other 1.9%
- 2008→2024 swing
- -25.7pp toward R · 2008: -17.0pp · 2024: -42.7pp
- All cycles
- 2024: R+42.7 2020: R+37.1 2016: R+32.7 2012: R+17.5 2008: R+17.0
Not yet ingested
- Civics
- —
Market trends
- HPI YoY
- ▼ -9.69%
- Current HPI
- 257.2856
- Rent YoY
- —
- Metro
- —
- State GDP YoY
- ▲ 1.55%
- F500 in state
- 6
Industry mix (Fortune 500 HQ in OK)
| Industry | F500 HQs | Revenue |
|---|---|---|
| Energy | 3 | $48B |
|
||
Price history
+395.0% since first listed3 events — show timeline
- 2026-06-01 Listed $99,000 MLS Technology, Inc.
- 2000-09-07 Sold (Public Records) $19,500 Public Records
- 1997-05-22 Sold (Public Records) $20,000 Public Records
Property tax history
+1.8%/yrLatest (2025): $274 · +6.2% YoY. Source: county tax records.
Cash-flow waterfall
monthlySold comps — $/sqft
last 12 mo · ≤1 miLoading sold comps…