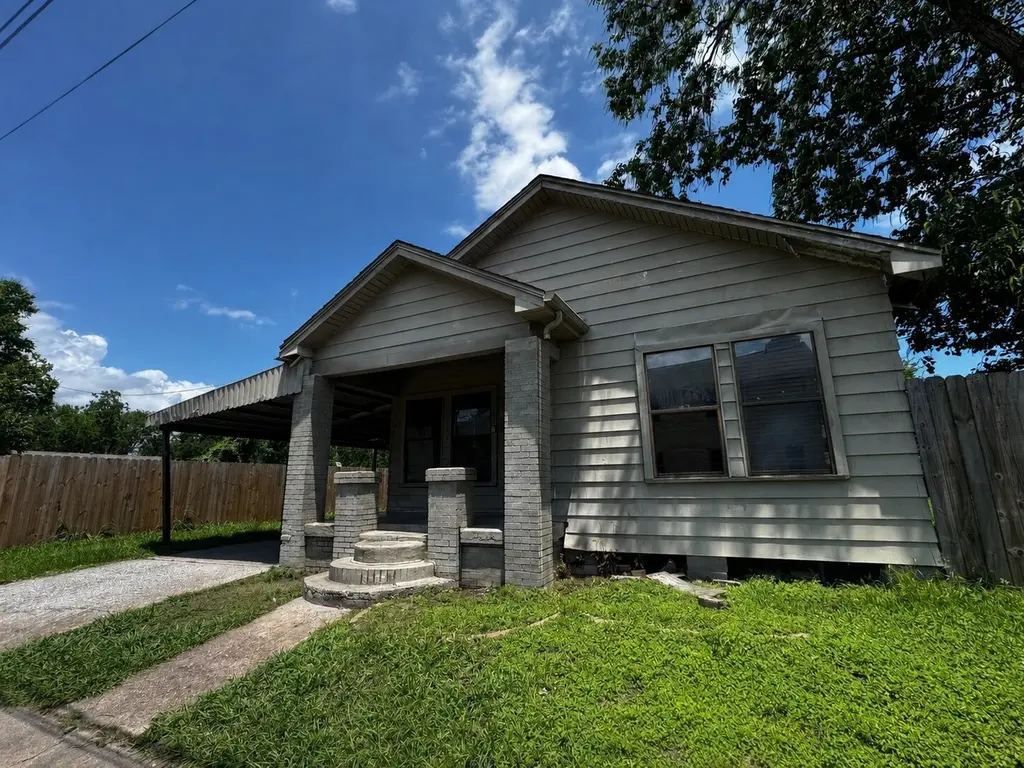
720 Yupon St · Baytown, TX
Flood risk 4/10 · Minor
- FEMA flood zone
- X (unshaded)
- Chance of flooding over 30 yrs
- 0.13%
- Est. flood insurance / yr
- $507 – $1,088
Fire risk 1/10 · Minimal
- Est. fire insurance / yr
- $1,222 – $2,270
Heat risk 9/10 · Severe
- Hot days now (above 108°F)
- 7 days/yr
- Hot days in 30 yrs
- 25 days/yr
Wind risk 9/10 · Severe
- Chance of severe wind over 30 yrs
- 99.0%
Air-quality risk 2/10 · Minimal
- Unhealthy air days now
- 1 days/yr
- Unhealthy air days in 30 yrs
- 2 days/yr
Risk factors via First Street. Map © Google.
Why this score? — see what drove the B+ grade
The composite is a weighted blend of 9 inputs, each scored 0–100. Each bar is that input's sub-score; the figure is the points it added to the 100-point composite (weight × sub-score).
- Cash flow +30.0/30.0
- ARV discount +15.0/15.0
- 1% rule +10.0/10.0
- DSCR +10.0/10.0
- Livability +3.5/5.0
- Schools +3.2/10.0
- Rent growth +2.8/5.0
- Condition / age +2.5/5.0
- Appreciation +0.0/10.0
$79,900
🖨 Deal sheet 📄 Offer letter ✓ Due diligence
Listing remarks
Opportunity awaits. This property is a fixer-upper sold as-is. Ideal for investors, remodelers, or buyers looking for a project, the home offers strong potential for those willing to put in the work. There is an additional A-frame building in the backyard that can also be remodeled and used for additional storage or living area. Conveniently located near Lee College and SH-146.
Key facts
- A-frame building
- Living area
- Additional storage
Tags
Property features AI
Exterior
- Utilities: Public water; Public sewer
- Home design: Residential property; Built in 1935; Block foundation; Composition roof
- Construction: Wood siding construction
- Exterior features: Located in a subdivision
Interior
- Bedrooms: Three bedrooms on the first floor (approx. 15x13, 13x11, 12x11)
- Bathrooms: 1 full bathroom
- Heating & cooling: Central heating (electric); Central air conditioning (electric)
- Interior features: 3 total rooms
Neighborhood map
What this means for you Summary
Snapshot
- This is a 3-bed/1.0-bath single-family listed at $80k.
Deal economics
- At list price, monthly cash flow is $337 ($4k/yr) — positive.
- The deal already cash-flows at list — no discount required.
- Meets the 1% rule at list price ($1k rent vs $80k).
- Recommended offer: $79k (1.5% below list) — sets the bar for market timing.
- Cap rate 11.3% vs local median 4.2% in Baytown — top-decile yield for the area; either an underpriced asset or a hidden risk that comps aren't pricing in. Stress-test before assuming the spread holds.
Location & tenants
- Location reads 69/100 on livability (#412 in TX) — a middle-class / working-renter tenant base. Strengths: cost of living A+, housing A+; Watch: employment D+, crime F, amenities F.
- Goose Creek CISD (urban): math 37% / reading 36% proficiency, ranked #473 of 826 in TX (top 57%) — families likely to look elsewhere, expect single-tenant / working-renter base with shorter leases; 61% free/reduced lunch — lower-income household profile, screen leases tightly.
- Zoned schools: Horace Mann J H (math 34% / reading 28%, grade F, #1,015 of 1,662 statewide, top 62%, 811 students, 87% FRL); High Point School (12 students, 75% FRL) — zoned schools average 81% FRL vs 61% district-wide (20 pts higher); higher-poverty schools than district average — tighter screening recommended.
- Market conditions: Rents rising (+1.3%/yr); 271 active listings in the ZIP; 10 comparable units currently listed for rent nearby; rentals lingering (median 44d on market — plan ~5-8 weeks vacancy on turnover, expect pricing pressure); 50% of comp listings sitting > 30 days — soft ceiling on asking rent; 29,883 units permitted in Harris County in 2024 (8,621 in 5+ unit buildings).
Forward outlook
- Local home prices are declining (-3.0%/yr); year-one equity from $552 of loan paydown is wiped out by about $2k of value loss. Plan a longer hold.
- Harris County population projected at +47% by 2050 — long-run rental-demand tailwind backs the buy-and-hold thesis.
- At projected returns (-3.0% appreciation + 1.3% rent growth), your $22k cash investment doubles in ~8 years — after that, you're playing with house money.
Negotiation context
- It's been on market 27 days — a 2% lower offer ($79k) is reasonable based on typical stale-listing flexibility.
- 11 sale attempts since 12y ago; this cycle's ask has dropped $5k (6%) from the opening price — seller is motivated, your offer sets the floor, not the list.
Risks & watch-outs
- Watch-outs: property tax is 3.9% of price; built in 1935 — expect roof / HVAC / electrical / plumbing capex.
- Climate carrying-cost: severe wind risk, 99% chance of damaging wind over 30y; extreme-heat days projected 7→25/yr by 2055 (HVAC capex compounding) — expect insurance premiums to compound above CPI over the hold.
Questions for the listing agent
- Built in 1935 — when were the roof, HVAC, electrical panel, plumbing, and water heater last replaced?
- Property tax is high relative to price — has the assessment been appealed recently, and will the sale trigger a re-assessment?
- Is there a deadline driving the sale (1031 exchange, divorce, estate, relocation)? That informs how much negotiation room exists.
- Schools are D-rated, which usually means shorter tenancies and higher turnover. Who's the typical renter profile here, and what's been the actual vacancy rate?
- Crime grade is F in this area — have there been break-ins, vandalism, or insurance claims at this property in the last 3 years? What carrier currently insures it and at what premium?
- What's the average days-on-market for RENTAL listings here right now (not sales)? A rising rental-DOM trend means longer vacancies and softer asking-rent achievability than the comps imply.
- What's the recent tenant-quality profile in this submarket — average credit score on applications, eviction rate, late-payment / NSF rate, and stable-employment percentage? A property-management company in the area should have these aggregated.
- How much new for-sale + rental construction is in the pipeline within 1–3 miles? Heavy new supply typically softens prices + rents 12–24 months out; constrained supply supports both.
Investment metrics
- 1% rule
- 1.66% ✓
- Cap rate
- 11.35%
- Cash-on-cash
- 18.05%
- DSCR
- 1.80
- GRM
- 5.0
CMA / ARV
- ARV (on-the-fly)
- $151,656
- Comps found
- 12
Show comp detail 12 sales within ~0.75 mi
| Address | Dist | Beds/Ba | Sqft | Sold | Price | $/sf | Match |
|---|---|---|---|---|---|---|---|
| 1124 Stowe St | 0.09mi | 2/1.0 (-1) | 984 (-8%) | 6mo | $140,000 | $142 | 73 |
| 605 Denby St | 0.33mi | 3/1.0 | 1,016 (-5%) | 12mo | $85,000 | $84 | 66 |
| 1213 Bookertee St | 0.13mi | 3/2.0 | 912 (-15%) | 7mo | $150,000 | $164 | 60 |
| 504 Stimpson St | 0.29mi | 3/2.0 | 1,216 (+14%) | 1mo | $179,990 | $148 | 58 |
| 209 Graham St | 0.47mi | 3/2.0 | 1,022 (-4%) | 18mo | $145,000 | $142 | 51 |
| 322 W Nazro St | 0.46mi | 3/2.0 | 1,166 (+9%) | 10mo | $189,000 | $162 | 51 |
| 15 High St | 0.65mi | 3/2.0 | 1,162 (+9%) | 3mo | $140,000 | $120 | 48 |
| 600 Neal St | 0.49mi | 3/1.0 | 1,172 (+10%) | 21mo | $160,000 | $137 | 44 |
| 423 W Pearce St | 0.61mi | 2/1.0 (-1) | 1,168 (+9%) | 17mo | $170,000 | $146 | 37 |
| 705 Bowie St | 0.64mi | 3/2.0 | 1,210 (+13%) | 15mo | $169,999 | $140 | 32 |
| 2003 Amelia St | 0.70mi | 2/1.0 (-1) | 912 (-15%) | 10mo | $157,000 | $172 | 30 |
| 708 Travis St | 0.67mi | 3/2.0 | 1,216 (+14%) | 18mo | $150,000 | $123 | 27 |
Match score weights: distance 35% · size 25% · config 20% · recency 20%. Top-matched comps best support the ARV.
Projected returns pro-forma
-3.0% appreciation · 1.3% rent growth · sell at horizon
- IRR
- 7.5%
- Equity multiple
- 1.28×
- Total profit
- $6,376
- Equity at exit
- $11,913
- IRR
- 15.0%
- Equity multiple
- 2.11×
- Total profit
- $24,789
- Equity at exit
- $6,908
Cash invested: $22,372 (down + closing). Projections, not guarantees.
Landlord ↔ Tenant lean methodology
- Overall (STATE)
- 87 Strongly Landlord-Friendly
- State Texas
- 87 Strongly Landlord-Friendly · R+5
- County
- — inherits STATE
- City
- — inherits STATE
ZIP-level market 77520
- Rents YoY
- 1.3%
- Active inventory
- 271
- Price-to-rent
- 5.0×
Monthly cashflow live
- Estimated rent
- $1,325 high interval (Pro) →
- Mortgage (P&I)
- −$419
- Tax from tax record
- −$258 /mo · $3,098/yr
- Insurance
- −$33
- HOA
- −$0
- Vacancy / Maint / Mgmt
- −$278
- Net cashflow
- $337
Break-even live
UW: 25.0% down · 7.5% · 30yr · 1.5% tax · 5.0% vac · 8.0% maint · 8.0% mgmt
Financing live
Cash to close
- Down payment
- $19,975
- Closing costs
- $2,397
- Reserves months
- —
- Total cash needed
- —
Loan-product check · same deal, 3 products live
Conventional
25% down · 7.5% · 30yr
- Down + closing
- —
- Monthly P&I
- —
- Monthly cashflow
- —
- DSCR
- —
- Eligible?
- —
Personal DTI + credit; lowest rate.
DSCR
20% down · 8.5% · 30yr
- Down + closing
- —
- Monthly P&I
- —
- Monthly cashflow
- —
- DSCR
- —
- Eligible?
- —
No personal income docs; deal must DSCR.
Hard money
10% down · 12.0% · 12mo
- Down + closing
- —
- Monthly P&I
- —
- Monthly cashflow
- —
- DSCR
- —
- Eligible?
- —
Short-term bridge; refi at stabilization.
Rent comps 10 comps
| Address | Beds | Baths | Sqft | Rent | $/sqft | DOM | Units | Dist |
|---|---|---|---|---|---|---|---|---|
| 811 Barrymore Blvd Baytown, TX | 3.0 | 2.0 | 1200 | $1,300 | $1.08 | 5d | 1 | 0.34mi |
| 1607 Garth Rd Baytown, TX | 2.0 | 2.0 | 1017 | $1,025 | $1.01 | 43d | 1 | 1.08mi |
| 1601 Garth Rd Baytown, TX | 2.0–3.0 | 1.0–2.5 | 1190 | $1,499 | $1.26 | 2d | 5 | 1.09mi |
| 508 Forrest St Baytown, TX | 2.0 | 1.0 | 980 | $1,299 | $1.33 | 5d | 1 | 1.09mi |
| 1305 Memorial Dr Baytown, TX | 1.0–2.0 | 1.0 | 845 | $1,193 | $1.41 | 24d | 3 | 1.15mi |
| 105 E Adoue St Baytown, TX | 3.0 | 1.0 | 1040 | $1,200 | $1.15 | 43d | 1 | 1.17mi |
| 1206 Missouri St Baytown, TX | 2.0 | 2.0 | 1046 | $1,023 | $0.98 | 43d | 1 | 1.24mi |
| 510 Williams Ave Baytown, TX | 1.0–2.0 | 1.0 | 699 | $1,599 | $2.29 | 2d | 5 | 1.29mi |
| 516 William Ave Baytown, TX | 2.0 | 1.0 | 931 | $1,250 | $1.34 | 43d | 1 | 1.29mi |
| 301 Tri City Beach Rd Baytown, TX | 1.0–2.0 | 1.0 | 792 | $1,350 | $1.70 | 43d | 1 | 1.45mi |
Listing history 46 events
-
2026-06-18days on market $79,900 Active 27 DOM
-
2026-06-17days on market $79,900 Active 26 DOM
-
2026-06-16days on market $79,900 Active 25 DOM
-
2026-06-15days on market $79,900 Active 24 DOM
-
2026-06-13days on market $79,900 Active 22 DOM
-
2026-06-09days on market $79,900 Active 18 DOM
-
2026-06-07days on market $79,900 Active 16 DOM
-
2026-06-04days on market $79,900 Active 13 DOM
-
2026-06-03pricedays on market $79,900 Active 12 DOM
-
2026-06-02days on market $84,900 Active 11 DOM
-
2026-06-01days on market $84,900 Active 10 DOM
-
2026-05-31days on market $84,900 Active 9 DOM
-
2026-05-22$84,900 Active
-
2026-02-14status Pending
-
2026-02-14historical
-
2026-01-17$92,000 Active
-
2026-01-17historical
-
2025-10-24price $104,000
-
2025-10-11price $110,000
-
2025-09-25price $120,000
-
2025-09-20price $132,500
-
2025-09-15$137,500 Active
-
2025-09-15historical
-
2025-08-01$145,000 Active
-
2024-11-15historical
-
2024-09-16$175,000 Active
-
2024-09-16historical
-
2024-08-29price $175,000
-
2024-07-22$185,000 Active
-
2024-07-13historical
-
2016-05-27soldstatus
-
2016-05-26soldstatus Sold
-
2016-05-11status Pending
-
2016-04-24status Active
-
2016-03-26status Pending
-
2016-03-10status Option Pending
-
2015-07-20$45,000 Active
-
2015-06-26historical
-
2015-03-16status Active
-
2015-03-07status Pending
-
2015-02-24status Active
-
2015-01-16status Pending
-
2015-01-02price $45,000
-
2014-02-04$68,500 Active
-
2013-09-24soldstatus
-
2000-02-25soldstatus
ⓘ Source: listings_history table (triggers on properties + properties_extension) + one-shot
backfill from property_details.listing_events for pre-trigger history.
Tax reassessment forecast TX · Resets to sale price
- Current annual tax
- $3,098 · $258/mo
- Projected year-2 tax
- $3,098 · $258/mo
- Expected delta
- $0/yr ($0/mo · 0.0%)
ⓘ Screening estimate from a state-policy table — verify with the county assessor before closing.
Climate risk First Street
- Flood 4/10 Moderate FEMA zone X (unshaded) · 13% chance over 30 yrs
- Wildfire 1/10 Low
- Heat 9/10 Extreme 7 d/yr ≥108°F today · 25 d/yr by 30 yrs out
- Wind 9/10 Extreme 99% chance of damaging wind over 30 yrs
- Air quality 2/10 Low 1 unhealthy d/yr today · 2 by 30 yrs out
Nearby sold comps map
Loading sold comps map…
Walkable amenities ~0.75 mi
Loading nearby amenities…
Taxation est. · year 1
- Rental income
- $15,904
- − Mortgage interest
- −$4,476
- − Property taxes
- −$3,098
- − Insurance
- −$400
- − Repairs & maintenance
- −$1,272
- − Management
- −$1,272
- − Depreciation
- −$2,324
- Taxable income
- $3,062
- Est. tax owed @ 24.0%
- −$735
- After-tax cash flow
- $3,304/yr
For passive investors: Depreciation is non-cash, so a rental often shows a tax loss while cash-flowing — sheltering income. Rental losses are passive: they offset passive income freely, and up to $25,000/yr can offset ordinary (W-2) income if you actively participate and your MAGI is under $100k (phasing out to $0 by $150k); unused losses carry forward. On sale, claimed depreciation is recaptured at up to 25%, and gains may owe capital-gains tax (a 1031 exchange can defer both). Figures are a year-1 estimate at your 24.0% rate — not tax advice; consult a CPA.
Schools (NCES district)
- District
- Goose Creek CISD
- NCES district ID
- 4821150
- Math proficiency
- 37% ▼ -11.00%
- Reading proficiency
- 36% ▼ -4.00%
- Median HH income
- $52,468
- Composite
- 31.84/100
- National rank
- #5877
- State rank
- #473 of 826 in TX
Livability — Baytown
- Score
- 69/100
- State rank
- #412
- US rank
- #8494
Category grades
Schools grade is shown separately in the Schools card above.
Census & demographics
- Census place
- Baytown, TX
- County
- Harris County · 4,702,590 people
- City population
- 135,579
- Metro
- Houston-The Woodlands-Sugar Land, TX
- Population (ZIP)
- 36,355
- Household income
- $54,278
- Rent vs Own
- Severe rent burden
- 1559.0
Population outlook (Harris County) Hauer SSP2
- Today (2025)
- 5,571,493 people
- By 2030
- 6,089,821 · +9.3%
- By 2040
- 7,142,806 · +28.2%
- By 2050
- 8,185,864 · +46.9%
- By 2075
- 10,574,329 · +89.8%
- By 2100
- 12,109,958 · +117.4%
Race, ethnicity, and origin ACS 2023
- Neighborhood character
- Diverse neighborhood (Simpson 0.60)
- Race & ethnicity
- Hispanic / Latino 55% White 30% Two or more races 19% Black 10% Asian 2%
- Hispanic origin (detail)
- Mexican 48%
- Common ancestry
- Italian 1% Lithuanian 1% Romanian 1%
- Foreign-born
- 21% · Canada, Vietnam
- Languages at home
- 55% English-only · Spanish 43% Other Asian/Pacific 1% Other Indo-European 1%
Political lean MEDSL · Harris
- 2024 margin
- Lean D (+5.5) · D 52.0% · R 46.4% · Other 1.6%
- 2008→2024 swing
- +3.9pp toward D · 2008: 1.6pp · 2024: 5.5pp
- All cycles
- 2024: D+5.5 2020: D+13.3 2016: D+12.4 2012: D+0.1 2008: D+1.6
Not yet ingested
- Civics
- —
Market trends
- HPI YoY
- ▼ -143.36%
- Current HPI
- 262.066
- Rent YoY
- ▲ 1.30%
- Metro
- Houston-The Woodlands-Sugar Land, TX
- State GDP YoY
- ▲ 3.95%
- F500 in state
- 110
Industry mix (Fortune 500 HQ in TX)
| Industry | F500 HQs | Revenue |
|---|---|---|
| Energy | 16 | $1,198B |
|
||
| Technology | 5 | $198B |
|
||
| Engineering / Construction | 4 | $72B |
|
||
| Energy Services | 3 | $60B |
|
||
| Utilities | 3 | $41B |
|
||
| Healthcare | 2 | $330B |
|
||
Price history
+23.9% since first listed34 events — show timeline
- 2026-05-22 Listed $84,900 HARMLS
- 2026-02-14 Pending — HARMLS
- 2026-02-14 Listing Removed — HARMLS
- 2026-01-17 Listing Removed — HARMLS
- 2026-01-17 Listed $92,000 HARMLS
- 2025-10-24 Price Changed $104,000 HARMLS
- 2025-10-11 Price Changed $110,000 HARMLS
- 2025-09-25 Price Changed $120,000 HARMLS
- 2025-09-20 Price Changed $132,500 HARMLS
- 2025-09-15 Listing Removed — HARMLS
- 2025-09-15 Listed $137,500 HARMLS
- 2025-08-01 Listed $145,000 HARMLS
- 2024-11-15 Listing Removed — HARMLS
- 2024-09-16 Listing Removed — HARMLS
- 2024-09-16 Listed $175,000 HARMLS
- 2024-08-29 Price Changed $175,000 HARMLS
- 2024-07-22 Listed $185,000 HARMLS
- 2024-07-13 Coming Soon — HARMLS
- 2016-05-27 Sold (Public Records) — Public Records
- 2016-05-26 Sold (MLS) — HARMLS
- 2016-05-11 Pending — HARMLS
- 2016-04-24 Relisted — HARMLS
- 2016-03-26 Pending — HARMLS
- 2016-03-10 Pending — HARMLS
- 2015-07-20 Listed $45,000 HARMLS
- 2015-06-26 Listing Removed — HARMLS
- 2015-03-16 Relisted — HARMLS
- 2015-03-07 Pending — HARMLS
- 2015-02-24 Relisted — HARMLS
- 2015-01-16 Pending — HARMLS
- 2015-01-02 Price Changed $45,000 HARMLS
- 2014-02-04 Listed $68,500 HARMLS
- 2013-09-24 Sold (Public Records) — Public Records
- 2000-02-25 Sold (Public Records) — Public Records
Property tax history
+7.8%/yrLatest (2025): $3,098 · +0.3% YoY. Source: county tax records.
Cash-flow waterfall
monthlySold comps — $/sqft
last 12 mo · ≤1 miLoading sold comps…