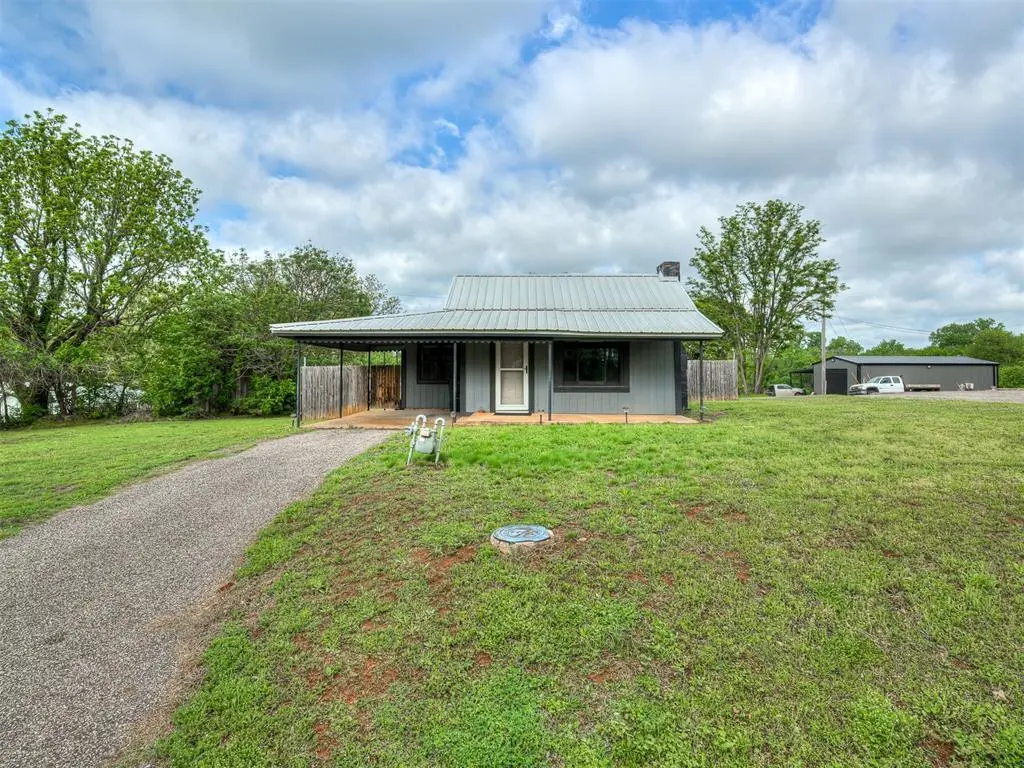
403 Fir St · Wellston, OK
Flood risk 1/10 · Minimal
- FEMA flood zone
- X (unshaded)
- Chance of flooding over 30 yrs
- 0.0%
- Est. flood insurance / yr
- $507 – $1,088
Fire risk 5/10 · Moderate
- Est. fire insurance / yr
- $2,463 – $4,575
Heat risk 6/10 · Moderate
- Hot days now (above 110°F)
- 7 days/yr
- Hot days in 30 yrs
- 19 days/yr
Wind risk 3/10 · Minor
- Chance of severe wind over 30 yrs
- 4.0%
Air-quality risk 2/10 · Minimal
- Unhealthy air days now
- 1 days/yr
- Unhealthy air days in 30 yrs
- 1 days/yr
Risk factors via First Street. Map © Google.
Why this score? — see what drove the D+ grade
The composite is a weighted blend of 9 inputs, each scored 0–100. Each bar is that input's sub-score; the figure is the points it added to the 100-point composite (weight × sub-score).
- Cash flow +11.8/30.0
- Appreciation +9.6/10.0
- ARV discount +7.5/15.0
- DSCR +3.5/10.0
- Livability +3.1/5.0
- Schools +2.6/10.0
- 1% rule +2.5/10.0
- Rent growth +2.5/5.0
- Condition / age +2.5/5.0
$110,000
🖨 Deal sheet (PDF) 📄 Offer letter ✓ Due diligence
Listing remarks MLS
Well maintained home with mock fireplace, newer windows, metal roof, nice wood deck in back and full stockade fenced yard.
Key facts
- Metal roof
- Wood deck
- Newer windows
Tags
Property features AI
Finance
- Other: Interior lot; Homestead: No; Legal addition: Wellston
- Financial info: Loan qualification: Yes
- HOA & community: No mandatory association dues
Exterior
- Parking: Concrete parking; 1-car garage
- Utilities: Storm doors (energy feature)
- Home design: Single-family residence; One-level property; Residential property; Existing property
- Construction: Frame construction; Metal roof; Conventional foundation
- Exterior features: Covered porch; Open deck; Storage; Wood fencing; Below-ground outdoor storm shelter
Interior
- Kitchen: Freestanding gas range/oven; Microwave
- Bedrooms: 1 bedroom
- Flooring: Laminate flooring
- Bathrooms: 1 full bathroom
- Heating & cooling: Other heating; Other cooling
- Interior features: Ceiling fans; Window treatments; Mock fireplace; Inside utility (other room)
- Laundry & utility: Inside utility; Tankless hot water
Neighborhood map
What this means for you Summary
Snapshot
- This is a 2-bed/1.0-bath single-family listed at $110k.
Deal economics
- At list price, monthly cash flow is $-29 ($-352/yr) — negative.
- To cash-flow at today's rent, offer at most $105k (4.7% below list).
- To meet the 1% rule (rent ≥ 1% of price), the offer needs to be $82k (25.2% below list).
- Recommended offer: $82k (25.2% below list) — sets the bar for 1% rule.
- Cap rate 6.0% vs local median 3.1% in Wellston — top-decile yield for the area; either an underpriced asset or a hidden risk that comps aren't pricing in. Stress-test before assuming the spread holds.
Location & tenants
- Location reads 62/100 on livability (#248 in OK) — a middle-class / working-renter tenant base. Strengths: cost of living A+, crime B+; Watch: amenities F, commute F, health & safety D-.
- Wellston (rural): math 26% / reading 34% proficiency, ranked #59 of 270 in OK (top 22%) — families likely to look elsewhere, expect single-tenant / working-renter base with shorter leases.
- Zoned schools: Wellston Es (math 32% / reading 37%, grade F, #168 of 845 statewide, top 24%, 259 students, 0% FRL); Wellston Ms (math 17% / reading 27%, grade F, #129 of 345 statewide, top 42%, 126 students, 0% FRL); Wellston Hs (math 34% / reading 34%, grade F, #48 of 447 statewide, top 14%, 129 students, 0% FRL) — zoned schools average 0% FRL vs 46% district-wide (46 pts lower); this property's tenant base skews higher-income than the district average.
- Market conditions: 81 active listings in the ZIP; 19 units permitted in Lincoln County in 2024 (0 in 5+ unit buildings).
Forward outlook
- In year one you build about $11k of equity ($761 loan paydown + $10k appreciation (9.2% local appreciation)).
- At projected returns (9.2% appreciation + 3.0% rent growth), your $31k cash investment doubles in ~3 years — after that, you're playing with house money.
- By year 4, paydown + projected appreciation supports a ~$38k cash-out refi (75% LTV) — recoverable capital for the next deal without selling this one.
Negotiation context
- It's been on market 60 days — a 3% lower offer ($107k) is reasonable based on typical stale-listing flexibility.
- 5 sale attempts since 20y ago with the ask held roughly flat each time — persistent listings suggest the price (not the market) is what's stuck; bring a comps-based counter.
- Current owner paid $66k; list at $110k implies a 68% gain — meaningful room to come down on a strong offer.
Risks & watch-outs
- Watch-outs: built in 1920 — expect roof / HVAC / electrical / plumbing capex.
- Climate carrying-cost: moderate wildfire risk; extreme-heat days projected 7→19/yr by 2055 (HVAC capex compounding) — expect insurance premiums to compound above CPI over the hold.
Questions for the listing agent
- What do current leases actually rent for vs. the listed asking? Can we see a recent rent roll and the last 12 months of T-12 income?
- It's been on market 60 days. Have you received any prior offers? Is the seller open to a 25% concession, seller financing, or rate buy-down credit?
- Built in 1920 — when were the roof, HVAC, electrical panel, plumbing, and water heater last replaced?
- Is there a deadline driving the sale (1031 exchange, divorce, estate, relocation)? That informs how much negotiation room exists.
- Schools are D-rated, which usually means shorter tenancies and higher turnover. Who's the typical renter profile here, and what's been the actual vacancy rate?
- The area grade is low — what's the realistic commute time and amenity access for the typical tenant pool here? Any planned neighborhood developments (good or bad) we should know about?
- What's the average days-on-market for RENTAL listings here right now (not sales)? A rising rental-DOM trend means longer vacancies and softer asking-rent achievability than the comps imply.
- What's the recent tenant-quality profile in this submarket — average credit score on applications, eviction rate, late-payment / NSF rate, and stable-employment percentage? A property-management company in the area should have these aggregated.
- How much new for-sale + rental construction is in the pipeline within 1–3 miles? Heavy new supply typically softens prices + rents 12–24 months out; constrained supply supports both.
Investment metrics
- 1% rule
- 0.75% ✗
- Cap rate
- 5.97%
- Cash-on-cash
- -1.14%
- DSCR
- 0.95
- GRM
- 11.1
CMA / ARV
- ARV (on-the-fly)
- $41,760
- Comps found
- 1
Show comp detail 1 sale within ~0.75 mi
| Address | Dist | Beds/Ba | Sqft | Sold | Price | $/sf | Match |
|---|---|---|---|---|---|---|---|
| 811 Ash St | 0.49mi | 3/1.0 (+1) | 760 (+6%) | 10mo | $44,000 | $58 | 54 |
Match score weights: distance 35% · size 25% · config 20% · recency 20%. Top-matched comps best support the ARV.
Projected returns pro-forma
9.15% appreciation · 3.0% rent growth · sell at horizon
- IRR
- 21.6%
- Equity multiple
- 2.68×
- Total profit
- $51,656
- Equity at exit
- $92,345
- IRR
- 19.6%
- Equity multiple
- 5.94×
- Total profit
- $152,153
- Equity at exit
- $192,374
Cash invested: $30,800 (down + closing). Projections, not guarantees.
Landlord ↔ Tenant lean methodology
- Overall (STATE)
- 83 Strongly Landlord-Friendly
- State Oklahoma
- 83 Strongly Landlord-Friendly · R+20
- County
- — inherits STATE
- City
- — inherits STATE
ZIP-level market 74881
- Home prices YoY
- 3.0%
- Active inventory
- 81
- Price-to-rent
- 11.1×
Monthly cashflow live
- Estimated rent
- $823 medium interval (Pro) →
- Mortgage (P&I)
- −$577
- Tax from tax record
- −$57 /mo · $683/yr
- Insurance
- −$46
- HOA
- −$0
- Vacancy / Maint / Mgmt
- −$173
- Net cashflow
- $-29
Break-even live
Sensitivity live
| Price | -10% $33 | -5% $2 | +0% $-29 | +5% $-60 | +10% $-92 |
|---|---|---|---|---|---|
| Rent | -10% $-94 | -5% $-62 | +0% $-29 | +5% $3 | +10% $36 |
| Rate | -1.0pp $26 | -0.5pp $-1 | base $-29 | +0.5pp $-58 | +1.0pp $-87 |
UW: 25.0% down · 7.5% · 30yr · 1.5% tax · 5.0% vac · 8.0% maint · 8.0% mgmt
Financing live
Cash to close
- Down payment
- $27,500
- Closing costs
- $3,300
- Reserves months
- —
- Total cash needed
- —
Loan-product check · same deal, 3 products live
Conventional
25% down · 7.5% · 30yr
- Down + closing
- —
- Monthly P&I
- —
- Monthly cashflow
- —
- DSCR
- —
- Eligible?
- —
Personal DTI + credit; lowest rate.
DSCR
20% down · 8.5% · 30yr
- Down + closing
- —
- Monthly P&I
- —
- Monthly cashflow
- —
- DSCR
- —
- Eligible?
- —
No personal income docs; deal must DSCR.
Hard money
10% down · 12.0% · 12mo
- Down + closing
- —
- Monthly P&I
- —
- Monthly cashflow
- —
- DSCR
- —
- Eligible?
- —
Short-term bridge; refi at stabilization.
Listing history 32 events
-
2026-06-21days on market $110,000 Active 60 DOM
-
2026-06-21days on market $110,000 Active 59 DOM
-
2026-06-18days on market $110,000 Active 57 DOM
-
2026-06-17days on market $110,000 Active 56 DOM
-
2026-06-16days on market $110,000 Active 55 DOM
-
2026-06-15days on market $110,000 Active 54 DOM
-
2026-06-13days on market $110,000 Active 52 DOM
-
2026-06-12days on market $110,000 Active 51 DOM
-
2026-06-09days on market $110,000 Active 48 DOM
-
2026-06-08days on market $110,000 Active 47 DOM
-
2026-06-08days on market $110,000 Active 46 DOM
-
2026-06-07days on market $110,000 Active 45 DOM
-
2026-06-04days on market $110,000 Active 42 DOM
-
2026-06-02days on market $110,000 Active 41 DOM
-
2026-06-01days on market $110,000 Active 40 DOM
-
2026-05-31days on market $110,000 Active 39 DOM
-
2026-04-22$110,000 Active
-
2022-03-30soldstatus $65,500
-
2022-03-25soldstatus $65,500 Sold 122-char remark
Show marketing remark (122 chars)
Well maintained home with mock fireplace, newer windows, metal roof, nice wood deck in back and full stockade fenced yard.
-
2022-03-05status Pending 122-char remark
Show marketing remark (122 chars)
Well maintained home with mock fireplace, newer windows, metal roof, nice wood deck in back and full stockade fenced yard.
-
2022-02-20$69,000 Active 122-char remark
Show marketing remark (122 chars)
Well maintained home with mock fireplace, newer windows, metal roof, nice wood deck in back and full stockade fenced yard.
-
2022-02-01soldstatus $47,500
-
2018-03-03status Pending 59-char remark
Show marketing remark (59 chars)
Great Home For Sale in Wellston *** Agent Related to Seller
-
2018-03-02soldstatus $49,000 Sold 59-char remark
Show marketing remark (59 chars)
Great Home For Sale in Wellston *** Agent Related to Seller
-
2018-03-02soldstatus $49,000
Show marketing remark (59 chars)
Great Home For Sale in Wellston *** Agent Related to Seller
-
2018-02-16$55,000 Active 59-char remark
Show marketing remark (59 chars)
Great Home For Sale in Wellston *** Agent Related to Seller
-
2007-10-05soldstatus $36,000
-
2007-09-27soldstatus $36,000
-
2007-09-11$36,000
-
2006-07-31soldstatus $22,000
-
2006-07-28soldstatus $22,500
-
2006-05-17$25,000
ⓘ Source: listings_history table (triggers on properties + properties_extension) + one-shot
backfill from property_details.listing_events for pre-trigger history.
Tax reassessment forecast OK · Resets to sale price
- Current annual tax
- $683 · $57/mo
- Projected year-2 tax
- $990 · $82/mo
- Expected delta
- +$307/yr (+$26/mo · 44.9%)
ⓘ Screening estimate from a state-policy table — verify with the county assessor before closing.
Climate risk First Street
- Flood 1/10 Low FEMA zone X (unshaded) · 0% chance over 30 yrs
- Wildfire 5/10 Major
- Heat 6/10 Major 7 d/yr ≥110°F today · 19 d/yr by 30 yrs out
- Wind 3/10 Moderate 4% chance of damaging wind over 30 yrs
- Air quality 2/10 Low 1 unhealthy d/yr today · 1 by 30 yrs out
Nearby sold comps map
Loading sold comps map…
Walkable amenities ~0.75 mi
Loading nearby amenities…
Taxation est. · year 1
- Rental income
- $9,877
- − Mortgage interest
- −$6,162
- − Property taxes
- −$683
- − Insurance
- −$550
- − Repairs & maintenance
- −$790
- − Management
- −$790
- − Depreciation
- −$3,200
- Taxable loss
- −$2,298
- Est. tax savings @ 24.0%
- +$551
- After-tax cash flow
- $199/yr
For passive investors: Depreciation is non-cash, so a rental often shows a tax loss while cash-flowing — sheltering income. Rental losses are passive: they offset passive income freely, and up to $25,000/yr can offset ordinary (W-2) income if you actively participate and your MAGI is under $100k (phasing out to $0 by $150k); unused losses carry forward. On sale, claimed depreciation is recaptured at up to 25%, and gains may owe capital-gains tax (a 1031 exchange can defer both). Figures are a year-1 estimate at your 24.0% rate — not tax advice; consult a CPA.
Schools (NCES district)
- District
- Wellston
- NCES district ID
- 4032280
- Math proficiency
- 26% ▼ -9.00%
- Reading proficiency
- 34% ▼ -6.00%
- Median HH income
- $44,907
- Composite
- 25.69/100
- National rank
- #7390
- State rank
- #59 of 270 in OK
Livability — Wellston
- Score
- 62/100
- State rank
- #248
- US rank
- #16617
Category grades
Schools grade is shown separately in the Schools card above.
Census & demographics
- Census place
- Wellston, OK
- Population (ZIP)
- 5,273
Population outlook (Lincoln County) Hauer SSP2
- Today (2025)
- 36,104 people
- By 2030
- 36,435 · +0.9%
- By 2040
- 36,696 · +1.6%
- By 2050
- 36,216 · +0.3%
- By 2075
- 35,057 · -2.9%
- By 2100
- 31,333 · -13.2%
Race, ethnicity, and origin ACS 2023
- Neighborhood character
- Predominantly White (85%)
- Race & ethnicity
- White 85% Two or more races 6% Hispanic / Latino 5% Native American 5%
- Hispanic origin (detail)
- Mexican 4%
- Common ancestry
- Slovak 2% Italian 2% Lithuanian 1%
- Foreign-born
- 1% · Canada
- Languages at home
- 98% English-only · Spanish 2%
Political lean MEDSL · Lincoln
- 2024 margin
- Solid R (+63.3) · D 17.5% · R 80.8% · Other 1.7%
- 2008→2024 swing
- -13.4pp toward R · 2008: -49.8pp · 2024: -63.3pp
- All cycles
- 2024: R+63.3 2020: R+63.2 2016: R+60.1 2012: R+49.0 2008: R+49.8
Not yet ingested
- Civics
- —
Market trends
- HPI YoY
- ▲ 9.15%
- Current HPI
- 308.8101
- Rent YoY
- —
- Metro
- —
- State GDP YoY
- ▲ 1.55%
- F500 in state
- 6
Industry mix (Fortune 500 HQ in OK)
| Industry | F500 HQs | Revenue |
|---|---|---|
| Energy | 3 | $48B |
|
||
Price history
+340.0% since first listed16 events — show timeline
- 2026-04-22 Listed $110,000 MLSOK
- 2022-03-30 Sold (Public Records) $65,500 Public Records
- 2022-03-25 Sold (MLS) $65,500 MLSOK
- 2022-03-05 Pending — MLSOK
- 2022-02-20 Listed $69,000 MLSOK
- 2022-02-01 Sold (Public Records) $47,500 Public Records
- 2018-03-03 Pending — MLSOK
- 2018-03-02 Sold (Public Records) $49,000 Public Records
- 2018-03-02 Sold (MLS) $49,000 MLSOK
- 2018-02-16 Listed $55,000 MLSOK
- 2007-10-05 Sold (Public Records) $36,000 Public Records
- 2007-09-27 Sold (MLS) $36,000 MLSOK
- 2007-09-11 Listed $36,000 MLSOK
- 2006-07-31 Sold (Public Records) $22,000 Public Records
- 2006-07-28 Sold (MLS) $22,500 MLSOK
- 2006-05-17 Listed $25,000 MLSOK
Property tax history
+7.3%/yrLatest (2025): $683 · +14.0% YoY. Source: county tax records.
Cash-flow waterfall
monthlySold comps — $/sqft
last 12 mo · ≤1 miLoading sold comps…