 🏗️ New Construction
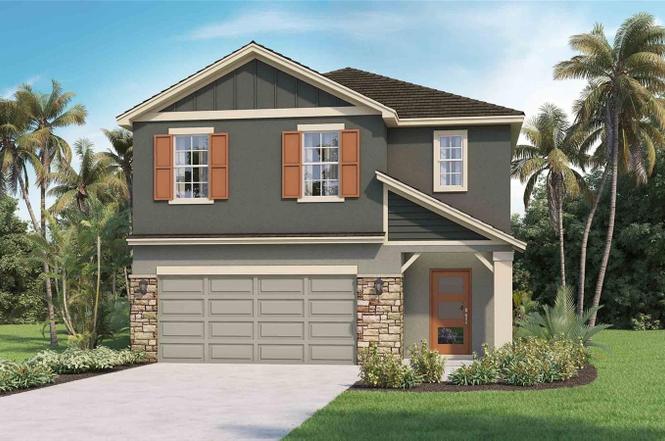
5255 Berry Bay Ave · Wimauma, FL
Flood risk No data
- FEMA flood zone
- —
- Chance of flooding over 30 yrs
- —
- Est. flood insurance / yr
- —
Fire risk No data
- Est. fire insurance / yr
- —
Heat risk No data
- Hot days now (above threshold)
- —
- Hot days in 30 yrs
- —
Wind risk No data
- Chance of severe wind over 30 yrs
- —
Air-quality risk No data
- Unhealthy air days now
- —
- Unhealthy air days in 30 yrs
- —
Risk factors via First Street. Map © Google.
Why this score? — see what drove the D grade
The composite is a weighted blend of 9 inputs, each scored 0–100. Each bar is that input's sub-score; the figure is the points it added to the 100-point composite (weight × sub-score).
- Cash flow +13.0/30.0
- ARV discount +7.5/15.0
- Schools +4.2/10.0
- DSCR +3.9/10.0
- Appreciation +3.8/10.0
- Livability +3.2/5.0
- 1% rule +3.1/10.0
- Condition / age +2.5/5.0
- Rent growth +1.9/5.0
$369,990
🖨 Deal sheet 📄 Offer letter ✓ Due diligence
Listing remarks
Under Construction. The builder is offering buyers up to $25,000 towards closing costs with the use of a preferred lender and title company. Located off US-301 and showcasing new homes in Wimauma, Berry Bay is one of the newest communities in the area. Just minutes from I-75, providing quick access to St. Pete, Downtown Tampa, Sarasota, as well as the bay. Berry Bay will feature a new homes lineup of our Express and Preferred series throughout the community. Berry Bay features include extended luxury vinyl in the main living and dining area, a stainless-steel appliance package, quartz countertops in the kitchen, all concrete block construction on the 1st and 2nd stories, and Smart Home syst
Key facts
- Quartz countertops
- Quick access to i-75
- Smart home system
Tags
Property features AI
Finance
- Other: Home warranty provided; CDD applies
- Financial info: Other annual assessment: $2,490; Total monthly fees: $7
- HOA & community: HOA managed by Inframark; Monthly HOA fee of $7; Association amenities: Clubhouse, Playground, Pool; Pets allowed
Exterior
- Parking: Attached 2-car garage
- Utilities: Public water; Public sewer; Underground utilities
- Home design: Single-family residence; Residential property; Two levels; North-facing; Under construction (projected completion: 2026-09-30); Deed-restricted community
- Construction: Block and stucco construction; Shingle roof; New construction; Slab foundation; Builder: D.R. Horton; Builder model: Robie MC; Builder license: CBC039052; Permit number: 25-0079658; Year built: new construction
- Exterior features: Sidewalk; Pool (other features)
Interior
- Kitchen: Dishwasher; Microwave; Range; Refrigerator
- Bedrooms: 5 bedrooms
- Flooring: Carpet; Ceramic tile
- Bathrooms: 3 full bathrooms
- Heating & cooling: Electric heating; Heat pump; Central air conditioning
- Interior features: Open floorplan; Blinds; Double-pane windows
- Laundry & utility: Laundry room; Washer; Dryer; Irrigation equipment
Neighborhood map
What this means for you Summary
Snapshot
- This is a 5-bed/3.0-bath land listed at $370k.
Deal economics
- At list price, monthly cash flow is $-18 ($-216/yr) — negative.
- To cash-flow at today's rent, offer at most $367k (0.9% below list).
- To meet the 1% rule (rent ≥ 1% of price), the offer needs to be $298k (19.4% below list).
- Recommended offer: $298k (19.4% below list) — sets the bar for 1% rule.
- Cap rate 6.2% vs local median 4.5% in Wimauma — top-decile yield for the area; either an underpriced asset or a hidden risk that comps aren't pricing in. Stress-test before assuming the spread holds.
Location & tenants
- Location reads 64/100 on livability (#699 in FL) — a middle-class / working-renter tenant base. Strengths: commute A, cost of living A-, crime B; Watch: amenities F, employment D-, health & safety F.
- Hillsborough (suburban): math 47% / reading 50% proficiency, ranked #41 of 73 in FL (top 56%) — families likely to look elsewhere, expect single-tenant / working-renter base with shorter leases.
- Zoned schools: Reddick Elementary School (math 34% / reading 29%, grade F, #1,841 of 2,144 statewide, top 86%, 794 students, 78% FRL); Jule F Sumner High School (math 43% / reading 43%, grade F, #255 of 667 statewide, top 39%, 3,827 students, 43% FRL).
- Market conditions: Rents soft (-2.5%/yr); 674 active listings in the ZIP; 5 comparable units currently listed for rent nearby; rentals at typical pace (median 24d on market — plan ~3-4 weeks tenant-placement turnaround); solid renter incomes; 9,053 units permitted in Hillsborough County in 2024 (4,555 in 5+ unit buildings).
- This rent runs 37% of the median local income ($98k/yr) — at the standard rent-burdened threshold; future hikes will face affordability resistance.
Forward outlook
- Local home prices are declining (-2.4%/yr); year-one equity from $3k of loan paydown is wiped out by about $9k of value loss. Plan a longer hold.
- Hillsborough County population projected at +37% by 2050 — long-run rental-demand tailwind backs the buy-and-hold thesis.
Negotiation context
- It's been on market 59 days — a 3% lower offer ($359k) is reasonable based on typical stale-listing flexibility.
Questions for the listing agent
- What do current leases actually rent for vs. the listed asking? Can we see a recent rent roll and the last 12 months of T-12 income?
- It's been on market 59 days. Have you received any prior offers? Is the seller open to a 19% concession, seller financing, or rate buy-down credit?
- What does the HOA fee cover, when was the last increase, and are there any pending special assessments or reserve-fund shortfalls?
- Is there a deadline driving the sale (1031 exchange, divorce, estate, relocation)? That informs how much negotiation room exists.
- Schools are F-rated, which usually means shorter tenancies and higher turnover. Who's the typical renter profile here, and what's been the actual vacancy rate?
- The area grade is low — what's the realistic commute time and amenity access for the typical tenant pool here? Any planned neighborhood developments (good or bad) we should know about?
- What's the average days-on-market for RENTAL listings here right now (not sales)? A rising rental-DOM trend means longer vacancies and softer asking-rent achievability than the comps imply.
- What's the recent tenant-quality profile in this submarket — average credit score on applications, eviction rate, late-payment / NSF rate, and stable-employment percentage? A property-management company in the area should have these aggregated.
- How much new for-sale + rental construction is in the pipeline within 1–3 miles? Heavy new supply typically softens prices + rents 12–24 months out; constrained supply supports both.
Investment metrics
- 1% rule
- 0.81% ✗
- Cap rate
- 6.23%
- Cash-on-cash
- -0.21%
- DSCR
- 0.99
- GRM
- 10.3
CMA / ARV
No comps found within radius.
Projected returns pro-forma
-2.35% appreciation · 0.0% rent growth · sell at horizon
- IRR
- -15.6%
- Equity multiple
- 0.42×
- Total profit
- $-59,694
- Equity at exit
- $66,033
- IRR
- -12.4%
- Equity multiple
- 0.24×
- Total profit
- $-78,563
- Equity at exit
- $50,972
Cash invested: $103,597 (down + closing). Projections, not guarantees.
Landlord ↔ Tenant lean methodology
- Overall (STATE)
- 87 Strongly Landlord-Friendly
- State Florida
- 87 Strongly Landlord-Friendly · R+3
- County
- — inherits STATE
- City
- — inherits STATE
ZIP-level market 33598
- Home prices YoY
- -0.9%
- Rents YoY
- -2.5%
- Active inventory
- 674
- Price-to-rent
- 10.3×
Monthly cashflow live
- Estimated rent
- $2,983 high interval (Pro) →
- Mortgage (P&I)
- −$1,940
- Tax from tax record
- −$273 /mo · $3,277/yr
- Insurance
- −$154
- HOA
- −$7
- Vacancy / Maint / Mgmt
- −$626
- Net cashflow
- $-18
Break-even live
UW: 25.0% down · 7.5% · 30yr · 1.5% tax · 5.0% vac · 8.0% maint · 8.0% mgmt
Financing live
Cash to close
- Down payment
- $92,498
- Closing costs
- $11,100
- Reserves months
- —
- Total cash needed
- —
Loan-product check · same deal, 3 products live
Conventional
25% down · 7.5% · 30yr
- Down + closing
- —
- Monthly P&I
- —
- Monthly cashflow
- —
- DSCR
- —
- Eligible?
- —
Personal DTI + credit; lowest rate.
DSCR
20% down · 8.5% · 30yr
- Down + closing
- —
- Monthly P&I
- —
- Monthly cashflow
- —
- DSCR
- —
- Eligible?
- —
No personal income docs; deal must DSCR.
Hard money
10% down · 12.0% · 12mo
- Down + closing
- —
- Monthly P&I
- —
- Monthly cashflow
- —
- DSCR
- —
- Eligible?
- —
Short-term bridge; refi at stabilization.
Rent comps 5 comps
| Address | Beds | Baths | Sqft | Rent | $/sqft | DOM | Units | Dist |
|---|---|---|---|---|---|---|---|---|
| 3160 Oyster Cove St Wimauma, FL | 4.0 | 2.5 | 1925 | $2,350 | $1.22 | 24d | 1 | 0.32mi |
| 5517 Blue Azure Dr Wimauma, FL | 4.0 | 2.0 | 1841 | $2,450 | $1.33 | 24d | 1 | 0.41mi |
| 5517 Blue Azure Dr Wimauma, FL | 4.0 | 2.0 | 1841 | $2,450 | $1.33 | 15d | 1 | 0.41mi |
| 5375 Blue Horizon Way Wimauma, FL | 6.0 | 3.0 | 3326 | $3,000 | $0.90 | 1d | 1 | 0.43mi |
| 2881 Silver Scallop Loop Wimauma, FL | 6.0 | 3.0 | 3130 | $2,900 | $0.93 | 24d | 1 | 0.60mi |
HOA detail
- Monthly dues
- $7 · $84/yr
Listing history 7 events
-
2026-05-01status Pending
-
2026-04-22price $369,990
-
2026-04-15price $374,990
-
2026-03-26price $379,990
-
2026-03-10price $384,990
-
2026-03-04price $390,990
-
2026-03-03$389,990 Active
ⓘ Source: listings_history table (triggers on properties + properties_extension) + one-shot
backfill from property_details.listing_events for pre-trigger history.
Tax reassessment forecast FL · Resets to sale price
- Current annual tax
- $3,277 · $273/mo
- Projected year-2 tax
- $3,277 · $273/mo
- Expected delta
- $0/yr ($0/mo · 0.0%)
ⓘ Screening estimate from a state-policy table — verify with the county assessor before closing.
Nearby sold comps map
Loading sold comps map…
Walkable amenities ~0.75 mi
Loading nearby amenities…
Taxation est. · year 1
- Rental income
- $35,796
- − Mortgage interest
- −$20,725
- − Property taxes
- −$3,277
- − Insurance
- −$1,850
- − Repairs & maintenance
- −$2,864
- − Management
- −$2,864
- − HOA
- −$84
- − Depreciation
- −$10,763
- Taxable loss
- −$6,631
- Est. tax savings @ 24.0%
- +$1,592
- After-tax cash flow
- $1,376/yr
For passive investors: Depreciation is non-cash, so a rental often shows a tax loss while cash-flowing — sheltering income. Rental losses are passive: they offset passive income freely, and up to $25,000/yr can offset ordinary (W-2) income if you actively participate and your MAGI is under $100k (phasing out to $0 by $150k); unused losses carry forward. On sale, claimed depreciation is recaptured at up to 25%, and gains may owe capital-gains tax (a 1031 exchange can defer both). Figures are a year-1 estimate at your 24.0% rate — not tax advice; consult a CPA.
Schools (NCES district)
- District
- Hillsborough
- NCES district ID
- 1200870
- Math proficiency
- 47% ▼ -8.00%
- Reading proficiency
- 50% ▼ -4.00%
- Median HH income
- $50,622
- Composite
- 41.6/100
- National rank
- #3435
- State rank
- #41 of 73 in FL
Livability — Wimauma
- Score
- 64/100
- State rank
- #699
- US rank
- #14659
Category grades
Schools grade is shown separately in the Schools card above.
Census & demographics
- Census place
- Wimauma, FL
- County
- Hillsborough County · 1,540,968 people
- City population
- 32,820
- Metro
- Tampa-St. Petersburg-Clearwater, FL
- Population (ZIP)
- 32,820
- Household income
- $97,520
- Rent vs Own
- Severe rent burden
- 149.0
Population outlook (Hillsborough County) Hauer SSP2
- Today (2025)
- 1,607,022 people
- By 2030
- 1,733,968 · +7.9%
- By 2040
- 1,979,565 · +23.2%
- By 2050
- 2,203,427 · +37.1%
- By 2075
- 2,667,893 · +66.0%
- By 2100
- 2,891,558 · +79.9%
Race, ethnicity, and origin ACS 2023
- Neighborhood character
- Diverse neighborhood (Simpson 0.67)
- Race & ethnicity
- White 40% Hispanic / Latino 39% Black 14% Two or more races 11% Asian 2%
- Hispanic origin (detail)
- Mexican 26% Puerto Rican 3% Cuban 1%
- Common ancestry
- Romanian 2% Scotch-Irish 2% Lithuanian 1%
- Foreign-born
- 23% · Canada, Jamaica, Guatemala
- Languages at home
- 62% English-only · Spanish 35% Other Indo-European 1% Arabic 1%
Political lean MEDSL · Hillsborough
- 2024 margin
- Toss-up / Even · D 47.8% · R 50.9% · Other 1.3%
- 2008→2024 swing
- -10.2pp toward R · 2008: 7.1pp · 2024: -3.1pp
- All cycles
- 2024: R+3.1 2020: D+6.9 2016: D+6.8 2012: D+6.7 2008: D+7.1
Not yet ingested
- Civics
- —
Market trends
- HPI YoY
- ▼ -2.35%
- Current HPI
- 271.8552
- Rent YoY
- ▼ -2.50%
- Metro
- Tampa-St. Petersburg-Clearwater, FL
- State GDP YoY
- ▲ 3.28%
- F500 in state
- 36
Industry mix (Fortune 500 HQ in FL)
| Industry | F500 HQs | Revenue |
|---|---|---|
| Industrial Technology | 2 | $29B |
|
||
| Insurance | 2 | $17B |
|
||
| Retail | 1 | $60B |
|
||
| Technology Distribution | 1 | $58B |
|
||
| Homebuilding | 1 | $35B |
|
||
| Technology Manufacturing | 1 | $35B |
|
||
Price history
-5.1% since first listed7 events — show timeline
- 2026-05-01 Pending — Stellar MLS as Distributed by MLS Grid
- 2026-04-22 Price Changed $369,990 Stellar MLS as Distributed by MLS Grid
- 2026-04-15 Price Changed $374,990 Stellar MLS as Distributed by MLS Grid
- 2026-03-26 Price Changed $379,990 Stellar MLS as Distributed by MLS Grid
- 2026-03-10 Price Changed $384,990 Stellar MLS as Distributed by MLS Grid
- 2026-03-04 Price Changed $390,990 Stellar MLS as Distributed by MLS Grid
- 2026-03-03 Listed $389,990 Stellar MLS as Distributed by MLS Grid
Cash-flow waterfall
monthlySold comps — $/sqft
last 12 mo · ≤1 miLoading sold comps…