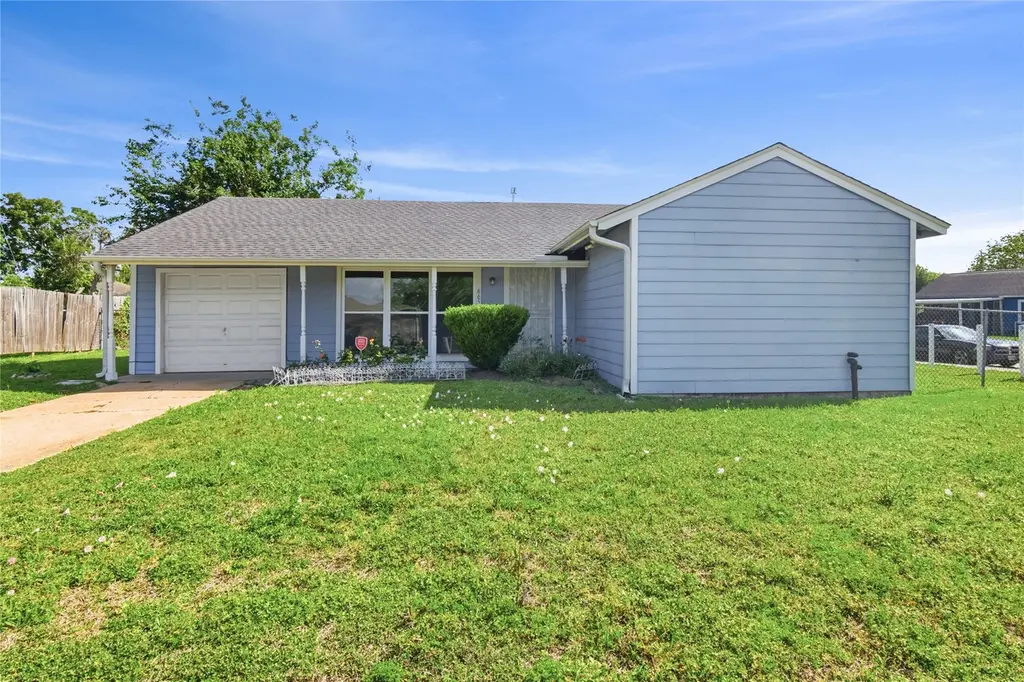
6651 Crestmont St · Houston, TX
Flood risk 6/10 · Moderate
- FEMA flood zone
- X (unshaded)
- Chance of flooding over 30 yrs
- 0.71%
- Est. flood insurance / yr
- $507 – $1,088
Fire risk 1/10 · Minimal
- Est. fire insurance / yr
- $1,222 – $2,270
Heat risk 9/10 · Severe
- Hot days now (above 109°F)
- 7 days/yr
- Hot days in 30 yrs
- 24 days/yr
Wind risk 9/10 · Severe
- Chance of severe wind over 30 yrs
- 99.0%
Air-quality risk 2/10 · Minimal
- Unhealthy air days now
- 2 days/yr
- Unhealthy air days in 30 yrs
- 2 days/yr
Risk factors via First Street. Map © Google.
Why this score? — see what drove the D grade
The composite is a weighted blend of 9 inputs, each scored 0–100. Each bar is that input's sub-score; the figure is the points it added to the 100-point composite (weight × sub-score).
- Cash flow +18.7/30.0
- DSCR +5.9/10.0
- 1% rule +4.6/10.0
- Rent growth +3.9/5.0
- Livability +3.7/5.0
- Schools +2.7/10.0
- Condition / age +2.5/5.0
- ARV discount +0.0/15.0
- Appreciation +0.0/10.0
$187,000
🖨 Deal sheet (PDF) 📄 Offer letter ✓ Due diligence
Listing remarks MLS
Immaculate Home with all new windows!!!Location is crucial in Real Estate, and this property is conveniently close to Houston's top spots like stadiums, colleges, restaurants and historical sites. Near the 610 freeway, public transportation is easily accessible. Situated on a corner lot with a spacious backyard, this home boasts all new windows and three bedrooms, with an extra room that can be utilized as an in-law suite or game room. Don't miss out on the chance to make this your new home - schedule a viewing today!
Key facts
- All new windows
- Spacious backyard
- Extra room
Tags
Neighborhood map
What this means for you Summary
Snapshot
- This is a 3-bed/2.0-bath single-family listed at $187k.
Deal economics
- At list price, monthly cash flow is $186 ($2k/yr) — positive.
- The deal already cash-flows at list — no discount required.
- To meet the 1% rule (rent ≥ 1% of price), the offer needs to be $179k (4.0% below list).
- Recommended offer: $176k (6.0% below list) — sets the bar for market timing.
- Cap rate 7.5% vs local median 3.2% in Houston — top-decile yield for the area; either an underpriced asset or a hidden risk that comps aren't pricing in. Stress-test before assuming the spread holds.
Location & tenants
- Location reads 74/100 on livability (#184 in TX, #4,771 nationally) — a middle-class / working-renter tenant base. Strengths: amenities A+, cost of living A+, housing A+; Watch: crime F.
- Houston ISD (urban): math 27% / reading 35% proficiency, ranked #593 of 826 in TX (top 72%) — families likely to look elsewhere, expect single-tenant / working-renter base with shorter leases; 71% free/reduced lunch — lower-income household profile, screen leases tightly.
- Zoned schools: Kelso El (math 12% / reading 27%, grade F, #3,583 of 4,322 statewide, top 86%, 397 students, 99% FRL); Attucks Middle (math 15% / reading 22%, grade F, #1,478 of 1,662 statewide, top 90%, 439 students, 98% FRL); Sterling H S (math 16% / reading 27%, grade F, #1,377 of 1,632 statewide, top 85%, 1,421 students, 92% FRL) — zoned schools average 96% FRL vs 71% district-wide (25 pts higher); higher-poverty schools than district average — tighter screening recommended.
- Market conditions: Rents rising fast (+5.5%/yr); 347 active listings in the ZIP; 39 comparable units currently listed for rent nearby; rentals at typical pace (median 17d on market — plan ~3-4 weeks tenant-placement turnaround); lower-income renter base — watch delinquency; 29,883 units permitted in Harris County in 2024 (8,621 in 5+ unit buildings).
- At $1,795/mo this rent would consume 57% of the median local household income ($38k/yr) (locally 1728% of renters already pay >50% of income on rent) — very limited rent-growth headroom before tenants either downsize or default.
Forward outlook
- Local home prices are declining (-3.0%/yr); year-one equity from $1k of loan paydown is wiped out by about $6k of value loss. Plan a longer hold.
- Harris County population projected at +47% by 2050 — long-run rental-demand tailwind backs the buy-and-hold thesis.
Negotiation context
- It's been on market 74 days — a 6% lower offer ($176k) is reasonable based on typical stale-listing flexibility.
Risks & watch-outs
- Watch-outs: built in 1950 — expect roof / HVAC / electrical / plumbing capex.
- Climate carrying-cost: major flood risk; severe wind risk, 99% chance of damaging wind over 30y; extreme-heat days projected 7→24/yr by 2055 (HVAC capex compounding) — expect insurance premiums to compound above CPI over the hold.
Questions for the listing agent
- It's been on market 74 days. Have you received any prior offers? Is the seller open to a 6% concession, seller financing, or rate buy-down credit?
- Built in 1950 — when were the roof, HVAC, electrical panel, plumbing, and water heater last replaced?
- Why hasn't it sold? Are there any deal-killer items the seller is aware of (foundation, flood, title, zoning, code violations)?
- Is there a deadline driving the sale (1031 exchange, divorce, estate, relocation)? That informs how much negotiation room exists.
- Schools are D-rated, which usually means shorter tenancies and higher turnover. Who's the typical renter profile here, and what's been the actual vacancy rate?
- Crime grade is F in this area — have there been break-ins, vandalism, or insurance claims at this property in the last 3 years? What carrier currently insures it and at what premium?
- The area grade is low — what's the realistic commute time and amenity access for the typical tenant pool here? Any planned neighborhood developments (good or bad) we should know about?
- What's the average days-on-market for RENTAL listings here right now (not sales)? A rising rental-DOM trend means longer vacancies and softer asking-rent achievability than the comps imply.
- What's the recent tenant-quality profile in this submarket — average credit score on applications, eviction rate, late-payment / NSF rate, and stable-employment percentage? A property-management company in the area should have these aggregated.
- How much new for-sale + rental construction is in the pipeline within 1–3 miles? Heavy new supply typically softens prices + rents 12–24 months out; constrained supply supports both.
Investment metrics
- 1% rule
- 0.96% ✗
- Cap rate
- 7.49%
- Cash-on-cash
- 4.27%
- DSCR
- 1.19
- GRM
- 8.7
CMA / ARV
- ARV (median comp)
- $155,518
- List price
- $187,000
- Delta
- 20.24%
- Verdict
- OVERPRICED
- Comps
- 20 within 1.0 mi
Show comp detail 12 sales within ~0.75 mi
| Address | Dist | Beds/Ba | Sqft | Sold | Price | $/sf | Match |
|---|---|---|---|---|---|---|---|
| 5911 Southurst St | 0.11mi | 4/2.0 (+1) | 1,444 (-4%) | 10mo | $220,000 | $152 | 75 |
| 5978 Southmont St | 0.24mi | 4/2.5 (+1) | 1,520 (+1%) | 9mo | $240,000 | $158 | 72 |
| 5938 Southlark St | 0.11mi | 3/2.5 | 1,329 (-12%) | 1mo | $195,000 | $147 | 72 |
| 6718 Crestridge St | 0.39mi | 3/1.0 | 1,464 (-3%) | 5mo | $194,900 | $133 | 69 |
| 5915 Southtown St | 0.42mi | 4/1.0 (+1) | 1,472 (-2%) | 4mo | $115,000 | $78 | 64 |
| 6650 Crestridge St | 0.32mi | 4/2.0 (+1) | 1,624 (+8%) | 10mo | $175,000 | $108 | 59 |
| 5823 Southgood St | 0.41mi | 3/2.0 | 1,300 (-14%) | 1mo | $217,900 | $168 | 57 |
| 5815 Pershing St | 0.63mi | 3/1.0 | 1,518 (+1%) | 10mo | $80,000 | $53 | 57 |
| 6116 Beekman Rd | 0.63mi | 3/2.0 | 1,566 (+4%) | 9mo | $305,000 | $195 | 56 |
| 6511 Beekman Rd | 0.64mi | 4/2.0 (+1) | 1,480 (-2%) | 10mo | $165,000 | $111 | 54 |
| 6802 Crestridge St | 0.44mi | 4/2.0 (+1) | 1,351 (-10%) | 11mo | $167,500 | $124 | 49 |
| 5259 Perry St | 0.68mi | 4/2.0 (+1) | 1,400 (-7%) | 7mo | $190,000 | $136 | 46 |
Match score weights: distance 35% · size 25% · config 20% · recency 20%. Top-matched comps best support the ARV.
Projected returns pro-forma
-3.0% appreciation · 5.45% rent growth · sell at horizon
- IRR
- -7.0%
- Equity multiple
- 0.73×
- Total profit
- $-13,919
- Equity at exit
- $27,882
- IRR
- 5.3%
- Equity multiple
- 1.43×
- Total profit
- $22,665
- Equity at exit
- $16,168
Cash invested: $52,360 (down + closing). Projections, not guarantees.
Landlord ↔ Tenant lean methodology
- Overall (STATE)
- 87 Strongly Landlord-Friendly
- State Texas
- 87 Strongly Landlord-Friendly · R+5
- County
- — inherits STATE
- City
- — inherits STATE
ZIP-level market 77033
- Home prices YoY
- -16.3%
- Rents YoY
- 5.5%
- Active inventory
- 347
- Price-to-rent
- 8.7×
Monthly cashflow live
- Estimated rent
- $1,795 high interval (Pro) →
- Mortgage (P&I)
- −$981
- Tax from tax record
- −$173 /mo · $2,075/yr
- Insurance
- −$78
- HOA
- −$0
- Lot rent
- −$0
- Vacancy / Maint / Mgmt
- −$377
- Net cashflow
- $186
Break-even live
Sensitivity live
| Price | -10% $292 | -5% $239 | +0% $186 | +5% $133 | +10% $80 |
|---|---|---|---|---|---|
| Rent | -10% $44 | -5% $115 | +0% $186 | +5% $257 | +10% $328 |
| Rate | -1.0pp $280 | -0.5pp $234 | base $186 | +0.5pp $138 | +1.0pp $88 |
UW: 25.0% down · 7.5% · 30yr · 1.5% tax · 5.0% vac · 8.0% maint · 8.0% mgmt
Financing live
Cash to close
- Down payment
- $46,750
- Closing costs
- $5,610
- Reserves months
- —
- Total cash needed
- —
Loan-product check · same deal, 3 products live
Conventional
25% down · 7.5% · 30yr
- Down + closing
- —
- Monthly P&I
- —
- Monthly cashflow
- —
- DSCR
- —
- Eligible?
- —
Personal DTI + credit; lowest rate.
DSCR
20% down · 8.5% · 30yr
- Down + closing
- —
- Monthly P&I
- —
- Monthly cashflow
- —
- DSCR
- —
- Eligible?
- —
No personal income docs; deal must DSCR.
Hard money
10% down · 12.0% · 12mo
- Down + closing
- —
- Monthly P&I
- —
- Monthly cashflow
- —
- DSCR
- —
- Eligible?
- —
Short-term bridge; refi at stabilization.
Rent comps 39 comps
| Address | Beds | Baths | Sqft | Rent | $/sqft | DOM | Units | Dist |
|---|---|---|---|---|---|---|---|---|
| 5835 Southmont St Houston, TX | 3.0 | 2.0 | 1200 | $1,700 | $1.42 | 46d | 1 | 0.23mi |
| 6850 Southbank St Unit A Houston, TX | 3.0 | 3.0 | 2000 | $2,200 | $1.10 | 6d | 1 | 0.44mi |
| 6850 Southbank St Unit A Houston, TX | 3.0 | 3.0 | 2000 | $2,200 | $1.10 | 7d | 1 | 0.44mi |
| 5954 Doolittle Blvd Houston, TX | 3.0 | 2.0 | 1371 | $1,575 | $1.15 | 46d | 1 | 0.48mi |
| 5317 Chennault Rd Unit A Houston, TX | 3.0 | 2.5 | 1608 | $1,849 | $1.15 | 1d | 1 | 0.60mi |
| 5514 Griggs Rd Unit 422 Houston, TX | 2.0 | 2.0 | 1322 | $1,190 | $0.90 | 10d | 1 | 0.69mi |
| 5514 Griggs Rd Unit 2162 Houston, TX | 2.0 | 2.0 | 1322 | $1,190 | $0.90 | 7d | 1 | 0.69mi |
| 5514 Griggs Rd Unit 5571 Houston, TX | 2.0 | 2.0 | 1322 | $1,214 | $0.92 | 13d | 1 | 0.69mi |
| 5514 Griggs Rd Unit 2187 Houston, TX | 2.0 | 2.0 | 1322 | $1,225 | $0.93 | 0d | 1 | 0.69mi |
| 5514 Griggs Rd Unit 2165 Houston, TX | 2.0 | 2.0 | 1322 | $1,215 | $0.92 | 1d | 1 | 0.69mi |
| 5514 Griggs Rd Houston, TX | 2.0 | 2.0 | 1322 | $1,210 | $0.92 | 46d | 1 | 0.71mi |
| 5514 Griggs Rd Unit 2047 Houston, TX | 2.0 | 2.0 | 1322 | $1,225 | $0.93 | 13d | 1 | 0.77mi |
| 5514 Griggs Rd Unit 2047 Houston, TX | 2.0 | 2.0 | 1322 | $1,214 | $0.92 | 5d | 1 | 0.77mi |
| 5520 Griggs Rd Houston, TX | 2.0 | 2.0 | 1322 | $1,241 | $0.94 | 46d | 1 | 0.78mi |
| 5520 Griggs Rd Houston, TX | 2.0 | 2.0 | 1322 | $1,241 | $0.94 | 24d | 1 | 0.78mi |
| 5123 Dewberry St Houston, TX | 4.0 | 2.0 | 1391 | $2,400 | $1.73 | 46d | 1 | 0.91mi |
| 5818 Glenhurst Dr Houston, TX | 3.0 | 2.0 | 1441 | $1,790 | $1.24 | 0d | 1 | 0.94mi |
| 5818 Glenhurst Dr Houston, TX | 3.0 | 2.0 | 1441 | $1,750 | $1.21 | 1d | 1 | 0.94mi |
| 4942 Bataan Rd Unit 77033 Houston, TX | 4.0 | 2.0 | 1350 | $1,800 | $1.33 | 46d | 1 | 1.01mi |
| 5154 Griggs Rd Unit CAVE Houston, TX | 2.0 | 2.0 | 1322 | $1,420 | $1.07 | 5d | 1 | 1.06mi |
| 5314 Longmeadow St Houston, TX | 3.0 | 3.0 | 1646 | $1,900 | $1.15 | 46d | 1 | 1.06mi |
| 5942 Ridgeway Dr Houston, TX | 4.0 | 2.0 | 1490 | $2,250 | $1.51 | 46d | 1 | 1.07mi |
| 5116 Griggs Rd Houston, TX | 3.0 | 2.0 | 1131 | $1,316 | $1.16 | 46d | 1 | 1.07mi |
| 6528 Weston St Unit A Houston, TX | 3.0 | 3.0 | 1484 | $2,200 | $1.48 | 46d | 1 | 1.16mi |
| 6528 Weston St Unit A Houston, TX | 3.0 | 3.0 | 1484 | $2,200 | $1.48 | 1d | 1 | 1.16mi |
| 6532 Weston St Unit A Houston, TX | 3.0 | 3.0 | 1484 | $2,200 | $1.48 | 20d | 1 | 1.17mi |
| 7358 Guadalcanal Rd Houston, TX | 3.0 | 3.0 | 1768 | $2,195 | $1.24 | 46d | 1 | 1.19mi |
| 6109 Wayland St Houston, TX | 4.0 | 2.0 | 1600 | $1,595 | $1.00 | 1d | 1 | 1.25mi |
| 3810 Weslow St Unit A Houston, TX | 3.0 | 2.0 | 1517 | $1,399 | $0.92 | 4d | 1 | 1.28mi |
| 4705 Idaho St Houston, TX | 3.0 | 2.5 | 1664 | $2,500 | $1.50 | 19d | 1 | 1.33mi |
| 7710 Darnay Dr Houston, TX | 3.0 | 3.0 | 1635 | $2,095 | $1.28 | 46d | 1 | 1.33mi |
| 5767 Belcrest St Houston, TX | 4.0 | 2.0 | 1480 | $1,790 | $1.21 | 46d | 1 | 1.34mi |
| 5222 Northridge Dr Houston, TX | 4.0 | 2.0 | 1300 | $1,850 | $1.42 | 26d | 1 | 1.35mi |
| 5623 Bellfort St Houston, TX | 4.0 | 1.0 | 1320 | $1,700 | $1.29 | 17d | 1 | 1.35mi |
| 6731 New York St Houston, TX | 3.0 | 3.0 | 2211 | $2,100 | $0.95 | 46d | 1 | 1.41mi |
| 6926 Paris St Houston, TX | 3.0 | 2.0 | 1276 | $1,900 | $1.49 | 1d | 1 | 1.41mi |
| 6928 Paris St Houston, TX | 3.0 | 2.0 | 1276 | $1,900 | $1.49 | 1d | 1 | 1.42mi |
| 5101 Martin Luther King Blvd Unit MO54 Houston, TX | 2.0 | 2.0 | 1322 | $1,210 | $0.92 | 14d | 1 | 1.48mi |
| 4907 Culmore Dr Houston, TX | 4.0 | 2.0 | 1800 | $2,700 | $1.50 | 19d | 1 | 1.49mi |
Listing history 18 events
-
2026-06-22days on market $187,000 Active 74 DOM
-
2026-06-21days on market $187,000 Active 73 DOM
-
2026-06-18days on market $187,000 Active 70 DOM
-
2026-06-17days on market $187,000 Active 69 DOM
-
2026-06-16days on market $187,000 Active 68 DOM
-
2026-06-15days on market $187,000 Active 67 DOM
-
2026-06-13days on market $187,000 Active 65 DOM
-
2026-06-10days on market $187,000 Active 61 DOM
-
2026-06-08days on market $187,000 Active 60 DOM
-
2026-06-07days on market $187,000 Active 59 DOM
-
2026-06-04days on market $187,000 Active 56 DOM
-
2026-06-02price $187,000 Active 53 DOM
-
2026-06-01days on market $195,000 Active 53 DOM
-
2026-05-31days on market $195,000 Active 52 DOM
-
2026-05-12price $195,000 523-char remark
Show marketing remark (523 chars)
Immaculate Home with all new windows!!!Location is crucial in Real Estate, and this property is conveniently close to Houston's top spots like stadiums, colleges, restaurants and historical sites. Near the 610 freeway, public transportation is easily accessible. Situated on a corner lot with a spacious backyard, this home boasts all new windows and three bedrooms, with an extra room that can be utilized as an in-law suite or game room. Don't miss out on the chance to make this your new home - schedule a viewing today!
-
2026-04-20price $199,900 523-char remark
Show marketing remark (523 chars)
Immaculate Home with all new windows!!!Location is crucial in Real Estate, and this property is conveniently close to Houston's top spots like stadiums, colleges, restaurants and historical sites. Near the 610 freeway, public transportation is easily accessible. Situated on a corner lot with a spacious backyard, this home boasts all new windows and three bedrooms, with an extra room that can be utilized as an in-law suite or game room. Don't miss out on the chance to make this your new home - schedule a viewing today!
-
2026-04-09$210,000 Active 523-char remark
Show marketing remark (523 chars)
Immaculate Home with all new windows!!!Location is crucial in Real Estate, and this property is conveniently close to Houston's top spots like stadiums, colleges, restaurants and historical sites. Near the 610 freeway, public transportation is easily accessible. Situated on a corner lot with a spacious backyard, this home boasts all new windows and three bedrooms, with an extra room that can be utilized as an in-law suite or game room. Don't miss out on the chance to make this your new home - schedule a viewing today!
-
1988-01-02soldstatus
ⓘ Source: listings_history table (triggers on properties + properties_extension) + one-shot
backfill from property_details.listing_events for pre-trigger history.
Tax reassessment forecast TX · Resets to sale price
- Current annual tax
- $2,075 · $173/mo
- Projected year-2 tax
- $3,422 · $285/mo
- Expected delta
- +$1,347/yr (+$112/mo · 65.0%)
ⓘ Screening estimate from a state-policy table — verify with the county assessor before closing.
Climate risk First Street
- Flood 6/10 Major FEMA zone X (unshaded) · 71% chance over 30 yrs
- Wildfire 1/10 Low
- Heat 9/10 Extreme 7 d/yr ≥109°F today · 24 d/yr by 30 yrs out
- Wind 9/10 Extreme 99% chance of damaging wind over 30 yrs
- Air quality 2/10 Low 2 unhealthy d/yr today · 2 by 30 yrs out
Nearby sold comps map
Loading sold comps map…
Walkable amenities ~0.75 mi
Loading nearby amenities…
Taxation est. · year 1
- Rental income
- $21,534
- − Mortgage interest
- −$10,475
- − Property taxes
- −$2,075
- − Insurance
- −$935
- − Repairs & maintenance
- −$1,723
- − Management
- −$1,723
- − Depreciation
- −$5,440
- Taxable loss
- −$836
- Est. tax savings @ 24.0%
- +$201
- After-tax cash flow
- $2,435/yr
For passive investors: Depreciation is non-cash, so a rental often shows a tax loss while cash-flowing — sheltering income. Rental losses are passive: they offset passive income freely, and up to $25,000/yr can offset ordinary (W-2) income if you actively participate and your MAGI is under $100k (phasing out to $0 by $150k); unused losses carry forward. On sale, claimed depreciation is recaptured at up to 25%, and gains may owe capital-gains tax (a 1031 exchange can defer both). Figures are a year-1 estimate at your 24.0% rate — not tax advice; consult a CPA.
Schools (NCES district)
- District
- Houston ISD
- NCES district ID
- 4823640
- Math proficiency
- 27% ▼ -18.00%
- Reading proficiency
- 35% ▼ -6.00%
- Median HH income
- $46,054
- Composite
- 26.63/100
- National rank
- #7173
- State rank
- #593 of 826 in TX
Livability — Houston
- Score
- 74/100
- State rank
- #184
- US rank
- #4771
Category grades
Schools grade is shown separately in the Schools card above.
Census & demographics
- Census place
- Houston, TX
- County
- Harris County · 4,702,590 people
- City population
- 3,226,434
- Metro
- Houston-The Woodlands-Sugar Land, TX
- Population (ZIP)
- 29,154
- Household income
- $38,071
- Rent vs Own
- Severe rent burden
- 1728.0
Population outlook (Harris County) Hauer SSP2
- Today (2025)
- 5,571,493 people
- By 2030
- 6,089,821 · +9.3%
- By 2040
- 7,142,806 · +28.2%
- By 2050
- 8,185,864 · +46.9%
- By 2075
- 10,574,329 · +89.8%
- By 2100
- 12,109,958 · +117.4%
Race, ethnicity, and origin ACS 2023
- Neighborhood character
- Majority Black (55%)
- Race & ethnicity
- Black 55% Hispanic / Latino 43% Two or more races 17% Native American 1%
- Hispanic origin (detail)
- Mexican 35%
- Common ancestry
- Lithuanian 1%
- Foreign-born
- 18% · Canada
- Languages at home
- 61% English-only · Spanish 39%
Political lean MEDSL · Harris
- 2024 margin
- Lean D (+5.5) · D 52.0% · R 46.4% · Other 1.6%
- 2008→2024 swing
- +3.9pp toward D · 2008: 1.6pp · 2024: 5.5pp
- All cycles
- 2024: D+5.5 2020: D+13.3 2016: D+12.4 2012: D+0.1 2008: D+1.6
Not yet ingested
- Civics
- —
Market trends
- HPI YoY
- ▼ -41.49%
- Current HPI
- 212.6472
- Rent YoY
- ▲ 5.45%
- Metro
- Houston-The Woodlands-Sugar Land, TX
- State GDP YoY
- ▲ 3.95%
- F500 in state
- 110
Industry mix (Fortune 500 HQ in TX)
| Industry | F500 HQs | Revenue |
|---|---|---|
| Energy | 16 | $1,198B |
|
||
| Technology | 5 | $198B |
|
||
| Engineering / Construction | 4 | $72B |
|
||
| Energy Services | 3 | $60B |
|
||
| Utilities | 3 | $41B |
|
||
| Healthcare | 2 | $330B |
|
||
Price history
-7.1% since first listed4 events — show timeline
- 2026-05-12 Price Changed $195,000 HARMLS
- 2026-04-20 Price Changed $199,900 HARMLS
- 2026-04-09 Listed $210,000 HARMLS
- 1988-01-02 Sold (Public Records) — Public Records
Property tax history
+1.5%/yrLatest (2025): $2,075 · +11.7% YoY. Source: county tax records.
Cash-flow waterfall
monthlySold comps — $/sqft
last 12 mo · ≤1 miLoading sold comps…