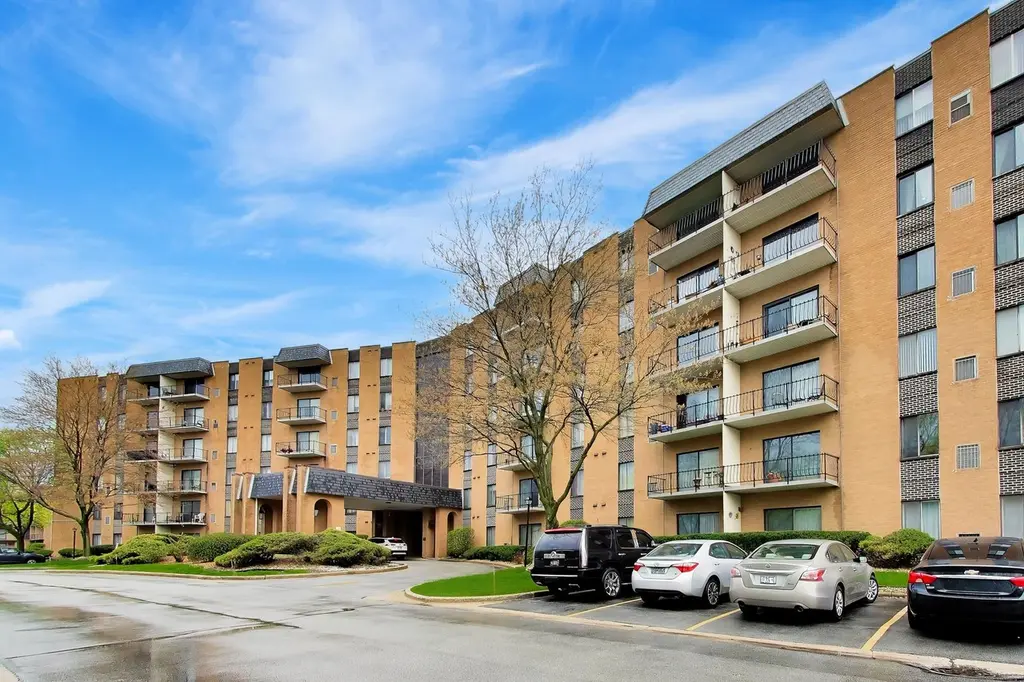
700 N Bruce Ln #312 · Glenwood, IL
Flood risk 1/10 · Minimal
- FEMA flood zone
- X (unshaded)
- Chance of flooding over 30 yrs
- 0.0%
- Est. flood insurance / yr
- $507 – $1,088
Fire risk 3/10 · Minor
- Est. fire insurance / yr
- $804 – $1,492
Heat risk 3/10 · Minor
- Hot days now (above 101°F)
- 7 days/yr
- Hot days in 30 yrs
- 15 days/yr
Wind risk 2/10 · Minimal
- Chance of severe wind over 30 yrs
- —
Air-quality risk 4/10 · Minor
- Unhealthy air days now
- 4 days/yr
- Unhealthy air days in 30 yrs
- 5 days/yr
Risk factors via First Street. Map © Google.
Why this score? — see what drove the C+ grade
The composite is a weighted blend of 9 inputs, each scored 0–100. Each bar is that input's sub-score; the figure is the points it added to the 100-point composite (weight × sub-score).
- Cash flow +25.4/30.0
- 1% rule +9.9/10.0
- DSCR +8.4/10.0
- ARV discount +7.5/15.0
- Livability +3.3/5.0
- Rent growth +2.5/5.0
- Condition / age +2.5/5.0
- Schools +2.4/10.0
- Appreciation +0.0/10.0
$137,500
🖨 Deal sheet (PDF) 📄 Offer letter ✓ Due diligence
Listing remarks
DON'T MISS THIS MOVE-IN READY 2-BEDROOM, 2-BATH CONDO OFFERING THE PERFECT BLEND OF COMFORT, STYLE, AND CONVENIENCE. THIS WELL-MAINTAINED UNIT FEATURES AN UPDATED KITCHEN WITH STAINLESS STEEL APPLIANCES, UPDATED BATHROOMS, AND A SPACIOUS PRIMARY SUITE COMPLETE WITH A WALK-IN CLOSET. FRESH PAINT & NEWER CARPET THROUGHOUT ADDS A CLEAN, MODERN FEEL. ENJOY YOUR OWN PRIVATE BALCONY ALONG WITH THE CONVENIENCE OF LAUNDRY LOCATED ON THE SAME FLOOR. RESIDENTS HAVE ACCESS TO A FULL RANGE OF AMENITIES INCLUDING ASSIGNED PARKING, A FITNESS CENTER, POOL, CLUBHOUSE, TENNIS COURTS, AND ADDITIONAL STORAGE. IDEALLY LOCATED NEAR SHOPPING, DINING, AND EASY ACCESS TO I-80, ALL WITHIN A HIGHLY SOUGHT-AFTE
Key facts
- $385 HOA
- 2 parking spots
- Community pool
Property features AI
Finance
- Other: 96 units in the building; Commuter-friendly location with bus, train, and interstate access
- HOA & community: Monthly association fee of $385; Association covers water, insurance, exercise facilities, exterior maintenance, lawn care, scavenger, and snow removal; Building amenities include coin laundry, exercise room, storage, on-site manager/engineer, pool, receiving room, clubhouse, laundry facilities, and elevators; On-site manager available Monday through Friday; No pets allowed
Exterior
- Parking: Two parking spaces (unassigned / other)
- Utilities: Water from Lake Michigan / public water; Public sewer
- Home design: Attached single-unit condo; Entry level: 3rd floor; Non-smoking building; Disability access available; Rehab completed in 2025
- Construction: Brick and conventional construction; Building age approximately 51–60 years; Built before 1978; Cellar basement
- Exterior features: Balcony; In-ground pool; Common lot / shared grounds
Interior
- Kitchen: Granite counters; Pantry closet; Eating area with breakfast bar and table space; Range, Gas cooktop, Gas oven, Cooktop; Microwave; Dishwasher; Refrigerator; Stainless steel appliances
- Bedrooms: Master bedroom on main level with full bath and blinds; Second bedroom on main level (13 x 11) with blinds
- Flooring: Carpet in primary rooms; Wood laminate in walk-in closet
- Bathrooms: Two full bathrooms; Separate shower, double sink, soaking tub
- Heating & cooling: Natural gas heating; Central air conditioning; Intercom system
- Interior features: Walk-in closet(s); Dining area combined with living room; Drapes / curtains
- Laundry & utility: Common area laundry; Laundry room
Neighborhood map
What this means for you Summary
Snapshot
- This is a 2-bed/2.0-bath condo listed at $138k.
Deal economics
- At list price, monthly cash flow is $315 ($4k/yr) — positive.
- The deal already cash-flows at list — no discount required.
- Meets the 1% rule at list price ($2k rent vs $138k).
- Recommended offer: $129k (6.0% below list) — sets the bar for market timing.
Location & tenants
- Location reads 66/100 on livability (#545 in IL) — a middle-class / working-renter tenant base. Strengths: cost of living A+, housing A+, employment B; Watch: health & safety D+, amenities F, commute F.
- Homewood Flossmoor Chsd 233 (suburban): math 21% / reading 27% proficiency, ranked #272 of 620 in IL (top 44%) — low school quality limits family demand, transient renter base, plan for 1-2y turnover.
- Zoned schools: Longwood Elem School (math 2% / reading 8%, grade F, #1,741 of 2,056 statewide, top 93%, 330 students, 0% FRL); Brookwood Jr High School (math 5% / reading 20%, grade F, #545 of 665 statewide, top 83%, 241 students, 0% FRL); Homewood-Flossmoor High School (math 21% / reading 27%, grade F, #304 of 693 statewide, top 44%, 2,798 students, 0% FRL).
- Market conditions: 53 active listings in the ZIP; 2 comparable units currently listed for rent nearby; 6,272 units permitted in Cook County in 2024 (4,658 in 5+ unit buildings).
Forward outlook
- Local home prices are declining (-3.0%/yr); year-one equity from $951 of loan paydown is wiped out by about $4k of value loss. Plan a longer hold.
Negotiation context
- It's been on market 68 days — a 6% lower offer ($129k) is reasonable based on typical stale-listing flexibility.
- 9 sale attempts since 17y ago; this cycle's ask is 48% above the opening price — seller raised mid-cycle; expect resistance to lowballs.
- Current owner paid $80k; list at $138k implies a 72% gain — meaningful room to come down on a strong offer.
Questions for the listing agent
- It's been on market 68 days. Have you received any prior offers? Is the seller open to a 6% concession, seller financing, or rate buy-down credit?
- Built in 1971 — when were the roof, HVAC, electrical panel, plumbing, and water heater last replaced?
- What does the HOA fee cover, when was the last increase, and are there any pending special assessments or reserve-fund shortfalls?
- Any open or pending special assessments — roof, HVAC, plumbing, elevator, façade? What's the per-unit balance and payoff schedule, and is the seller paying it off at close or rolling it to the buyer?
- Why hasn't it sold? Are there any deal-killer items the seller is aware of (foundation, flood, title, zoning, code violations)?
- Is there a deadline driving the sale (1031 exchange, divorce, estate, relocation)? That informs how much negotiation room exists.
- Schools are F-rated, which usually means shorter tenancies and higher turnover. Who's the typical renter profile here, and what's been the actual vacancy rate?
- What's the average days-on-market for RENTAL listings here right now (not sales)? A rising rental-DOM trend means longer vacancies and softer asking-rent achievability than the comps imply.
- What's the recent tenant-quality profile in this submarket — average credit score on applications, eviction rate, late-payment / NSF rate, and stable-employment percentage? A property-management company in the area should have these aggregated.
- How much new apartment / multifamily construction is in the pipeline within 1–3 miles? Heavy new supply (>2% of stock underway) typically softens rents 12–24 months out; light construction supports rent growth.
Investment metrics
- 1% rule
- 1.49% ✓
- Cap rate
- 9.04%
- Cash-on-cash
- 9.82%
- DSCR
- 1.44
- GRM
- 5.6
CMA / ARV
No comps found within radius.
Projected returns pro-forma
-3.0% appreciation · 3.0% rent growth · sell at horizon
- IRR
- -1.3%
- Equity multiple
- 0.95×
- Total profit
- $-1,966
- Equity at exit
- $20,502
- IRR
- 8.5%
- Equity multiple
- 1.65×
- Total profit
- $25,139
- Equity at exit
- $11,888
Cash invested: $38,500 (down + closing). Projections, not guarantees.
Landlord ↔ Tenant lean methodology
- Overall (STATE)
- 43 Moderately Tenant-Leaning
- State Illinois
- 43 Moderately Tenant-Leaning · D+7
- County
- — inherits STATE
- City
- — inherits STATE
ZIP-level market 60425
- Home prices YoY
- -10.6%
- Active inventory
- 53
- Price-to-rent
- 5.6×
Monthly cashflow live
- Estimated rent
- $2,052 medium interval (Pro) →
- Mortgage (P&I)
- −$721
- Tax from tax record
- −$143 /mo · $1,710/yr
- Insurance
- −$57
- HOA
- −$385
- Lot rent
- −$0
- Vacancy / Maint / Mgmt
- −$431
- Net cashflow
- $315
Break-even live
Sensitivity live
| Price | -10% $393 | -5% $354 | +0% $315 | +5% $276 | +10% $237 |
|---|---|---|---|---|---|
| Rent | -10% $153 | -5% $234 | +0% $315 | +5% $396 | +10% $477 |
| Rate | -1.0pp $384 | -0.5pp $350 | base $315 | +0.5pp $279 | +1.0pp $243 |
UW: 25.0% down · 7.5% · 30yr · 1.5% tax · 5.0% vac · 8.0% maint · 8.0% mgmt
Financing live
Cash to close
- Down payment
- $34,375
- Closing costs
- $4,125
- Reserves months
- —
- Total cash needed
- —
Loan-product check · same deal, 3 products live
Conventional
25% down · 7.5% · 30yr
- Down + closing
- —
- Monthly P&I
- —
- Monthly cashflow
- —
- DSCR
- —
- Eligible?
- —
Personal DTI + credit; lowest rate.
DSCR
20% down · 8.5% · 30yr
- Down + closing
- —
- Monthly P&I
- —
- Monthly cashflow
- —
- DSCR
- —
- Eligible?
- —
No personal income docs; deal must DSCR.
Hard money
10% down · 12.0% · 12mo
- Down + closing
- —
- Monthly P&I
- —
- Monthly cashflow
- —
- DSCR
- —
- Eligible?
- —
Short-term bridge; refi at stabilization.
Rent comps 2 comps
| Address | Beds | Baths | Sqft | Rent | $/sqft | DOM | Units | Dist |
|---|---|---|---|---|---|---|---|---|
| 44 N Glenwood Ave Glenwood, IL | 1.0 | 1.0 | 700 | $1,900 | $2.71 | 0d | 1 | 1.16mi |
| 208 Blackstone St Thornton, IL | 2.0 | 1.5 | 923 | $2,200 | $2.38 | 3d | 1 | 1.49mi |
HOA detail condo
- Monthly dues
- $385 · $4,620/yr
- Likely covers
- poolgymparking
- Assessments
- None detected in remarks — confirm with the listing agent.
Listing history 42 events
-
2026-06-22days on market $137,500 Active 68 DOM
-
2026-06-21days on market $137,500 Active 67 DOM
-
2026-06-18days on market $137,500 Active 64 DOM
-
2026-06-17days on market $137,500 Active 63 DOM
-
2026-06-16days on market $137,500 Active 62 DOM
-
2026-06-15days on market $137,500 Active 61 DOM
-
2026-06-13days on market $137,500 Active 59 DOM
-
2026-06-09days on market $137,500 Active 55 DOM
-
2026-06-08days on market $137,500 Active 54 DOM
-
2026-06-07days on market $137,500 Active 53 DOM
-
2026-06-04days on market $137,500 Active 50 DOM
-
2026-06-03days on market $137,500 Active 49 DOM
-
2026-06-02days on market $137,500 Active 48 DOM
-
2026-06-01days on market $137,500 Active 47 DOM
-
2026-05-31days on market $137,500 Active 46 DOM
-
2026-05-15price $137,500
-
2026-05-08price $137,000
-
2026-05-05price $144,999
-
2026-04-04historical
-
2026-03-21price
-
2026-03-13Active
-
2026-03-12historical
-
2026-02-05status Active
-
2025-12-02historical Contingent - Continue to Show
-
2025-10-30price
-
2025-10-08Active
-
2025-10-03historical
-
2025-09-21status Active
-
2025-09-19historical
-
2025-09-13status Active
-
2025-09-13historical
-
2025-08-22status Active
-
2025-06-03historical Contingent - Continue to Show
-
2025-05-21status Active
-
2025-04-26historical Contingent - Continue to Show
-
2025-04-10Active
-
2009-07-30soldstatus $80,000
-
2009-07-09soldstatus $79,900 Closed Sale
-
2009-05-01historical
-
2009-04-20price $79,900
-
2009-03-05$92,900
-
1998-06-26soldstatus $75,000
ⓘ Source: listings_history table (triggers on properties + properties_extension) + one-shot
backfill from property_details.listing_events for pre-trigger history.
Tax reassessment forecast IL · Partial reset (capped growth)
- Current annual tax
- $1,710 · $143/mo
- Projected year-2 tax
- $2,416 · $201/mo
- Expected delta
- +$706/yr (+$59/mo · 41.3%)
ⓘ Screening estimate from a state-policy table — verify with the county assessor before closing.
Climate risk First Street
- Flood 1/10 Low FEMA zone X (unshaded) · 0% chance over 30 yrs
- Wildfire 3/10 Moderate
- Heat 3/10 Moderate 7 d/yr ≥101°F today · 15 d/yr by 30 yrs out
- Wind 2/10 Low
- Air quality 4/10 Moderate 4 unhealthy d/yr today · 5 by 30 yrs out
Nearby sold comps map
Loading sold comps map…
Walkable amenities ~0.75 mi
Loading nearby amenities…
Taxation est. · year 1
- Rental income
- $24,622
- − Mortgage interest
- −$7,702
- − Property taxes
- −$1,710
- − Insurance
- −$688
- − Repairs & maintenance
- −$1,970
- − Management
- −$1,970
- − HOA
- −$4,620
- − Depreciation
- −$4,000
- Taxable income
- $1,962
- Est. tax owed @ 24.0%
- −$471
- After-tax cash flow
- $3,310/yr
For passive investors: Depreciation is non-cash, so a rental often shows a tax loss while cash-flowing — sheltering income. Rental losses are passive: they offset passive income freely, and up to $25,000/yr can offset ordinary (W-2) income if you actively participate and your MAGI is under $100k (phasing out to $0 by $150k); unused losses carry forward. On sale, claimed depreciation is recaptured at up to 25%, and gains may owe capital-gains tax (a 1031 exchange can defer both). Figures are a year-1 estimate at your 24.0% rate — not tax advice; consult a CPA.
Schools (NCES district)
- District
- Homewood Flossmoor Chsd 233
- NCES district ID
- 1719560
- Math proficiency
- 21% ▼ -15.00%
- Reading proficiency
- 27% ▼ -13.00%
- Median HH income
- $83,564
- Composite
- 24.42/100
- National rank
- #7681
- State rank
- #272 of 620 in IL
Livability — Glenwood
- Score
- 66/100
- State rank
- #545
- US rank
- #11292
Category grades
Schools grade is shown separately in the Schools card above.
Census & demographics
- Census place
- Glenwood, IL
- City population
- 8,730
- Population (ZIP)
- 8,730
Population outlook (Cook County) Hauer SSP2
- Today (2025)
- 5,347,519 people
- By 2030
- 5,357,703 · +0.2%
- By 2040
- 5,324,924 · -0.4%
- By 2050
- 5,230,762 · -2.2%
- By 2075
- 4,785,735 · -10.5%
- By 2100
- 4,188,836 · -21.7%
Race, ethnicity, and origin ACS 2023
- Neighborhood character
- Predominantly Black (68%)
- Race & ethnicity
- Black 68% White 22% Hispanic / Latino 6% Two or more races 4%
- Hispanic origin (detail)
- Mexican 5%
- Common ancestry
- Romanian 3% Iranian 1% Lithuanian 1%
- Foreign-born
- 3% · Canada
- Languages at home
- 95% English-only · Spanish 4%
Political lean MEDSL · Cook
- 2024 margin
- Solid D (+42.0) · D 70.4% · R 28.4% · Other 1.2%
- 2008→2024 swing
- -11.4pp toward R · 2008: 53.4pp · 2024: 42.0pp
- All cycles
- 2024: D+42.0 2020: D+50.3 2016: D+53.0 2012: D+49.4 2008: D+53.4
Not yet ingested
- Civics
- —
Market trends
- HPI YoY
- ▼ -37.24%
- Current HPI
- 314.1777
- Rent YoY
- —
- Metro
- —
- State GDP YoY
- ▲ 1.59%
- F500 in state
- 60
Industry mix (Fortune 500 HQ in IL)
| Industry | F500 HQs | Revenue |
|---|---|---|
| Insurance | 4 | $201B |
|
||
| Consumer Goods | 4 | $87B |
|
||
| Industrial Machinery | 3 | $64B |
|
||
| Healthcare | 2 | $55B |
|
||
| Retail / Pharmacy | 1 | $148B |
|
||
| Agriculture / Food | 1 | $86B |
|
||
Price history
+83.3% since first listed27 events — show timeline
- 2026-05-15 Price Changed $137,500 MRED as Distributed by MLS Grid
- 2026-05-08 Price Changed $137,000 MRED as Distributed by MLS Grid
- 2026-05-05 Price Changed $144,999 MRED as Distributed by MLS Grid
- 2026-04-04 Listing Removed — MRED as Distributed by MLS Grid
- 2026-03-21 Price Changed — MRED as Distributed by MLS Grid
- 2026-03-13 Listed — MRED as Distributed by MLS Grid
- 2026-03-12 Listing Removed — MRED as Distributed by MLS Grid
- 2026-02-05 Relisted — MRED as Distributed by MLS Grid
- 2025-12-02 Contingent — MRED as Distributed by MLS Grid
- 2025-10-30 Price Changed — MRED as Distributed by MLS Grid
- 2025-10-08 Listed — MRED as Distributed by MLS Grid
- 2025-10-03 Listing Removed — MRED as Distributed by MLS Grid
- 2025-09-21 Relisted — MRED as Distributed by MLS Grid
- 2025-09-19 Listing Removed — MRED as Distributed by MLS Grid
- 2025-09-13 Relisted — MRED as Distributed by MLS Grid
- 2025-09-13 Listing Removed — MRED as Distributed by MLS Grid
- 2025-08-22 Relisted — MRED as Distributed by MLS Grid
- 2025-06-03 Contingent — MRED as Distributed by MLS Grid
- 2025-05-21 Relisted — MRED as Distributed by MLS Grid
- 2025-04-26 Contingent — MRED as Distributed by MLS Grid
- 2025-04-10 Listed — MRED as Distributed by MLS Grid
- 2009-07-30 Sold (Public Records) $80,000 Public Records
- 2009-07-09 Sold (MLS) $79,900 MRED as Distributed by MLS Grid
- 2009-05-01 Contingent — MRED as Distributed by MLS Grid
- 2009-04-20 Price Changed $79,900 MRED as Distributed by MLS Grid
- 2009-03-05 Listed $92,900 MRED as Distributed by MLS Grid
- 1998-06-26 Sold (Public Records) $75,000 Public Records
Property tax history
+5.0%/yrLatest (2023): $1,710 · +272.0% YoY. Source: county tax records.
Cash-flow waterfall
monthlySold comps — $/sqft
last 12 mo · ≤1 miLoading sold comps…