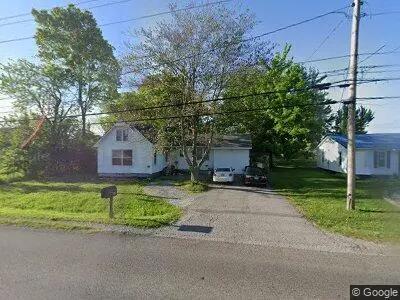
717 E 12th St · Metropolis, IL
Flood risk 1/10 · Minimal
- FEMA flood zone
- —
- Chance of flooding over 30 yrs
- 0.0%
- Est. flood insurance / yr
- —
Fire risk 3/10 · Minor
- Est. fire insurance / yr
- $804 – $1,492
Heat risk 6/10 · Moderate
- Hot days now (above 108°F)
- 7 days/yr
- Hot days in 30 yrs
- 21 days/yr
Wind risk 3/10 · Minor
- Chance of severe wind over 30 yrs
- 6.0%
Air-quality risk 2/10 · Minimal
- Unhealthy air days now
- 1 days/yr
- Unhealthy air days in 30 yrs
- 2 days/yr
Risk factors via First Street. Map © Google.
Why this score? — see what drove the D grade
The composite is a weighted blend of 9 inputs, each scored 0–100. Each bar is that input's sub-score; the figure is the points it added to the 100-point composite (weight × sub-score).
- Cash flow +15.0/30.0
- ARV discount +7.5/15.0
- 1% rule +5.0/10.0
- DSCR +5.0/10.0
- Livability +3.8/5.0
- Rent growth +2.5/5.0
- Condition / age +2.5/5.0
- Schools +2.2/10.0
- Appreciation +0.0/10.0
$20,000
🖨 Deal sheet 📄 Offer letter ✓ Due diligence
Listing remarks MLS
Spacious 3BR/1 home with easy access to Paducah. Home has an updated kitchen with newer cabinets & backsplash. The upstairs bedroom could easily be converted into a family/game room or just used for extra storage. 1 car attached carport. Refrigerator - Stove
Key facts
- Newer cabinets
- Attached carport
- Upstairs bedroom
Tags
Neighborhood map
What this means for you Summary
Snapshot
- This is a 3-bed/1.0-bath single-family listed at $20k.
Deal economics
- At list price, monthly cash flow is $756 ($9k/yr) — positive.
- The deal already cash-flows at list — no discount required.
- Meets the 1% rule at list price ($1k rent vs $20k).
- Cap rate 51.7% vs local median 5.3% in Metropolis — top-decile yield for the area; either an underpriced asset or a hidden risk that comps aren't pricing in. Stress-test before assuming the spread holds.
Location & tenants
- Location reads 75/100 on livability (#217 in IL, #4,091 nationally) — a middle-class / working-renter tenant base. Strengths: cost of living A+, housing A+, health & safety A+; Watch: schools D-, commute F, employment D-.
- Massac UD 1 (rural): math 24% / reading 28% proficiency, ranked #318 of 620 in IL (top 51%) — low school quality limits family demand, transient renter base, plan for 1-2y turnover.
- Market conditions: 73 active listings in the ZIP; 5 units permitted in Massac County in 2024 (0 in 5+ unit buildings).
Forward outlook
- Local home prices are declining (-3.0%/yr); year-one equity from $138 of loan paydown is wiped out by about $600 of value loss. Plan a longer hold.
- Massac County population projected at -28% by 2050 — secular population decline; favor cash flow + early exit over multi-decade hold.
- At projected returns (-3.0% appreciation + 3.0% rent growth), your $6k cash investment doubles in ~1 year — after that, you're playing with house money.
Negotiation context
- Only 1 days on market — expect competitive offers; lowballing is unlikely to land.
- 10 sale attempts since 19y ago with the ask held roughly flat each time — persistent listings suggest the price (not the market) is what's stuck; bring a comps-based counter.
Risks & watch-outs
- Watch-outs: property tax is 4.1% of price; built in 1924 — expect roof / HVAC / electrical / plumbing capex.
- Climate carrying-cost: extreme-heat days projected 7→21/yr by 2055 (HVAC capex compounding) — expect insurance premiums to compound above CPI over the hold.
Questions for the listing agent
- Built in 1924 — when were the roof, HVAC, electrical panel, plumbing, and water heater last replaced?
- Property tax is high relative to price — has the assessment been appealed recently, and will the sale trigger a re-assessment?
- Is there a deadline driving the sale (1031 exchange, divorce, estate, relocation)? That informs how much negotiation room exists.
- Schools are D-rated, which usually means shorter tenancies and higher turnover. Who's the typical renter profile here, and what's been the actual vacancy rate?
- The area grade is low — what's the realistic commute time and amenity access for the typical tenant pool here? Any planned neighborhood developments (good or bad) we should know about?
- What's the average days-on-market for RENTAL listings here right now (not sales)? A rising rental-DOM trend means longer vacancies and softer asking-rent achievability than the comps imply.
- What's the recent tenant-quality profile in this submarket — average credit score on applications, eviction rate, late-payment / NSF rate, and stable-employment percentage? A property-management company in the area should have these aggregated.
- How much new for-sale + rental construction is in the pipeline within 1–3 miles? Heavy new supply typically softens prices + rents 12–24 months out; constrained supply supports both.
Investment metrics
- 1% rule
- 5.93% ✓
- Cap rate
- 51.66%
- Cash-on-cash
- 162.01%
- DSCR
- 8.21
- GRM
- 1.4
CMA / ARV
- ARV (on-the-fly)
- $104,196
- Comps found
- 12
Show comp detail 12 sales within ~0.75 mi
| Address | Dist | Beds/Ba | Sqft | Sold | Price | $/sf | Match |
|---|---|---|---|---|---|---|---|
| 1018 Girard St | 0.36mi | 3/1.0 | 1,197 (-13%) | 0mo | $19,000 | $16 | 62 |
| 312 E 12th St | 0.29mi | 3/2.0 | 1,450 (+6%) | 15mo | $110,000 | $76 | 60 |
| 1800 Butler St | 0.42mi | 3/1.5 | 1,435 (+5%) | 13mo | $83,500 | $58 | 60 |
| 2 Dove Ln | 0.22mi | 3/2.0 | 1,570 (+14%) | 2mo | $215,000 | $137 | 60 |
| 2 Eagle Ln | 0.19mi | 3/2.0 | 1,500 (+9%) | 14mo | $180,400 | $120 | 60 |
| 1110 Girard St | 0.33mi | 3/1.0 | 1,481 (+8%) | 18mo | $119,900 | $81 | 56 |
| 309 E 9th St | 0.42mi | 2/1.0 (-1) | 1,280 (-7%) | 11mo | $96,700 | $76 | 55 |
| 807 E 5th St | 0.64mi | 3/1.0 | 1,296 (-6%) | 12mo | $75,000 | $58 | 51 |
| 1509 Ferry St | 0.53mi | 3/1.0 | 1,458 (+6%) | 21mo | $147,500 | $101 | 47 |
| 1002 Ferry St | 0.52mi | 3/1.5 | 1,200 (-12%) | 8mo | $59,000 | $49 | 46 |
| 718 Girard St | 0.52mi | 2/1.0 (-1) | 1,200 (-12%) | 8mo | $73,000 | $61 | 43 |
| 204 W 19th St | 0.71mi | 2/2.0 (-1) | 1,250 (-9%) | 14mo | $50,000 | $40 | 31 |
Match score weights: distance 35% · size 25% · config 20% · recency 20%. Top-matched comps best support the ARV.
Projected returns pro-forma
-3.0% appreciation · 3.0% rent growth · sell at horizon
- IRR
- —
- Equity multiple
- 9.03×
- Total profit
- $44,956
- Equity at exit
- $2,982
- IRR
- —
- Equity multiple
- 19.09×
- Total profit
- $101,331
- Equity at exit
- $1,729
Cash invested: $5,600 (down + closing). Projections, not guarantees.
Landlord ↔ Tenant lean methodology
- Overall (STATE)
- 43 Moderately Tenant-Leaning
- State Illinois
- 43 Moderately Tenant-Leaning · D+7
- County
- — inherits STATE
- City
- — inherits STATE
ZIP-level market 62960
- Home prices YoY
- -19.6%
- Active inventory
- 73
- Price-to-rent
- 1.4×
Monthly cashflow live
- Estimated rent
- $1,186 medium interval (Pro) →
- Mortgage (P&I)
- −$105
- Tax from tax record
- −$68 /mo · $816/yr
- Insurance
- −$8
- HOA
- −$0
- Vacancy / Maint / Mgmt
- −$249
- Net cashflow
- $756
Break-even live
UW: 25.0% down · 7.5% · 30yr · 1.5% tax · 5.0% vac · 8.0% maint · 8.0% mgmt
Financing live
Cash to close
- Down payment
- $5,000
- Closing costs
- $600
- Reserves months
- —
- Total cash needed
- —
Loan-product check · same deal, 3 products live
Conventional
25% down · 7.5% · 30yr
- Down + closing
- —
- Monthly P&I
- —
- Monthly cashflow
- —
- DSCR
- —
- Eligible?
- —
Personal DTI + credit; lowest rate.
DSCR
20% down · 8.5% · 30yr
- Down + closing
- —
- Monthly P&I
- —
- Monthly cashflow
- —
- DSCR
- —
- Eligible?
- —
No personal income docs; deal must DSCR.
Hard money
10% down · 12.0% · 12mo
- Down + closing
- —
- Monthly P&I
- —
- Monthly cashflow
- —
- DSCR
- —
- Eligible?
- —
Short-term bridge; refi at stabilization.
Listing history 21 events
-
2026-05-26$20,000 Active
-
2015-12-11soldstatus $48,000 262-char remark
Show marketing remark (262 chars)
Spacious 3BR/1 home with easy access to Paducah. Home has an updated kitchen with newer cabinets & backsplash. The upstairs bedroom could easily be converted into a family/game room or just used for extra storage. 1 car attached carport. Refrigerator - Stove
-
2015-04-27$49,900 262-char remark
Show marketing remark (262 chars)
Spacious 3BR/1 home with easy access to Paducah. Home has an updated kitchen with newer cabinets & backsplash. The upstairs bedroom could easily be converted into a family/game room or just used for extra storage. 1 car attached carport. Refrigerator - Stove
-
2013-01-23soldstatus $23,900 139-char remark
Show marketing remark (139 chars)
717 East 12th Street 3BR/1BA/1 Attached carport home. Large, open kitchen with oak cabinets. CH/Air and vinyl siding. Range, Elec Fireplace
-
2013-01-23soldstatus $23,900 139-char remark
Show marketing remark (139 chars)
717 East 12th Street 3BR/1BA/1 Attached carport home. Large, open kitchen with oak cabinets. CH/Air and vinyl siding. Range, Elec Fireplace
-
2013-01-23soldstatus $23,900
Show marketing remark (139 chars)
717 East 12th Street 3BR/1BA/1 Attached carport home. Large, open kitchen with oak cabinets. CH/Air and vinyl siding. Range, Elec Fireplace
-
2012-10-14$23,900 139-char remark
Show marketing remark (139 chars)
717 East 12th Street 3BR/1BA/1 Attached carport home. Large, open kitchen with oak cabinets. CH/Air and vinyl siding. Range, Elec Fireplace
-
2012-10-14$23,900 139-char remark
Show marketing remark (139 chars)
717 East 12th Street 3BR/1BA/1 Attached carport home. Large, open kitchen with oak cabinets. CH/Air and vinyl siding. Range, Elec Fireplace
-
2012-10-06soldstatus $13,147
-
2012-10-06soldstatus $13,147
-
2012-10-05soldstatus $13,149
-
2012-10-05$41,170
-
2012-10-05$41,170
-
2012-05-15$41,170
-
2007-08-22soldstatus $68,900
-
2007-08-22soldstatus $68,900
-
2007-08-22soldstatus $68,900
-
2007-05-21$77,400
-
2007-05-21$77,400
ⓘ Source: listings_history table (triggers on properties + properties_extension) + one-shot
backfill from property_details.listing_events for pre-trigger history.
Tax reassessment forecast IL · Partial reset (capped growth)
- Current annual tax
- $816 · $68/mo
- Projected year-2 tax
- $816 · $68/mo
- Expected delta
- $0/yr ($0/mo · 0.0%)
ⓘ Screening estimate from a state-policy table — verify with the county assessor before closing.
Climate risk First Street
- Flood 1/10 Low 0% chance over 30 yrs
- Wildfire 3/10 Moderate
- Heat 6/10 Major 7 d/yr ≥108°F today · 21 d/yr by 30 yrs out
- Wind 3/10 Moderate 6% chance of damaging wind over 30 yrs
- Air quality 2/10 Low 1 unhealthy d/yr today · 2 by 30 yrs out
Nearby sold comps map
Loading sold comps map…
Walkable amenities ~0.75 mi
Loading nearby amenities…
Taxation est. · year 1
- Rental income
- $14,237
- − Mortgage interest
- −$1,120
- − Property taxes
- −$816
- − Insurance
- −$100
- − Repairs & maintenance
- −$1,139
- − Management
- −$1,139
- − Depreciation
- −$582
- Taxable income
- $9,341
- Est. tax owed @ 24.0%
- −$2,242
- After-tax cash flow
- $6,831/yr
For passive investors: Depreciation is non-cash, so a rental often shows a tax loss while cash-flowing — sheltering income. Rental losses are passive: they offset passive income freely, and up to $25,000/yr can offset ordinary (W-2) income if you actively participate and your MAGI is under $100k (phasing out to $0 by $150k); unused losses carry forward. On sale, claimed depreciation is recaptured at up to 25%, and gains may owe capital-gains tax (a 1031 exchange can defer both). Figures are a year-1 estimate at your 24.0% rate — not tax advice; consult a CPA.
Schools (NCES district)
- District
- Massac UD 1
- NCES district ID
- 1725000
- Math proficiency
- 24% ▼ -13.00%
- Reading proficiency
- 28% ▼ -13.00%
- Median HH income
- $41,431
- Composite
- 22.06/100
- National rank
- #8192
- State rank
- #318 of 620 in IL
Livability — Metropolis
- Score
- 75/100
- State rank
- #217
- US rank
- #4091
Category grades
Schools grade is shown separately in the Schools card above.
Census & demographics
- Census place
- Metropolis, IL
- Population (ZIP)
- 10,823
Population outlook (Massac County) Hauer SSP2
- Today (2025)
- 13,461 people
- By 2030
- 12,675 · -5.8%
- By 2040
- 11,124 · -17.4%
- By 2050
- 9,711 · -27.9%
- By 2075
- 7,253 · -46.1%
- By 2100
- 5,666 · -57.9%
Race, ethnicity, and origin ACS 2023
- Neighborhood character
- Predominantly White (86%)
- Race & ethnicity
- White 86% Black 7% Two or more races 5% Hispanic / Latino 3%
- Common ancestry
- Romanian 2% Serbian 2% Lithuanian 2%
- Foreign-born
- 2% · Canada
- Languages at home
- 97% English-only · Spanish 2%
Political lean MEDSL · Massac
- 2024 margin
- Solid R (+48.8) · D 25.2% · R 74.0%
- 2008→2024 swing
- -25.4pp toward R · 2008: -23.4pp · 2024: -48.8pp
- All cycles
- 2024: R+48.8 2020: R+48.0 2016: R+49.6 2012: R+33.7 2008: R+23.4
Not yet ingested
- Civics
- —
Market trends
- HPI YoY
- ▼ -33.38%
- Current HPI
- 137.0772
- Rent YoY
- —
- Metro
- —
- State GDP YoY
- ▲ 1.59%
- F500 in state
- 60
Industry mix (Fortune 500 HQ in IL)
| Industry | F500 HQs | Revenue |
|---|---|---|
| Insurance | 4 | $201B |
|
||
| Consumer Goods | 4 | $87B |
|
||
| Industrial Machinery | 3 | $64B |
|
||
| Healthcare | 2 | $55B |
|
||
| Retail / Pharmacy | 1 | $148B |
|
||
| Agriculture / Food | 1 | $86B |
|
||
Price history
-74.2% since first listed21 events — show timeline
- 2026-05-26 Listed $20,000 FSBO.com
- 2015-12-11 Sold (MLS) $48,000 MRED as Distributed by MLS Grid
- 2015-12-11 Sold (MLS) $48,000 RMLSA as Distributed by MLS Grid
- 2015-04-27 Listed $49,900 MRED as Distributed by MLS Grid
- 2015-04-27 Listed $49,900 RMLSA as Distributed by MLS Grid
- 2013-01-23 Sold (Public Records) $23,900 Public Records
- 2013-01-23 Sold (MLS) $23,900 RMLSA as Distributed by MLS Grid
- 2013-01-23 Sold (MLS) $23,900 MRED as Distributed by MLS Grid
- 2012-10-14 Listed $23,900 RMLSA as Distributed by MLS Grid
- 2012-10-14 Listed $23,900 MRED as Distributed by MLS Grid
- 2012-10-06 Sold (MLS) $13,147 CIBR
- 2012-10-06 Sold (MLS) $13,147 MRED as Distributed by MLS Grid
- 2012-10-05 Listed $41,170 CIBR
- 2012-10-05 Listed $41,170 MRED as Distributed by MLS Grid
- 2012-10-05 Sold (MLS) $13,149 MRED as Distributed by MLS Grid
- 2012-05-15 Listed $41,170 MRED as Distributed by MLS Grid
- 2007-08-22 Sold (Public Records) $68,900 Public Records
- 2007-08-22 Sold (MLS) $68,900 MRED as Distributed by MLS Grid
- 2007-08-22 Sold (MLS) $68,900 RMLSA as Distributed by MLS Grid
- 2007-05-21 Listed $77,400 MRED as Distributed by MLS Grid
- 2007-05-21 Listed $77,400 RMLSA as Distributed by MLS Grid
Property tax history
+12.3%/yrLatest (2024): $816 · -2.2% YoY. Source: county tax records.
Cash-flow waterfall
monthlySold comps — $/sqft
last 12 mo · ≤1 miLoading sold comps…