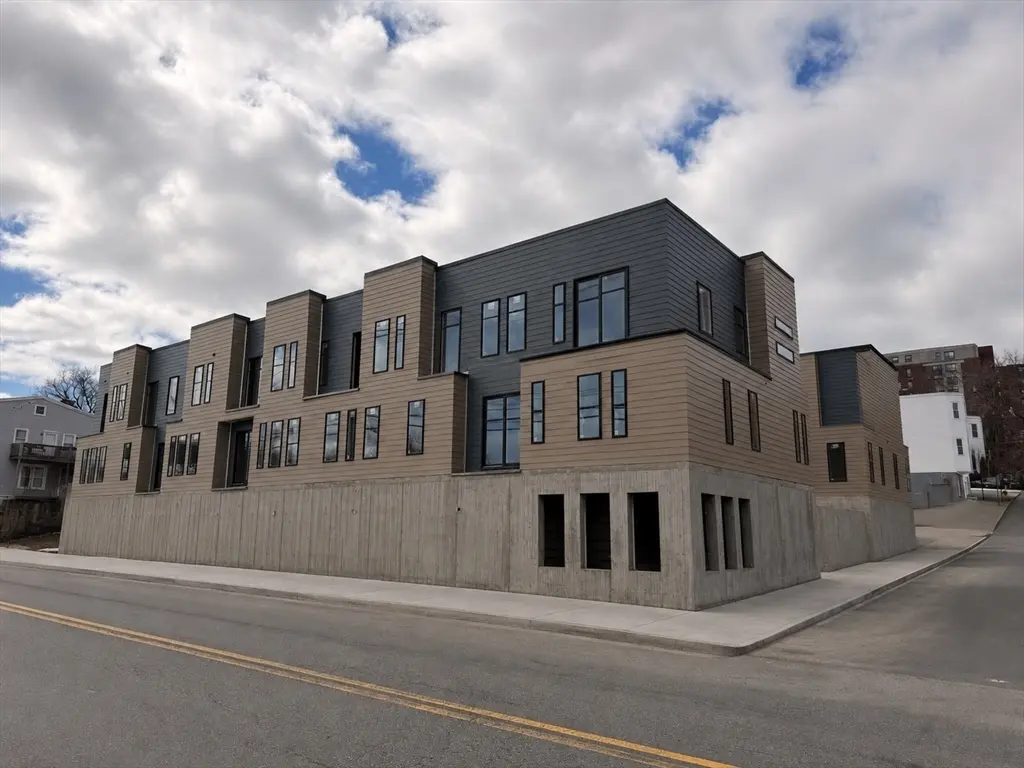
150 Williams #3 · Chelsea, MA
Flood risk No data
- FEMA flood zone
- —
- Chance of flooding over 30 yrs
- —
- Est. flood insurance / yr
- —
Fire risk No data
- Est. fire insurance / yr
- —
Heat risk 6/10 · Moderate
- Hot days now (above threshold)
- 7 days/yr
- Hot days in 30 yrs
- 15 days/yr
Wind risk No data
- Chance of severe wind over 30 yrs
- —
Air-quality risk 3/10 · Minor
- Unhealthy air days now
- 3 days/yr
- Unhealthy air days in 30 yrs
- 3 days/yr
Risk factors via First Street. Map © Google.
Why this score? — see what drove the B- grade
The composite is a weighted blend of 9 inputs, each scored 0–100. Each bar is that input's sub-score; the figure is the points it added to the 100-point composite (weight × sub-score).
- Cash flow +27.8/30.0
- DSCR +9.8/10.0
- 1% rule +9.0/10.0
- ARV discount +7.5/15.0
- Condition / age +4.0/5.0
- Livability +3.7/5.0
- Rent growth +3.3/5.0
- Schools +1.6/10.0
- Appreciation +0.0/10.0
$195,000
🖨 Deal sheet 📄 Offer letter ✓ Due diligence
Listing remarks MLS
CONDO LOTTERY. NEW CONSTRUCTION ALERT: DEED RESTRICTED AFFORDABLE 1 BED CONDO AVAILABLE. Many modern features. Units with open concept design/modern kitchen design, bright living spaces with oversized windows. Buyers must fill out application, have a non FHA/VHA conventional fixed pre-approval letter, be a first time homeowner, not have assets higher than $100,000, and be under the following 60% AMI Income levels: 1 person $69,480 2 persons $79,440. Application Deadline is May 31st, 2026.
Key facts
- New construction
- Bright living spaces
- Open concept design
Tags
Neighborhood map
What this means for you Summary
Snapshot
- This is a 1-bed/1.0-bath condo listed at $195k. Condition is rated good.
Deal economics
- At list price, monthly cash flow is $596 ($7k/yr) — positive.
- The deal already cash-flows at list — no discount required.
- Meets the 1% rule at list price ($3k rent vs $195k).
- Recommended offer: $189k (3.0% below list) — sets the bar for market timing.
- Cap rate 10.0% vs local median 3.6% in Chelsea — top-decile yield for the area; either an underpriced asset or a hidden risk that comps aren't pricing in. Stress-test before assuming the spread holds.
Location & tenants
- Location reads 73/100 on livability (#103 in MA) — a middle-class / working-renter tenant base. Strengths: amenities A+, commute A+, health & safety A+; Watch: schools D+, crime F, cost of living F.
- Chelsea (suburban): math 12% / reading 24% proficiency, ranked #294 of 302 in MA (top 97%) — low school quality limits family demand, transient renter base, plan for 1-2y turnover; 80% free/reduced lunch — lower-income household profile, screen leases tightly.
- Market conditions: Rents rising (+3.0%/yr); 48 active listings in the ZIP; 40 comparable units currently listed for rent nearby; rentals at typical pace (median 15d on market — plan ~3-4 weeks tenant-placement turnaround); 2,207 units permitted in Suffolk County in 2024 (1,961 in 5+ unit buildings).
- At $2,721/mo this rent would consume 45% of the median local household income ($72k/yr) (locally 3332% of renters already pay >50% of income on rent) — very limited rent-growth headroom before tenants either downsize or default.
Forward outlook
- Local home prices are declining (-3.0%/yr); year-one equity from $1k of loan paydown is wiped out by about $6k of value loss. Plan a longer hold.
- Suffolk County population projected at +37% by 2050 — long-run rental-demand tailwind backs the buy-and-hold thesis.
- At projected returns (-3.0% appreciation + 3.0% rent growth), your $55k cash investment doubles in ~9 years — after that, you're playing with house money.
Negotiation context
- It's been on market 60 days — a 3% lower offer ($189k) is reasonable based on typical stale-listing flexibility.
Risks & watch-outs
- Climate carrying-cost: extreme-heat days projected 7→15/yr by 2055 (HVAC capex compounding) — expect insurance premiums to compound above CPI over the hold.
Questions for the listing agent
- It's been on market 60 days. Have you received any prior offers? Is the seller open to a 3% concession, seller financing, or rate buy-down credit?
- What does the HOA fee cover, when was the last increase, and are there any pending special assessments or reserve-fund shortfalls?
- Any open or pending special assessments — roof, HVAC, plumbing, elevator, façade? What's the per-unit balance and payoff schedule, and is the seller paying it off at close or rolling it to the buyer?
- Is there a deadline driving the sale (1031 exchange, divorce, estate, relocation)? That informs how much negotiation room exists.
- Schools are D-rated, which usually means shorter tenancies and higher turnover. Who's the typical renter profile here, and what's been the actual vacancy rate?
- Crime grade is F in this area — have there been break-ins, vandalism, or insurance claims at this property in the last 3 years? What carrier currently insures it and at what premium?
- What's the average days-on-market for RENTAL listings here right now (not sales)? A rising rental-DOM trend means longer vacancies and softer asking-rent achievability than the comps imply.
- What's the recent tenant-quality profile in this submarket — average credit score on applications, eviction rate, late-payment / NSF rate, and stable-employment percentage? A property-management company in the area should have these aggregated.
- How much new apartment / multifamily construction is in the pipeline within 1–3 miles? Heavy new supply (>2% of stock underway) typically softens rents 12–24 months out; light construction supports rent growth.
Investment metrics
- 1% rule
- 1.40% ✓
- Cap rate
- 9.96%
- Cash-on-cash
- 13.09%
- DSCR
- 1.58
- GRM
- 6.0
CMA / ARV
No comps found within radius.
Projected returns pro-forma
-3.0% appreciation · 3.05% rent growth · sell at horizon
- IRR
- 3.2%
- Equity multiple
- 1.12×
- Total profit
- $6,640
- Equity at exit
- $29,075
- IRR
- 12.8%
- Equity multiple
- 2.02×
- Total profit
- $55,872
- Equity at exit
- $16,860
Cash invested: $54,600 (down + closing). Projections, not guarantees.
Landlord ↔ Tenant lean methodology
- Overall (STATE)
- 20 Strongly Tenant-Friendly
- State Massachusetts
- 20 Strongly Tenant-Friendly · D+15
- County
- — inherits STATE
- City
- — inherits STATE
ZIP-level market 02150
- Home prices YoY
- -20.3%
- Rents YoY
- 3.0%
- Active inventory
- 48
- Price-to-rent
- 6.0×
Monthly cashflow live
- Estimated rent
- $2,721 high interval (Pro) →
- Mortgage (P&I)
- −$1,023
- Tax est. 1.5%
- −$244 /mo · $2,925/yr
- Insurance
- −$81
- HOA
- −$206
- Vacancy / Maint / Mgmt
- −$571
- Net cashflow
- $596
Break-even live
UW: 25.0% down · 7.5% · 30yr · 1.5% tax · 5.0% vac · 8.0% maint · 8.0% mgmt
Financing live
Cash to close
- Down payment
- $48,750
- Closing costs
- $5,850
- Reserves months
- —
- Total cash needed
- —
Loan-product check · same deal, 3 products live
Conventional
25% down · 7.5% · 30yr
- Down + closing
- —
- Monthly P&I
- —
- Monthly cashflow
- —
- DSCR
- —
- Eligible?
- —
Personal DTI + credit; lowest rate.
DSCR
20% down · 8.5% · 30yr
- Down + closing
- —
- Monthly P&I
- —
- Monthly cashflow
- —
- DSCR
- —
- Eligible?
- —
No personal income docs; deal must DSCR.
Hard money
10% down · 12.0% · 12mo
- Down + closing
- —
- Monthly P&I
- —
- Monthly cashflow
- —
- DSCR
- —
- Eligible?
- —
Short-term bridge; refi at stabilization.
Rent comps 40 comps
| Address | Beds | Baths | Sqft | Rent | $/sqft | DOM | Units | Dist |
|---|---|---|---|---|---|---|---|---|
| 10 Howell Ct Unit 1 Chelsea, MA | 2.0 | 1.0 | 1000 | $2,500 | $2.50 | 17d | 1 | 0.09mi |
| 69 Beacon St Unit 3 Chelsea, MA | 2.0 | 1.0 | 600 | $2,200 | $3.67 | 43d | 1 | 0.12mi |
| 90 Chestnut St #1 Chelsea, MA | 2.0 | 1.0 | 1100 | $2,800 | $2.55 | 43d | 1 | 0.12mi |
| 54 Beacon St #2 Chelsea, MA | 2.0 | 1.0 | 899 | $2,600 | $2.89 | 10d | 1 | 0.16mi |
| 100 Captains Row #203 Chelsea, MA | 2.0 | 1.0 | 1067 | $2,800 | $2.62 | 17d | 1 | 0.16mi |
| 6 Admirals Way Unit 1 Chelsea, MA | 2.0 | 1.0 | 875 | $2,675 | $3.06 | 17d | 1 | 0.18mi |
| 200 Captains Row #307 Chelsea, MA | 2.0 | 2.0 | 1023 | $3,150 | $3.08 | 43d | 1 | 0.21mi |
| 179 Winnisimmet St Unit 5 Chelsea, MA | 1.0 | 1.0 | 600 | $1,800 | $3.00 | 4d | 1 | 0.25mi |
| 40 Medford St Unit 1-CP Chelsea, MA | 2.0 | 1.0 | 896 | $2,900 | $3.24 | 4d | 1 | 0.27mi |
| 40 Medford St Chelsea, MA | 2.0 | 1.0 | 896 | $2,900 | $3.24 | 12d | 1 | 0.27mi |
| 325 Commandants Way Chelsea, MA | 2.0 | 1.0–2.0 | 900 | $2,862 | $3.18 | 1d | 6 | 0.28mi |
| 300 Commandants Way Chelsea, MA | 2.0 | 2.0 | 965 | $3,100 | $3.21 | 2d | 1 | 0.28mi |
| 25 Division St Chelsea, MA | 2.0 | 1.0 | 550 | $2,295 | $4.17 | 43d | 1 | 0.28mi |
| 25 Division St Chelsea, MA | 1.0 | 1.0 | 600 | $2,295 | $3.83 | 24d | 1 | 0.28mi |
| 140 Pearl St Unit 1470142P Chelsea, MA | 2.0 | 1.0 | 871 | $5,496 | $6.31 | 14d | 1 | 0.32mi |
| 140 Pearl St Unit 1470146P Chelsea, MA | 1.0 | 1.0 | 775 | $4,944 | $6.38 | 23d | 1 | 0.32mi |
| 140 Pearl St Unit 1470150P Chelsea, MA | 1.0 | 1.0 | 678 | $3,840 | $5.66 | 16d | 1 | 0.32mi |
| 140 Pearl St Unit 1470152P Chelsea, MA | 1.0 | 1.0 | 570 | $3,995 | $7.01 | 21d | 1 | 0.32mi |
| 148 Pearl St Unit 1470143P Chelsea, MA | 2.0 | 1.0 | 882 | $4,326 | $4.90 | 14d | 1 | 0.33mi |
| 208 Cherry St Unit 12 Chelsea, MA | 1.0 | 1.0 | 560 | $2,100 | $3.75 | 24d | 1 | 0.43mi |
| 466 Broadway Chelsea, MA | 1.0 | 1.0 | 600 | $1,880 | $3.13 | 17d | 1 | 0.45mi |
| 250 Vale St Chelsea, MA | 2.0 | 1.0–2.0 | 886 | $2,970 | $3.35 | 1d | 19 | 0.52mi |
| 241 Walnut St Unit 3 Chelsea, MA | 2.0 | 1.0 | 750 | $2,500 | $3.33 | 24d | 1 | 0.52mi |
| 48 Washington Ave #203 Chelsea, MA | 1.0 | 1.0 | 595 | $1,900 | $3.19 | 21d | 1 | 0.52mi |
| 221 Shurtleff St #6 Chelsea, MA | 2.0 | 1.0 | 915 | $2,295 | $2.51 | 10d | 1 | 0.56mi |
| 255 Vale St Chelsea, MA | 2.0 | 1.0–2.0 | 903 | $2,920 | $3.23 | 1d | 19 | 0.57mi |
| Heard St Chelsea, MA | — | 1.0 | 587 | $2,475 | $4.22 | 43d | 1 | 0.59mi |
| 100 Heard St Chelsea, MA | 3.0 | 1.0–2.0 | 914 | $2,998 | $3.28 | 1d | 46 | 0.60mi |
| 337 2nd St Everett, MA | 3.0 | 1.0–2.0 | 1076 | $3,539 | $3.29 | 1d | 70 | 0.63mi |
| 600 Broadway Everett, MA | 1.0–2.0 | 1.0–2.0 | 722 | $2,300 | $3.18 | 4d | 17 | 0.64mi |
| 150 Heard St Chelsea, MA | 2.0 | 2.0 | 1114 | $3,560 | $3.20 | 4d | 1 | 0.65mi |
| 150 Heard St Chelsea, MA | 2.0 | 2.0 | 1114 | $3,565 | $3.20 | 43d | 1 | 0.65mi |
| 101 Mill Rd Everett, MA | 2.0 | 1.0–2.0 | 906 | $3,125 | $3.45 | 2d | 27 | 0.66mi |
| 102 Mill Rd Everett, MA | 2.0 | 1.0–2.0 | 912 | $3,245 | $3.56 | 2d | 31 | 0.67mi |
| 202 Mill Rd Everett, MA | 2.0 | 1.0–2.0 | 788 | $3,150 | $4.00 | 1d | 14 | 0.70mi |
| 18 Tudor St Unit 4 Chelsea, MA | 1.0 | 1.0 | 800 | $1,850 | $2.31 | 43d | 1 | 0.70mi |
| 319 Spruce St Apt 2 Chelsea, MA | 1.0 | 1.0 | 700 | $1,985 | $2.84 | 1d | 1 | 0.73mi |
| 1760 Revere Beach Pkwy Everett, MA | 1.0–3.0 | 1.0–2.0 | 997 | $2,874 | $2.88 | 1d | 22 | 0.74mi |
| 180 Central Ave Chelsea, MA | 2.0 | 1.0–2.0 | 756 | $2,754 | $3.64 | 2d | 13 | 0.78mi |
| 178 Washington Ave Unit 205 Chelsea, MA | 1.0 | 1.0 | 650 | $2,300 | $3.54 | 43d | 1 | 0.78mi |
HOA detail condo
- Monthly dues
- $206 · $2,472/yr
- Assessments
- None detected in remarks — confirm with the listing agent.
Listing history 2 events
-
2026-05-31days on market $195,000 Active 60 DOM
-
2026-04-01$195,000 New 496-char remark
Show marketing remark (496 chars)
CONDO LOTTERY. NEW CONSTRUCTION ALERT: DEED RESTRICTED AFFORDABLE 1 BED CONDO AVAILABLE. Many modern features. Units with open concept design/modern kitchen design, bright living spaces with oversized windows. Buyers must fill out application, have a non FHA/VHA conventional fixed pre-approval letter, be a first time homeowner, not have assets higher than $100,000, and be under the following 60% AMI Income levels: 1 person $69,480 2 persons $79,440. Application Deadline is May 31st, 2026.
ⓘ Source: listings_history table (triggers on properties + properties_extension) + one-shot
backfill from property_details.listing_events for pre-trigger history.
Climate risk First Street
- Heat 6/10 Major
- Air quality 3/10 Moderate 3 unhealthy d/yr today · 3 by 30 yrs out
Nearby sold comps map
Loading sold comps map…
Walkable amenities ~0.75 mi
Loading nearby amenities…
Taxation est. · year 1
- Rental income
- $32,646
- − Mortgage interest
- −$10,923
- − Property taxes
- −$2,925
- − Insurance
- −$975
- − Repairs & maintenance
- −$2,612
- − Management
- −$2,612
- − HOA
- −$2,472
- − Depreciation
- −$5,673
- Taxable income
- $4,455
- Est. tax owed @ 24.0%
- −$1,069
- After-tax cash flow
- $6,078/yr
For passive investors: Depreciation is non-cash, so a rental often shows a tax loss while cash-flowing — sheltering income. Rental losses are passive: they offset passive income freely, and up to $25,000/yr can offset ordinary (W-2) income if you actively participate and your MAGI is under $100k (phasing out to $0 by $150k); unused losses carry forward. On sale, claimed depreciation is recaptured at up to 25%, and gains may owe capital-gains tax (a 1031 exchange can defer both). Figures are a year-1 estimate at your 24.0% rate — not tax advice; consult a CPA.
Condition & rehab AI · 7 photos
This modern, newly constructed condo is in good condition with minimal repairs needed. Painting and finishing touches will significantly enhance its appeal and value.
Value-add opportunities
- Resale Paint interior walls — Fresh paint enhances the home's appearance and can increase its appeal to potential buyers.
- Resale Install countertops and flooring — Completed finishes in the kitchen and bathroom will make the home more attractive and functional for potential buyers.
- Both Landscaping — Landscaping can improve curb appeal and add value to both resale and rental markets.
Renovation cost estimate screening
Value-add ROI direction
- Resale Paint interior walls — Fresh paint enhances the home's appearance and can increase its appeal to potential buyers. ↑
- Resale Install countertops and flooring — Completed finishes in the kitchen and bathroom will make the home more attractive and functional for potential buyers. ↑
- Both Landscaping — Landscaping can improve curb appeal and add value to both resale and rental markets. ↑
ⓘ Cost ranges are severity-bucket heuristics (US national rule-of-thumb). Get contractor quotes + a written scope before underwriting a rehab budget.
Schools (NCES district)
- District
- Chelsea
- NCES district ID
- 2503540
- Math proficiency
- 12% ▼ -15.00%
- Reading proficiency
- 24% ▼ -8.00%
- Median HH income
- $46,339
- Composite
- 15.86/100
- National rank
- #9259
- State rank
- #294 of 302 in MA
Livability — Chelsea
- Score
- 73/100
- State rank
- #103
- US rank
- #5375
Category grades
Schools grade is shown separately in the Schools card above.
Census & demographics
- Census place
- Chelsea, MA
- County
- Suffolk County · 777,335 people
- City population
- 39,908
- Metro
- Boston-Cambridge-Newton, MA-NH
- Population (ZIP)
- 39,908
- Household income
- $72,179
- Rent vs Own
- Severe rent burden
- 3332.0
Population outlook (Suffolk County) Hauer SSP2
- Today (2025)
- 915,464 people
- By 2030
- 983,798 · +7.5%
- By 2040
- 1,119,602 · +22.3%
- By 2050
- 1,255,187 · +37.1%
- By 2075
- 1,534,434 · +67.6%
- By 2100
- 1,748,505 · +91.0%
Race, ethnicity, and origin ACS 2023
- Neighborhood character
- Predominantly Hispanic (65%)
- Race & ethnicity
- Hispanic / Latino 65% Two or more races 51% White 20% Black 6% Asian 3%
- Hispanic origin (detail)
- Puerto Rican 9% Dominican 4%
- Common ancestry
- Estonian 2% Romanian 1% Lithuanian 1%
- Foreign-born
- 45% · Canada, Jamaica, China
- Languages at home
- 30% English-only · Spanish 59% Other Indo-European 3% Arabic 2%
Political lean MEDSL · Suffolk
- 2024 margin
- Solid D (+52.5) · D 74.8% · R 22.4% · Other 2.8%
- 2008→2024 swing
- -3.2pp toward R · 2008: 55.7pp · 2024: 52.5pp
- All cycles
- 2024: D+52.5 2020: D+63.2 2016: D+63.0 2012: D+56.7 2008: D+55.7
Not yet ingested
- Civics
- —
Market trends
- HPI YoY
- ▼ -101.21%
- Current HPI
- 397.5973
- Rent YoY
- ▲ 3.05%
- Metro
- Boston-Cambridge-Newton, MA-NH
- State GDP YoY
- ▲ 2.28%
- F500 in state
- 38
Industry mix (Fortune 500 HQ in MA)
| Industry | F500 HQs | Revenue |
|---|---|---|
| Technology | 3 | $17B |
|
||
| Insurance | 2 | $84B |
|
||
| Retail | 2 | $76B |
|
||
| Life Sciences | 1 | $43B |
|
||
| Energy Technology | 1 | $31B |
|
||
| Aerospace / Defense | 1 | $18B |
|
||
Price history
1 event — show timeline
- 2026-04-01 Listed $195,000 MLS PIN
Cash-flow waterfall
monthlySold comps — $/sqft
last 12 mo · ≤1 miLoading sold comps…