 Fourplex
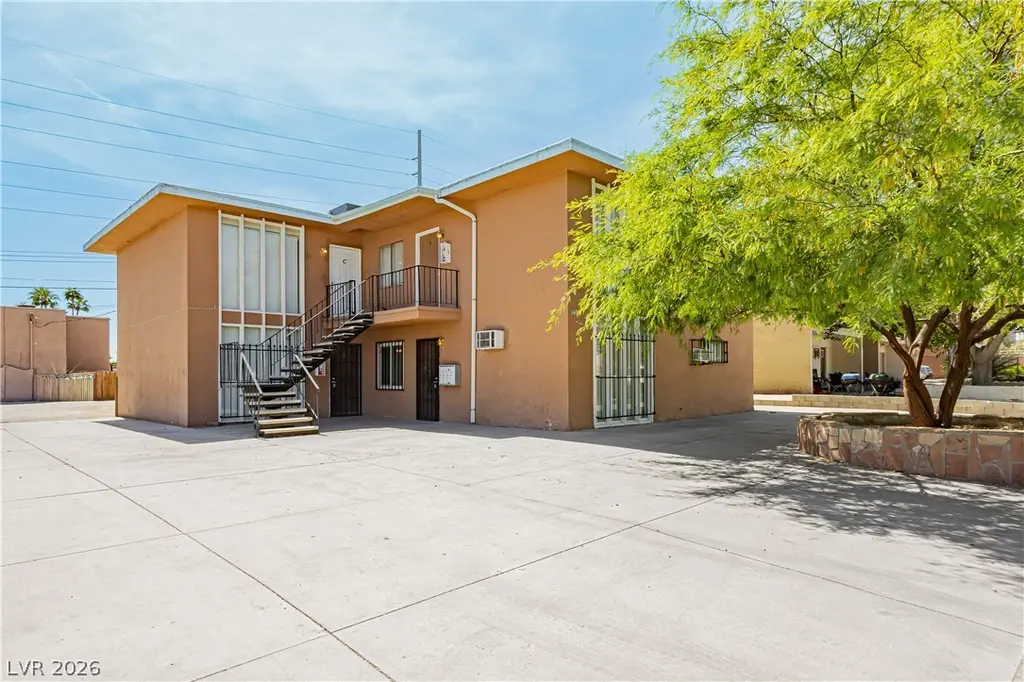
1409 Sombrero Dr · Winchester, NV
Flood risk 1/10 · Minimal
- FEMA flood zone
- X (unshaded)
- Chance of flooding over 30 yrs
- 0.0%
- Est. flood insurance / yr
- $507 – $1,088
Fire risk 1/10 · Minimal
- Est. fire insurance / yr
- $490 – $910
Heat risk 8/10 · Major
- Hot days now (above 107°F)
- 7 days/yr
- Hot days in 30 yrs
- 17 days/yr
Wind risk 1/10 · Minimal
- Chance of severe wind over 30 yrs
- —
Air-quality risk 3/10 · Minor
- Unhealthy air days now
- 3 days/yr
- Unhealthy air days in 30 yrs
- 4 days/yr
Risk factors via First Street. Map © Google.
Why this score? — see what drove the C+ grade
The composite is a weighted blend of 9 inputs, each scored 0–100. Each bar is that input's sub-score; the figure is the points it added to the 100-point composite (weight × sub-score).
- Cash flow +28.4/30.0
- DSCR +10.0/10.0
- ARV discount +7.5/15.0
- 1% rule +6.6/10.0
- Livability +4.0/5.0
- Schools +2.6/10.0
- Condition / age +2.5/5.0
- Rent growth +1.4/5.0
- Appreciation +0.0/10.0
$649,999
🖨 Deal sheet 📄 Offer letter ✓ Due diligence
Multi-family units
County records classify this as Multi-Family (2-4 Unit). Listing-text estimate: 4 units. confirmed
Listing remarks MLS
FOURPLEX IN GREAT CONDITION W/ LONGTERM TENANTS IN PLACE! ONE 3 BEDROOM AND 3 -2 BEDROOM UNITS. CLOSE TO LAS VEGAS STRIP, MAJOR EMPLOYMENT CENTERS, SUNRISE HOSPITAL AND PUBLIC TRANSPORTATION. UNITS FEATURE TILE FLOORING & EACH KITCHEN COMES WITH A DISPOSAL, GLASS FLAT TOP GE ELECTRIC STOVE AND REFRIGERATOR. PLENTY OF ON SITE PARKING!
Key facts
- Brand new hvac units
- Sewer cipp lining
- Tile flooring
Tags
Neighborhood map
What this means for you Summary
Snapshot
- This is a 3×2bd/1.5ba + 1×3bd/1.5ba units multifamily listed at $650k.
Deal economics
- At list price, monthly cash flow is $2k ($25k/yr) — positive. Per door: $527/mo.
- The deal already cash-flows at list — no discount required.
- Meets the 1% rule at list price ($8k rent vs $650k).
Location & tenants
- Location reads 79/100 on livability (#3 in NV, #2,272 nationally) — a middle-class / working-renter tenant base. Strengths: commute A+, cost of living A+, housing A+; Watch: crime F, employment D-.
- Clark County School District (urban): math 21% / reading 39% proficiency, ranked #11 of 17 in NV (top 65%) — families likely to look elsewhere, expect single-tenant / working-renter base with shorter leases.
- Market conditions: Rents falling (-4.4%/yr); 178 active listings in the ZIP; lower-income renter base — watch delinquency; 14,754 units permitted in Clark County in 2024 (2,301 in 5+ unit buildings).
- At $7,516/mo this rent would consume 220% of the median local household income ($41k/yr) (locally 2744% of renters already pay >50% of income on rent) — very limited rent-growth headroom before tenants either downsize or default.
Forward outlook
- Local home prices are declining (-3.0%/yr); year-one equity from $4k of loan paydown is wiped out by about $20k of value loss. Plan a longer hold.
- Clark County population projected at +36% by 2050 — long-run rental-demand tailwind backs the buy-and-hold thesis.
Negotiation context
- Only 10 days on market — expect competitive offers; lowballing is unlikely to land.
- 4 sale attempts since 16y ago with the ask held roughly flat each time — persistent listings suggest the price (not the market) is what's stuck; bring a comps-based counter.
- Current owner paid $220k; list at $650k implies a 195% gain — meaningful room to come down on a strong offer.
Risks & watch-outs
- Climate carrying-cost: extreme-heat days projected 7→17/yr by 2055 (HVAC capex compounding) — expect insurance premiums to compound above CPI over the hold.
Questions for the listing agent
- Can we see the unit-by-unit rent roll, current vacancy, and any below-market leases? What's the average tenancy length?
- What capital expenditures (roof, boiler, parking lot, exteriors) have been made in the last 5 years, and what's planned in the next 2?
- Built in 1963 — when were the roof, HVAC, electrical panel, plumbing, and water heater last replaced?
- Is there a deadline driving the sale (1031 exchange, divorce, estate, relocation)? That informs how much negotiation room exists.
- Crime grade is F in this area — have there been break-ins, vandalism, or insurance claims at this property in the last 3 years? What carrier currently insures it and at what premium?
- What's the average days-on-market for RENTAL listings here right now (not sales)? A rising rental-DOM trend means longer vacancies and softer asking-rent achievability than the comps imply.
- What's the recent tenant-quality profile in this submarket — average credit score on applications, eviction rate, late-payment / NSF rate, and stable-employment percentage? A property-management company in the area should have these aggregated.
- How much new apartment / multifamily construction is in the pipeline within 1–3 miles? Heavy new supply (>2% of stock underway) typically softens rents 12–24 months out; light construction supports rent growth.
Investment metrics
- 1% rule
- 1.16% ✓
- Cap rate
- 10.18%
- Cash-on-cash
- 13.89%
- DSCR
- 1.62
- GRM
- 7.2
CMA / ARV
No comps found within radius.
Projected returns pro-forma
-3.0% appreciation · 0.0% rent growth · sell at horizon
- IRR
- 1.0%
- Equity multiple
- 1.04×
- Total profit
- $6,568
- Equity at exit
- $96,917
- IRR
- 7.6%
- Equity multiple
- 1.51×
- Total profit
- $92,229
- Equity at exit
- $56,200
Cash invested: $182,000 (down + closing). Projections, not guarantees.
Landlord ↔ Tenant lean methodology
- Overall (STATE)
- 71 Landlord-Friendly
- State Nevada
- 71 Landlord-Friendly · R+1
- County
- — inherits STATE
- City
- — inherits STATE
ZIP-level market 89169
- Home prices YoY
- -33.4%
- Rents YoY
- -4.4%
- Active inventory
- 178
- Price-to-rent
- 29.3×
Monthly cashflow live
- Estimated rent
- $7,516 high interval (Pro) →
- Mortgage (P&I)
- −$3,409
- Tax from tax record
- −$151 /mo · $1,810/yr
- Insurance
- −$271
- HOA
- −$0
- Vacancy / Maint / Mgmt
- −$1,578
- Net cashflow
- $2,107
Break-even live
4-unit breakdown (identical units grouped — click to expand)
| Units | Beds | Baths | Est. rent |
|---|---|---|---|
| 3× units | 2 | 1.5 | $5,544 |
| #1 | 2 | 1.5 | $1,848 |
| #2 | 2 | 1.5 | $1,848 |
| #3 | 2 | 1.5 | $1,848 |
| 1× unit | 3 | 1.5 | $1,973 |
| Total (4 units) | $7,516 | ||
UW: 25.0% down · 7.5% · 30yr · 1.5% tax · 5.0% vac · 8.0% maint · 8.0% mgmt
Financing live
Cash to close
- Down payment
- $162,500
- Closing costs
- $19,500
- Reserves months
- —
- Total cash needed
- —
Loan-product check · same deal, 3 products live
Conventional
25% down · 7.5% · 30yr
- Down + closing
- —
- Monthly P&I
- —
- Monthly cashflow
- —
- DSCR
- —
- Eligible?
- —
Personal DTI + credit; lowest rate.
DSCR
20% down · 8.5% · 30yr
- Down + closing
- —
- Monthly P&I
- —
- Monthly cashflow
- —
- DSCR
- —
- Eligible?
- —
No personal income docs; deal must DSCR.
Hard money
10% down · 12.0% · 12mo
- Down + closing
- —
- Monthly P&I
- —
- Monthly cashflow
- —
- DSCR
- —
- Eligible?
- —
Short-term bridge; refi at stabilization.
Listing history 16 events
-
2026-04-24status Pending
-
2026-04-14$649,999 Active
-
2026-01-05status Pending
-
2025-11-24price $635,000
-
2025-10-08$650,000 Active
-
2015-03-20soldstatus $220,000 Sold 341-char remark
Show marketing remark (341 chars)
FOURPLEX IN GREAT CONDITION W/ LONGTERM TENANTS IN PLACE! ONE 3 BEDROOM AND 3 -2 BEDROOM UNITS. CLOSE TO LAS VEGAS STRIP, MAJOR EMPLOYMENT CENTERS, SUNRISE HOSPITAL AND PUBLIC TRANSPORTATION. UNITS FEATURE TILE FLOORING & EACH KITCHEN COMES WITH A DISPOSAL, GLASS FLAT TOP GE ELECTRIC STOVE AND REFRIGERATOR. PLENTY OF ON SITE PARKING!
-
2015-02-13historical Contingent Offer 341-char remark
Show marketing remark (341 chars)
FOURPLEX IN GREAT CONDITION W/ LONGTERM TENANTS IN PLACE! ONE 3 BEDROOM AND 3 -2 BEDROOM UNITS. CLOSE TO LAS VEGAS STRIP, MAJOR EMPLOYMENT CENTERS, SUNRISE HOSPITAL AND PUBLIC TRANSPORTATION. UNITS FEATURE TILE FLOORING & EACH KITCHEN COMES WITH A DISPOSAL, GLASS FLAT TOP GE ELECTRIC STOVE AND REFRIGERATOR. PLENTY OF ON SITE PARKING!
-
2015-02-06$225,000 Exclusive Right 341-char remark
Show marketing remark (341 chars)
FOURPLEX IN GREAT CONDITION W/ LONGTERM TENANTS IN PLACE! ONE 3 BEDROOM AND 3 -2 BEDROOM UNITS. CLOSE TO LAS VEGAS STRIP, MAJOR EMPLOYMENT CENTERS, SUNRISE HOSPITAL AND PUBLIC TRANSPORTATION. UNITS FEATURE TILE FLOORING & EACH KITCHEN COMES WITH A DISPOSAL, GLASS FLAT TOP GE ELECTRIC STOVE AND REFRIGERATOR. PLENTY OF ON SITE PARKING!
-
2010-06-01soldstatus $114,800
-
2010-06-01historical
-
2010-04-27$94,000
-
2007-01-05soldstatus $410,000
-
2000-01-05soldstatus $196,500
-
1989-05-17soldstatus $150,000
-
1987-08-21soldstatus $117,000
-
1986-11-20soldstatus $191,145
ⓘ Source: listings_history table (triggers on properties + properties_extension) + one-shot
backfill from property_details.listing_events for pre-trigger history.
Tax reassessment forecast NV · Resets to sale price
- Current annual tax
- $1,810 · $151/mo
- Projected year-2 tax
- $3,835 · $320/mo
- Expected delta
- +$2,025/yr (+$169/mo · 111.9%)
ⓘ Screening estimate from a state-policy table — verify with the county assessor before closing.
Climate risk First Street
- Flood 1/10 Low FEMA zone X (unshaded) · 0% chance over 30 yrs
- Wildfire 1/10 Low
- Heat 8/10 Severe 7 d/yr ≥107°F today · 17 d/yr by 30 yrs out
- Wind 1/10 Low
- Air quality 3/10 Moderate 3 unhealthy d/yr today · 4 by 30 yrs out
Nearby sold comps map
Loading sold comps map…
Walkable amenities ~0.75 mi
Loading nearby amenities…
Taxation est. · year 1
- Rental income
- $90,192
- − Mortgage interest
- −$36,410
- − Property taxes
- −$1,810
- − Insurance
- −$3,250
- − Repairs & maintenance
- −$7,215
- − Management
- −$7,215
- − Depreciation
- −$18,909
- Taxable income
- $15,382
- Est. tax owed @ 24.0%
- −$3,692
- After-tax cash flow
- $21,596/yr
For passive investors: Depreciation is non-cash, so a rental often shows a tax loss while cash-flowing — sheltering income. Rental losses are passive: they offset passive income freely, and up to $25,000/yr can offset ordinary (W-2) income if you actively participate and your MAGI is under $100k (phasing out to $0 by $150k); unused losses carry forward. On sale, claimed depreciation is recaptured at up to 25%, and gains may owe capital-gains tax (a 1031 exchange can defer both). Figures are a year-1 estimate at your 24.0% rate — not tax advice; consult a CPA.
Schools (NCES district)
- District
- Clark County School District
- NCES district ID
- 3200060
- Math proficiency
- 21% ▼ -13.00%
- Reading proficiency
- 39% ▼ -8.00%
- Median HH income
- $53,611
- Composite
- 26.48/100
- National rank
- #7211
- State rank
- #11 of 17 in NV
Livability — Winchester
- Score
- 79/100
- State rank
- #3
- US rank
- #2272
Category grades
Schools grade is shown separately in the Schools card above.
Census & demographics
- Census place
- Winchester, NV
- County
- Clark County · 2,306,105 people
- City population
- 39,883
- Metro
- Las Vegas-Henderson-Paradise, NV
- Population (ZIP)
- 22,171
- Household income
- $40,904
- Rent vs Own
- Severe rent burden
- 2744.0
Population outlook (Clark County) Hauer SSP2
- Today (2025)
- 2,504,101 people
- By 2030
- 2,693,770 · +7.6%
- By 2040
- 3,061,208 · +22.2%
- By 2050
- 3,400,072 · +35.8%
- By 2075
- 4,139,522 · +65.3%
- By 2100
- 4,596,916 · +83.6%
Race, ethnicity, and origin ACS 2023
- Neighborhood character
- Highly diverse neighborhood (Simpson 0.74)
- Race & ethnicity
- Hispanic / Latino 33% White 30% Black 23% Two or more races 13% Asian 9% Native American 2%
- Hispanic origin (detail)
- Mexican 21% Cuban 5%
- Common ancestry
- Iranian 1% Italian 1% Slovak 1%
- Foreign-born
- 30% · Canada, China
- Languages at home
- 59% English-only · Spanish 27% Tagalog/Filipino 4% Other Asian/Pacific 3%
Political lean MEDSL · Clark
- 2024 margin
- Toss-up / Even · D 50.4% · R 47.8% · Other 1.7%
- 2008→2024 swing
- -16.5pp toward R · 2008: 19.1pp · 2024: 2.6pp
- All cycles
- 2024: D+2.6 2020: D+9.3 2016: D+10.7 2012: D+14.5 2008: D+19.1
Not yet ingested
- Civics
- —
Market trends
- HPI YoY
- ▼ -136.91%
- Current HPI
- 272.6449
- Rent YoY
- ▼ -4.43%
- Metro
- Las Vegas-Henderson-Paradise, NV
- State GDP YoY
- ▲ 3.08%
- F500 in state
- 6
Industry mix (Fortune 500 HQ in NV)
| Industry | F500 HQs | Revenue |
|---|---|---|
| Hotels / Casinos | 3 | $36B |
|
||
Price history
+240.1% since first listed16 events — show timeline
- 2026-04-24 Pending — GLVAR
- 2026-04-14 Listed $649,999 GLVAR
- 2026-01-05 Pending — GLVAR
- 2025-11-24 Price Changed $635,000 GLVAR
- 2025-10-08 Listed $650,000 GLVAR
- 2015-03-20 Sold (MLS) $220,000 GLVAR
- 2015-02-13 Contingent — GLVAR
- 2015-02-06 Listed $225,000 GLVAR
- 2010-06-01 Listing Removed — GLVAR
- 2010-06-01 Sold (MLS) $114,800 GLVAR
- 2010-04-27 Listed $94,000 GLVAR
- 2007-01-05 Sold (Public Records) $410,000 Public Records
- 2000-01-05 Sold (Public Records) $196,500 Public Records
- 1989-05-17 Sold (Public Records) $150,000 Public Records
- 1987-08-21 Sold (Public Records) $117,000 Public Records
- 1986-11-20 Sold (Public Records) $191,145 Public Records
Property tax history
+0.2%/yrLatest (2025): $1,810 · +7.8% YoY. Source: county tax records.
Cash-flow waterfall
monthlySold comps — $/sqft
last 12 mo · ≤1 miLoading sold comps…