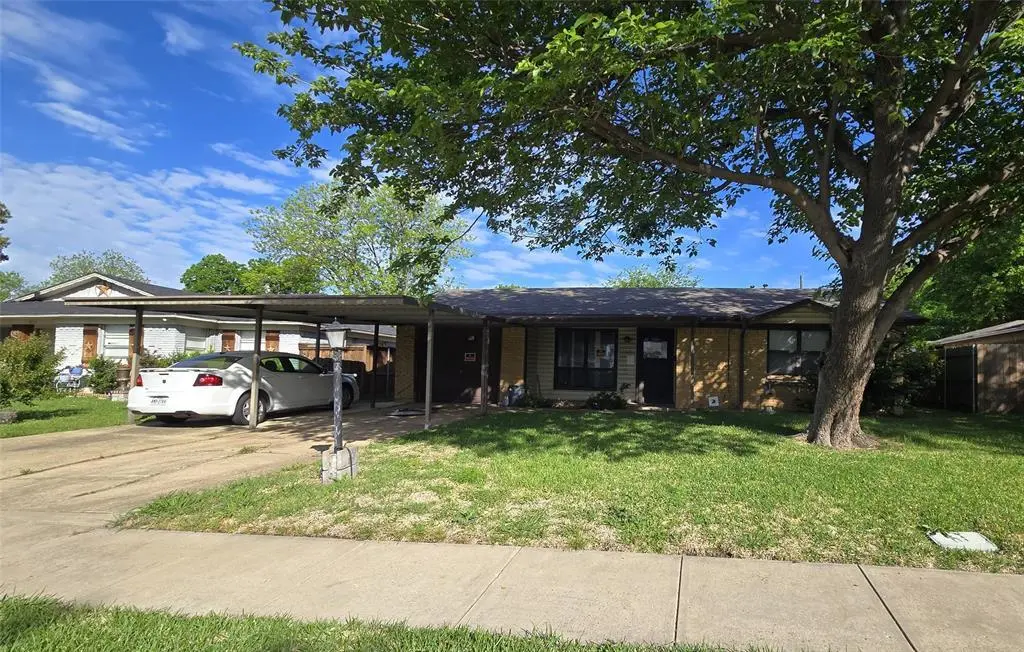
3709 Susan Dr · Mesquite, TX
Flood risk 1/10 · Minimal
- FEMA flood zone
- X (unshaded)
- Chance of flooding over 30 yrs
- 0.0%
- Est. flood insurance / yr
- $507 – $1,088
Fire risk 1/10 · Minimal
- Est. fire insurance / yr
- $1,222 – $2,270
Heat risk 7/10 · Major
- Hot days now (above 109°F)
- 7 days/yr
- Hot days in 30 yrs
- 25 days/yr
Wind risk 6/10 · Moderate
- Chance of severe wind over 30 yrs
- 27.0%
Air-quality risk 2/10 · Minimal
- Unhealthy air days now
- 2 days/yr
- Unhealthy air days in 30 yrs
- 2 days/yr
Risk factors via First Street. Map © Google.
Why this score? — see what drove the B- grade
The composite is a weighted blend of 9 inputs, each scored 0–100. Each bar is that input's sub-score; the figure is the points it added to the 100-point composite (weight × sub-score).
- Cash flow +25.2/30.0
- ARV discount +15.0/15.0
- 1% rule +9.2/10.0
- DSCR +8.3/10.0
- Livability +3.5/5.0
- Schools +2.9/10.0
- Rent growth +2.6/5.0
- Condition / age +2.5/5.0
- Appreciation +0.0/10.0
$135,000
🖨 Deal sheet (PDF) 📄 Offer letter ✓ Due diligence
Listing remarks
No more showings. Offer has been selected. Thank you. Will change to pending when confirmed with title. Great investment property to fix and flip or rent. Large home with added on secondary living space. Garage has been converted to living space as well. Home is in a nice neighborhood and just needs repairs. Inspection report is included but there is no sellers disclosure since this is a probate. Newer AC and roof. Home will be sold as is no repairs. All offers will be reviewed after April 15th.
Key facts
- 6,970 sq ft lot
- 2 parking spots
- Built 1959
Neighborhood map
What this means for you Summary
Snapshot
- This is a 3-bed/1.0-bath single-family listed at $135k.
Deal economics
- At list price, monthly cash flow is $302 ($4k/yr) — positive.
- The deal already cash-flows at list — no discount required.
- Meets the 1% rule at list price ($2k rent vs $135k).
- Cap rate 9.0% vs local median 4.4% in Mesquite — top-decile yield for the area; either an underpriced asset or a hidden risk that comps aren't pricing in. Stress-test before assuming the spread holds.
Location & tenants
- Location reads 70/100 on livability (#358 in TX) — a middle-class / working-renter tenant base. Strengths: cost of living A+, housing A+, health & safety A-; Watch: crime F, commute F.
- Mesquite ISD (suburban): math 35% / reading 32% proficiency, ranked #536 of 826 in TX (top 65%) — families likely to look elsewhere, expect single-tenant / working-renter base with shorter leases; 63% free/reduced lunch — lower-income household profile, screen leases tightly.
- Zoned schools: Lawrence El (math 47% / reading 37%, grade F, #1,335 of 4,322 statewide, top 33%, 259 students, 88% FRL); Vanston Middle (math 34% / reading 27%, grade F, #1,036 of 1,662 statewide, top 63%, 827 students, 87% FRL); North Mesquite H S (math 36% / reading 34%, grade F, #954 of 1,632 statewide, top 59%, 2,087 students, 85% FRL) — zoned schools average 87% FRL vs 63% district-wide (24 pts higher); higher-poverty schools than district average — tighter screening recommended.
- Market conditions: Rents flat; 195 active listings in the ZIP; 40 comparable units currently listed for rent nearby; rentals at typical pace (median 15d on market — plan ~3-4 weeks tenant-placement turnaround); 12,577 units permitted in Dallas County in 2024 (6,829 in 5+ unit buildings).
- This rent runs 35% of the median local income ($65k/yr) — at the standard rent-burdened threshold; future hikes will face affordability resistance.
Forward outlook
- Local home prices are declining (-3.0%/yr); year-one equity from $933 of loan paydown is wiped out by about $4k of value loss. Plan a longer hold.
- Dallas County population projected at +35% by 2050 — long-run rental-demand tailwind backs the buy-and-hold thesis.
Negotiation context
- Only 10 days on market — expect competitive offers; lowballing is unlikely to land.
Risks & watch-outs
- Watch-outs: property tax is 4.0% of price; built in 1959 — expect roof / HVAC / electrical / plumbing capex.
- Climate carrying-cost: major wind risk, 27% chance of damaging wind over 30y; extreme-heat days projected 7→25/yr by 2055 (HVAC capex compounding) — expect insurance premiums to compound above CPI over the hold.
Questions for the listing agent
- Built in 1959 — when were the roof, HVAC, electrical panel, plumbing, and water heater last replaced?
- Property tax is high relative to price — has the assessment been appealed recently, and will the sale trigger a re-assessment?
- Is there a deadline driving the sale (1031 exchange, divorce, estate, relocation)? That informs how much negotiation room exists.
- Crime grade is F in this area — have there been break-ins, vandalism, or insurance claims at this property in the last 3 years? What carrier currently insures it and at what premium?
- What's the average days-on-market for RENTAL listings here right now (not sales)? A rising rental-DOM trend means longer vacancies and softer asking-rent achievability than the comps imply.
- What's the recent tenant-quality profile in this submarket — average credit score on applications, eviction rate, late-payment / NSF rate, and stable-employment percentage? A property-management company in the area should have these aggregated.
- How much new for-sale + rental construction is in the pipeline within 1–3 miles? Heavy new supply typically softens prices + rents 12–24 months out; constrained supply supports both.
Investment metrics
- 1% rule
- 1.42% ✓
- Cap rate
- 8.98%
- Cash-on-cash
- 9.58%
- DSCR
- 1.43
- GRM
- 5.9
CMA / ARV
- ARV (on-the-fly)
- $263,424
- Comps found
- 12
Show comp detail 12 sales within ~0.75 mi
| Address | Dist | Beds/Ba | Sqft | Sold | Price | $/sf | Match |
|---|---|---|---|---|---|---|---|
| 3601 Statler Dr | 0.37mi | 3/1.5 | 1,310 (-2%) | 1mo | $175,000 | $134 | 76 |
| 3432 Hilton Dr | 0.30mi | 3/2.0 | 1,255 (-7%) | 1mo | $239,900 | $191 | 70 |
| 3420 Bahamas Dr | 0.64mi | 3/1.0 | 1,312 (-2%) | 1mo | $160,000 | $122 | 66 |
| 3517 Gray Dr | 0.34mi | 3/1.5 | 1,190 (-12%) | 2mo | $168,000 | $141 | 62 |
| 8905 La Prada Dr | 0.65mi | 3/2.5 | 1,352 (+1%) | 2mo | $275,000 | $203 | 61 |
| 3332 Sidney Dr | 0.61mi | 4/2.0 (+1) | 1,319 (-2%) | 0mo | $285,000 | $216 | 59 |
| 3416 Moon Dr | 0.47mi | 3/1.5 | 1,200 (-11%) | 2mo | $235,000 | $196 | 57 |
| 9005 La Prada Dr | 0.67mi | 3/2.0 | 1,392 (+4%) | 5mo | $285,000 | $205 | 54 |
| 4213 Motley Dr | 0.72mi | 4/2.0 (+1) | 1,312 (-2%) | 2mo | $229,900 | $175 | 52 |
| 3704 Sidney Dr | 0.51mi | 3/2.0 | 1,480 (+10%) | 5mo | $295,000 | $199 | 51 |
| 4227 Harvey Dr | 0.74mi | 4/2.0 (+1) | 1,265 (-6%) | 3mo | $250,000 | $198 | 44 |
| 3419 Palm Dr | 0.73mi | 4/3.0 (+1) | 1,428 (+6%) | 3mo | $254,999 | $179 | 40 |
Match score weights: distance 35% · size 25% · config 20% · recency 20%. Top-matched comps best support the ARV.
Projected returns pro-forma
-3.0% appreciation · 0.4% rent growth · sell at horizon
- IRR
- -5.4%
- Equity multiple
- 0.81×
- Total profit
- $-7,347
- Equity at exit
- $20,129
- IRR
- 0.0%
- Equity multiple
- 1.00×
- Total profit
- $90
- Equity at exit
- $11,672
Cash invested: $37,800 (down + closing). Projections, not guarantees.
Landlord ↔ Tenant lean methodology
- Overall (STATE)
- 87 Strongly Landlord-Friendly
- State Texas
- 87 Strongly Landlord-Friendly · R+5
- County
- — inherits STATE
- City
- — inherits STATE
ZIP-level market 75150
- Home prices YoY
- -33.8%
- Rents YoY
- 0.4%
- Active inventory
- 195
- Price-to-rent
- 5.9×
Monthly cashflow live
- Estimated rent
- $1,923 high interval (Pro) →
- Mortgage (P&I)
- −$708
- Tax from tax record
- −$453 /mo · $5,434/yr
- Insurance
- −$56
- HOA
- −$0
- Vacancy / Maint / Mgmt
- −$404
- Net cashflow
- $302
Break-even live
Sensitivity live
| Price | -10% $378 | -5% $340 | +0% $302 | +5% $264 | +10% $225 |
|---|---|---|---|---|---|
| Rent | -10% $150 | -5% $226 | +0% $302 | +5% $378 | +10% $454 |
| Rate | -1.0pp $370 | -0.5pp $336 | base $302 | +0.5pp $267 | +1.0pp $231 |
UW: 25.0% down · 7.5% · 30yr · 1.5% tax · 5.0% vac · 8.0% maint · 8.0% mgmt
Financing live
Cash to close
- Down payment
- $33,750
- Closing costs
- $4,050
- Reserves months
- —
- Total cash needed
- —
Loan-product check · same deal, 3 products live
Conventional
25% down · 7.5% · 30yr
- Down + closing
- —
- Monthly P&I
- —
- Monthly cashflow
- —
- DSCR
- —
- Eligible?
- —
Personal DTI + credit; lowest rate.
DSCR
20% down · 8.5% · 30yr
- Down + closing
- —
- Monthly P&I
- —
- Monthly cashflow
- —
- DSCR
- —
- Eligible?
- —
No personal income docs; deal must DSCR.
Hard money
10% down · 12.0% · 12mo
- Down + closing
- —
- Monthly P&I
- —
- Monthly cashflow
- —
- DSCR
- —
- Eligible?
- —
Short-term bridge; refi at stabilization.
Rent comps 40 comps
| Address | Beds | Baths | Sqft | Rent | $/sqft | DOM | Units | Dist |
|---|---|---|---|---|---|---|---|---|
| 3532 Hilton Dr Mesquite, TX | 3.0 | 1.5 | 1216 | $1,690 | $1.39 | 4d | 1 | 0.26mi |
| 3532 Hilton Dr Mesquite, TX | 3.0 | 1.5 | 1216 | $1,690 | $1.39 | 0d | 1 | 0.26mi |
| 3622 Gray Dr Mesquite, TX | 3.0 | 2.0 | 1786 | $2,200 | $1.23 | 9d | 1 | 0.29mi |
| 3315 Kensington Dr Mesquite, TX | 3.0 | 2.0 | 1641 | $1,900 | $1.16 | 45d | 1 | 0.39mi |
| 3500 Statler Dr Mesquite, TX | 3.0 | 2.0 | 1557 | $1,895 | $1.22 | 26d | 1 | 0.41mi |
| 3404 Gray Dr Mesquite, TX | 4.0 | 2.0 | 1516 | $2,150 | $1.42 | 14d | 1 | 0.42mi |
| 3531 Bonita Vista Cir Mesquite, TX | 4.0 | 2.0 | 1358 | $1,950 | $1.44 | 26d | 1 | 0.47mi |
| 3531 Bonita Vista Cir Mesquite, TX | 4.0 | 2.0 | 1358 | $1,950 | $1.44 | 14d | 1 | 0.47mi |
| 3110 Berkshire Dr Mesquite, TX | 3.0 | 2.0 | 1755 | $2,038 | $1.16 | 0d | 1 | 0.52mi |
| 3412 Beth Dr Mesquite, TX | 3.0 | 1.0 | 1148 | $1,795 | $1.56 | 45d | 1 | 0.52mi |
| 3206 Heather Glen Dr Mesquite, TX | 4.0 | 2.0 | 1708 | $4,800 | $2.81 | 0d | 1 | 0.52mi |
| 3703 Byrd Dr Mesquite, TX | 3.0 | 1.5 | 1702 | $2,150 | $1.26 | 4d | 1 | 0.53mi |
| 3520 Sidney Dr Mesquite, TX | 4.0 | 3.0 | 1400 | $2,150 | $1.54 | 45d | 1 | 0.54mi |
| 3008 Scottsbluff Dr Dallas, TX | 4.0 | 2.0 | 1220 | $2,200 | $1.80 | 21d | 1 | 0.58mi |
| 3720 Oates Dr Mesquite, TX | 1.0–2.0 | 1.0–2.0 | 878 | $1,358 | $1.55 | 26d | 2 | 0.63mi |
| 3512 Bahamas Dr Mesquite, TX | 3.0 | 2.0 | 1455 | $1,795 | $1.23 | 26d | 1 | 0.67mi |
| 3512 Bahamas Dr Mesquite, TX | 3.0 | 2.0 | 1455 | $1,795 | $1.23 | 13d | 1 | 0.67mi |
| 3512 Bahamas Dr Mesquite, TX | 3.0 | 2.0 | 1455 | $1,750 | $1.20 | 0d | 1 | 0.67mi |
| 8411 La Prada Dr Dallas, TX | 1.0–3.0 | 1.0–2.0 | 825 | $1,305 | $1.58 | 1d | 24 | 0.72mi |
| 8383 La Prada Dr Dallas, TX | 1.0–2.0 | 1.0–2.0 | 910 | $1,545 | $1.70 | 1d | 9 | 0.78mi |
| 8702 Shiloh Rd Dallas, TX | 2.0–4.0 | 1.0–2.0 | 1070 | $1,592 | $1.49 | 45d | 1 | 0.84mi |
| 2900 Aiden Ln Mesquite, TX | 3.0 | 2.5 | 1627 | $2,150 | $1.32 | 0d | 1 | 0.88mi |
| 2729 Lockhart Ave Unit NA Dallas, TX | 3.0 | 2.0 | 1238 | $2,300 | $1.86 | 26d | 1 | 0.89mi |
| 2729 Lockhart Ave Dallas, TX | 3.0 | 2.0 | 1238 | $2,300 | $1.86 | 20d | 1 | 0.89mi |
| 3022 Larry Dr Dallas, TX | 3.0 | 2.0 | 1125 | $1,949 | $1.73 | 3d | 1 | 0.92mi |
| 3253 Millmar Dr Dallas, TX | 3.0 | 2.0 | 1268 | $1,795 | $1.42 | 19d | 1 | 0.94mi |
| 4313 Flamingo Way Mesquite, TX | 3.0 | 2.0 | 1482 | $2,200 | $1.48 | 9d | 1 | 0.94mi |
| 4244 Flamingo Way Mesquite, TX | 3.0 | 2.0 | 1500 | $2,150 | $1.43 | 45d | 1 | 0.96mi |
| 2605 John West Rd Dallas, TX | 2.0–3.0 | 2.0 | 1025 | $1,396 | $1.36 | 1d | 11 | 0.96mi |
| 4228 Flamingo Way Mesquite, TX | 3.0 | 2.0 | 1240 | $1,898 | $1.53 | 45d | 1 | 0.99mi |
| 4437 Scottsdale Dr Mesquite, TX | 4.0 | 3.0 | 1300 | $1,950 | $1.50 | 5d | 1 | 1.01mi |
| 2539 Hillsboro Ave Dallas, TX | 3.0 | 1.5 | 1438 | $1,800 | $1.25 | 45d | 1 | 1.01mi |
| 2523 Gross Rd Dallas, TX | 3.0 | 1.0 | 1025 | $1,650 | $1.61 | 45d | 1 | 1.02mi |
| 2938 Healey Dr Dallas, TX | 3.0 | 2.0 | 1400 | $2,095 | $1.50 | 45d | 1 | 1.03mi |
| 2626 John West Rd Mesquite, TX | 1.0–3.0 | 1.0–2.0 | 885 | $1,557 | $1.76 | 1d | 17 | 1.05mi |
| 2506 Hillsboro Ave Dallas, TX | 4.0 | 1.5 | 1234 | $2,200 | $1.78 | 23d | 1 | 1.08mi |
| 3511 Casa Ridge Dr Mesquite, TX | 4.0 | 1.5 | 1276 | $1,759 | $1.38 | 9d | 1 | 1.12mi |
| 3718 Gus Thomasson Rd Mesquite, TX | 1.0–2.0 | 1.0–2.0 | 752 | $1,515 | $2.01 | 0d | 44 | 1.13mi |
| 2808 Belhaven Dr Mesquite, TX | 3.0 | 1.5 | 1199 | $1,695 | $1.41 | 3d | 1 | 1.14mi |
| 2346 Hillsboro Ave Dallas, TX | 3.0 | 2.0 | 1226 | $1,900 | $1.55 | 9d | 1 | 1.19mi |
Listing history 2 events
-
2026-04-18status Pending
-
2026-04-08$135,000 Active
ⓘ Source: listings_history table (triggers on properties + properties_extension) + one-shot
backfill from property_details.listing_events for pre-trigger history.
Tax reassessment forecast TX · Resets to sale price
- Current annual tax
- $5,434 · $453/mo
- Projected year-2 tax
- $5,434 · $453/mo
- Expected delta
- $0/yr ($0/mo · 0.0%)
ⓘ Screening estimate from a state-policy table — verify with the county assessor before closing.
Climate risk First Street
- Flood 1/10 Low FEMA zone X (unshaded) · 0% chance over 30 yrs
- Wildfire 1/10 Low
- Heat 7/10 Severe 7 d/yr ≥109°F today · 25 d/yr by 30 yrs out
- Wind 6/10 Major 27% chance of damaging wind over 30 yrs
- Air quality 2/10 Low 2 unhealthy d/yr today · 2 by 30 yrs out
Nearby sold comps map
Loading sold comps map…
Walkable amenities ~0.75 mi
Loading nearby amenities…
Taxation est. · year 1
- Rental income
- $23,073
- − Mortgage interest
- −$7,562
- − Property taxes
- −$5,434
- − Insurance
- −$675
- − Repairs & maintenance
- −$1,846
- − Management
- −$1,846
- − Depreciation
- −$3,927
- Taxable income
- $1,782
- Est. tax owed @ 24.0%
- −$428
- After-tax cash flow
- $3,195/yr
For passive investors: Depreciation is non-cash, so a rental often shows a tax loss while cash-flowing — sheltering income. Rental losses are passive: they offset passive income freely, and up to $25,000/yr can offset ordinary (W-2) income if you actively participate and your MAGI is under $100k (phasing out to $0 by $150k); unused losses carry forward. On sale, claimed depreciation is recaptured at up to 25%, and gains may owe capital-gains tax (a 1031 exchange can defer both). Figures are a year-1 estimate at your 24.0% rate — not tax advice; consult a CPA.
Schools (NCES district)
- District
- Mesquite ISD
- NCES district ID
- 4830390
- Math proficiency
- 35% ▼ -11.00%
- Reading proficiency
- 32% ▼ -7.00%
- Median HH income
- $49,372
- Composite
- 29.06/100
- National rank
- #6606
- State rank
- #536 of 826 in TX
Livability — Mesquite
- Score
- 70/100
- State rank
- #358
- US rank
- #7743
Category grades
Schools grade is shown separately in the Schools card above.
Census & demographics
- Census place
- Mesquite, TX
- County
- Dallas County · 2,612,404 people
- City population
- 150,788
- Metro
- Dallas-Fort Worth-Arlington, TX
- Population (ZIP)
- 62,738
- Household income
- $65,440
- Rent vs Own
- Severe rent burden
- 3609.0
Population outlook (Dallas County) Hauer SSP2
- Today (2025)
- 2,979,839 people
- By 2030
- 3,191,823 · +7.1%
- By 2040
- 3,619,611 · +21.5%
- By 2050
- 4,026,915 · +35.1%
- By 2075
- 4,957,073 · +66.4%
- By 2100
- 5,508,725 · +84.9%
Race, ethnicity, and origin ACS 2023
- Neighborhood character
- Diverse neighborhood (Simpson 0.66)
- Race & ethnicity
- Hispanic / Latino 47% White 27% Two or more races 21% Black 21% Asian 3%
- Hispanic origin (detail)
- Mexican 42%
- Common ancestry
- Slovak 1% Lithuanian 1% Serbian 1%
- Foreign-born
- 20% · Canada, Vietnam, China
- Languages at home
- 56% English-only · Spanish 40% Other Asian/Pacific 1% Arabic 1%
Political lean MEDSL · Dallas
- 2024 margin
- Strong D (+22.2) · D 60.2% · R 38.0% · Other 1.8%
- 2008→2024 swing
- +6.9pp toward D · 2008: 15.3pp · 2024: 22.2pp
- All cycles
- 2024: D+22.2 2020: D+31.6 2016: D+26.2 2012: D+15.4 2008: D+15.3
Not yet ingested
- Civics
- —
Market trends
- HPI YoY
- ▼ -172.95%
- Current HPI
- 338.3934
- Rent YoY
- ▲ 0.40%
- Metro
- Dallas-Fort Worth-Arlington, TX
- State GDP YoY
- ▲ 3.95%
- F500 in state
- 110
Industry mix (Fortune 500 HQ in TX)
| Industry | F500 HQs | Revenue |
|---|---|---|
| Energy | 16 | $1,198B |
|
||
| Technology | 5 | $198B |
|
||
| Engineering / Construction | 4 | $72B |
|
||
| Energy Services | 3 | $60B |
|
||
| Utilities | 3 | $41B |
|
||
| Healthcare | 2 | $330B |
|
||
Price history
2 events — show timeline
- 2026-04-18 Pending — NTREIS
- 2026-04-08 Listed $135,000 NTREIS
Property tax history
+6.0%/yrLatest (2025): $5,434 · +1.1% YoY. Source: county tax records.
Cash-flow waterfall
monthlySold comps — $/sqft
last 12 mo · ≤1 miLoading sold comps…