4920 Boca Chica · Caney City, TX
Flood risk No data
- FEMA flood zone
- —
- Chance of flooding over 30 yrs
- —
- Est. flood insurance / yr
- —
Fire risk No data
- Est. fire insurance / yr
- —
Heat risk No data
- Hot days now (above threshold)
- —
- Hot days in 30 yrs
- —
Wind risk No data
- Chance of severe wind over 30 yrs
- —
Air-quality risk No data
- Unhealthy air days now
- —
- Unhealthy air days in 30 yrs
- —
Risk factors via First Street. Map © Google.
Why this score? — see what drove the B grade
The composite is a weighted blend of 9 inputs, each scored 0–100. Each bar is that input's sub-score; the figure is the points it added to the 100-point composite (weight × sub-score).
- Cash flow +28.8/30.0
- ARV discount +15.0/15.0
- DSCR +10.0/10.0
- 1% rule +8.3/10.0
- Schools +4.3/10.0
- Rent growth +2.5/5.0
- Condition / age +2.5/5.0
- Livability +2.2/5.0
- Appreciation +0.0/10.0
$180,000
🖨 Deal sheet 📄 Offer letter ✓ Due diligence
Listing remarks MLS
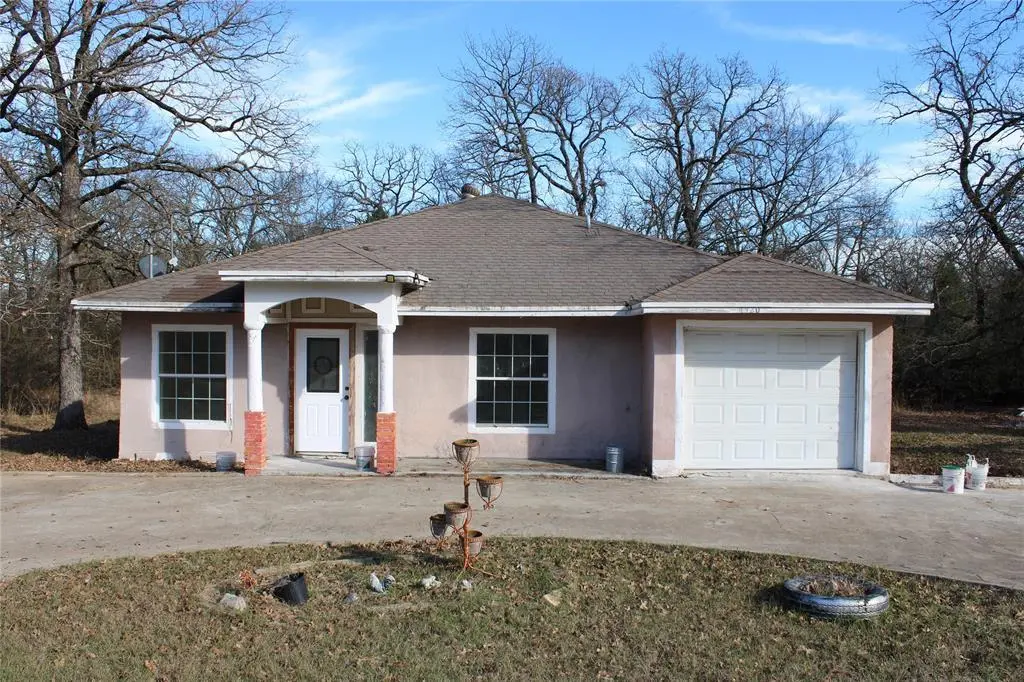
Located in the highly sought-after Point La Vista lake community, this property offers an exciting opportunity for both first-time homebuyers and investors alike. Surrounded by new construction and recently built homes, the area continues to grow in demand and value. The home has already seen extensive renovations, creating a strong foundation for its next owner. With just a few finishing touches, it can easily be customized to reflect your personal style or positioned for strong resale or rental potential. Whether you’re looking for an affordable entry into a desirable lake-area neighborhood or a value-add investment in a rapidly improving community, this property checks all the boxes. Enjoy the charm of lake-community living with the upside of ongoing development—an ideal blend of lifestyle and opportunity.
Key facts
- 5,750 sq ft lot
- Garage
- Community pool
Tags
Neighborhood map
What this means for you Summary
Snapshot
- This is a 3-bed/2.0-bath single-family listed at $180k.
Deal economics
- At list price, monthly cash flow is $607 ($7k/yr) — positive.
- The deal already cash-flows at list — no discount required.
- Meets the 1% rule at list price ($2k rent vs $180k).
- Recommended offer: $158k (12.0% below list) — sets the bar for market timing.
- Cap rate 10.3% vs local median 0.6% in Caney City — top-decile yield for the area; either an underpriced asset or a hidden risk that comps aren't pricing in. Stress-test before assuming the spread holds.
Location & tenants
- Location reads 45/100 on livability (#1,562 in TX) — a working-class tenant base; expect higher turnover. Strengths: cost of living A+, crime A; Watch: schools F, amenities F, commute F.
- Malakoff ISD (town): math 48% / reading 54% proficiency, ranked #187 of 826 in TX (top 23%) — acceptable for families but not a draw, mixed tenant base, ~2y average lease; 61% free/reduced lunch — lower-income household profile, screen leases tightly.
- Market conditions: 225 active listings in the ZIP; 1 comparable units currently listed for rent nearby; 263 units permitted in Henderson County in 2024 (0 in 5+ unit buildings).
Forward outlook
- Local home prices are declining (-3.0%/yr); year-one equity from $1k of loan paydown is wiped out by about $5k of value loss. Plan a longer hold.
- At projected returns (-3.0% appreciation + 3.0% rent growth), your $50k cash investment doubles in ~9 years — after that, you're playing with house money.
Negotiation context
- It's been on market 147 days — a 12% lower offer ($158k) is reasonable based on typical stale-listing flexibility.
- 7 sale attempts since 15y ago with the ask held roughly flat each time — persistent listings suggest the price (not the market) is what's stuck; bring a comps-based counter.
Questions for the listing agent
- It's been on market 147 days. Have you received any prior offers? Is the seller open to a 12% concession, seller financing, or rate buy-down credit?
- What does the HOA fee cover, when was the last increase, and are there any pending special assessments or reserve-fund shortfalls?
- Why hasn't it sold? Are there any deal-killer items the seller is aware of (foundation, flood, title, zoning, code violations)?
- Is there a deadline driving the sale (1031 exchange, divorce, estate, relocation)? That informs how much negotiation room exists.
- Schools are F-rated, which usually means shorter tenancies and higher turnover. Who's the typical renter profile here, and what's been the actual vacancy rate?
- What's the average days-on-market for RENTAL listings here right now (not sales)? A rising rental-DOM trend means longer vacancies and softer asking-rent achievability than the comps imply.
- What's the recent tenant-quality profile in this submarket — average credit score on applications, eviction rate, late-payment / NSF rate, and stable-employment percentage? A property-management company in the area should have these aggregated.
- How much new for-sale + rental construction is in the pipeline within 1–3 miles? Heavy new supply typically softens prices + rents 12–24 months out; constrained supply supports both.
Investment metrics
- 1% rule
- 1.33% ✓
- Cap rate
- 10.34%
- Cash-on-cash
- 14.44%
- DSCR
- 1.64
- GRM
- 6.2
CMA / ARV
- ARV (median comp)
- $219,870
- List price
- $180,000
- Delta
- -18.13%
- Verdict
- UNDERPRICED
- Comps
- 20 within 1.0 mi
Show comp detail 12 sales within ~0.75 mi
| Address | Dist | Beds/Ba | Sqft | Sold | Price | $/sf | Match |
|---|---|---|---|---|---|---|---|
| 4898 Point La Vista Rd | 0.06mi | 3/2.0 | 1,520 (-1%) | 1mo | $279,000 | $184 | 94 |
| 5018 Point Lavista | 0.21mi | 3/2.0 | 1,500 (-3%) | 0mo | $274,999 | $183 | 85 |
| 221 Harris Blvd | 0.20mi | 3/2.0 | 1,361 (-12%) | 6mo | $235,000 | $173 | 66 |
| 219 Harris Blvd | 0.19mi | 3/2.0 | 1,361 (-12%) | 8mo | $240,000 | $176 | 65 |
| 14815 Goliad Dr | 0.50mi | 3/2.0 | 1,500 (-3%) | 10mo | $249,900 | $167 | 64 |
| 5530 Sam Slade Trl | 0.70mi | 3/2.0 | 1,570 (+2%) | 4mo | $249,900 | $159 | 61 |
| 286 Harris Blvd | 0.06mi | 3/2.0 | 1,350 (-12%) | 18mo | $233,000 | $173 | 61 |
| 107 Nob Hill Cir | 0.34mi | 3/2.0 | 1,672 (+8%) | 11mo | $549,000 | $328 | 61 |
| 303 Harris Blvd | 0.13mi | 3/2.0 | 1,317 (-15%) | 17mo | $229,990 | $175 | 56 |
| 5220 Point Lavista | 0.29mi | 2/3.0 (-1) | 1,648 (+7%) | 16mo | $347,500 | $211 | 53 |
| 5294 Loma Vis | 0.32mi | 3/2.0 | 1,716 (+11%) | 23mo | $275,000 | $160 | 47 |
| 5445 Point Lavista | 0.44mi | 3/2.0 | 1,769 (+15%) | 23mo | $199,500 | $113 | 36 |
Match score weights: distance 35% · size 25% · config 20% · recency 20%. Top-matched comps best support the ARV.
Projected returns pro-forma
-3.0% appreciation · 3.0% rent growth · sell at horizon
- IRR
- 4.9%
- Equity multiple
- 1.19×
- Total profit
- $9,528
- Equity at exit
- $26,839
- IRR
- 14.4%
- Equity multiple
- 2.16×
- Total profit
- $58,302
- Equity at exit
- $15,563
Cash invested: $50,400 (down + closing). Projections, not guarantees.
Landlord ↔ Tenant lean methodology
- Overall (STATE)
- 87 Strongly Landlord-Friendly
- State Texas
- 87 Strongly Landlord-Friendly · R+5
- County
- — inherits STATE
- City
- — inherits STATE
ZIP-level market 75148
- Home prices YoY
- -27.6%
- Active inventory
- 225
- Price-to-rent
- 6.2×
Monthly cashflow live
- Estimated rent
- $2,400 medium interval (Pro) →
- Mortgage (P&I)
- −$944
- Tax from tax record
- −$256 /mo · $3,066/yr
- Insurance
- −$75
- HOA
- −$15
- Vacancy / Maint / Mgmt
- −$504
- Net cashflow
- $607
Break-even live
UW: 25.0% down · 7.5% · 30yr · 1.5% tax · 5.0% vac · 8.0% maint · 8.0% mgmt
Financing live
Cash to close
- Down payment
- $45,000
- Closing costs
- $5,400
- Reserves months
- —
- Total cash needed
- —
Loan-product check · same deal, 3 products live
Conventional
25% down · 7.5% · 30yr
- Down + closing
- —
- Monthly P&I
- —
- Monthly cashflow
- —
- DSCR
- —
- Eligible?
- —
Personal DTI + credit; lowest rate.
DSCR
20% down · 8.5% · 30yr
- Down + closing
- —
- Monthly P&I
- —
- Monthly cashflow
- —
- DSCR
- —
- Eligible?
- —
No personal income docs; deal must DSCR.
Hard money
10% down · 12.0% · 12mo
- Down + closing
- —
- Monthly P&I
- —
- Monthly cashflow
- —
- DSCR
- —
- Eligible?
- —
Short-term bridge; refi at stabilization.
Rent comps 1 comps
| Address | Beds | Baths | Sqft | Rent | $/sqft | DOM | Units | Dist |
|---|---|---|---|---|---|---|---|---|
| 5320 Loma Vis Malakoff, TX | 2.0 | 2.0 | 1324 | $2,400 | $1.81 | 44d | 1 | 0.36mi |
HOA detail
- Monthly dues
- $15 · $180/yr
Listing history 30 events
-
2026-06-19days on market $180,000 Active 147 DOM
-
2026-06-18days on market $180,000 Active 146 DOM
-
2026-06-17days on market $180,000 Active 145 DOM
-
2026-06-16days on market $180,000 Active 144 DOM
-
2026-06-15days on market $180,000 Active 143 DOM
-
2026-06-14days on market $180,000 Active 141 DOM
-
2026-06-12days on market $180,000 Active 140 DOM
-
2026-06-09days on market $180,000 Active 137 DOM
-
2026-06-08days on market $180,000 Active 136 DOM
-
2026-06-07days on market $180,000 Active 135 DOM
-
2026-06-02days on market $180,000 Active 130 DOM
-
2026-06-01days on market $180,000 Active 129 DOM
-
2026-05-31days on market $180,000 Active 128 DOM
-
2026-05-30days on market $180,000 Active 127 DOM
-
2026-01-23$180,000 Active 832-char remark
Show marketing remark (832 chars)
Located in the highly sought-after Point La Vista lake community, this property offers an exciting opportunity for both first-time homebuyers and investors alike. Surrounded by new construction and recently built homes, the area continues to grow in demand and value. The home has already seen extensive renovations, creating a strong foundation for its next owner. With just a few finishing touches, it can easily be customized to reflect your personal style or positioned for strong resale or rental potential. Whether you’re looking for an affordable entry into a desirable lake-area neighborhood or a value-add investment in a rapidly improving community, this property checks all the boxes. Enjoy the charm of lake-community living with the upside of ongoing development—an ideal blend of lifestyle and opportunity.
-
2026-01-22$180,000 Active 838-char remark
Show marketing remark (838 chars)
Located in the highly sought-after Point La Vista lake community, this property offers an exciting opportunity for both first-time homebuyers and investors alike. Surrounded by new construction and recently built homes, the area continues to grow in demand and value. The home has already seen extensive renovations, creating a strong foundation for its next owner. With just a few finishing touches, it can easily be customized to reflect your personal style or positioned for strong resale or rental potential. Whether you’re looking for an affordable entry into a desirable lake-area neighborhood or a value-add investment in a rapidly improving community, this property checks all the boxes. Enjoy the charm of lake-community living with the upside of ongoing development—an ideal blend of lifestyle and opportunity.
-
2024-05-06historical
-
2024-02-05$190,000 Active
-
2018-06-20historical
-
2017-12-12status Active
-
2017-12-11historical
-
2017-06-15price $90,000
-
2016-12-06$100,000 Active
-
2016-09-11historical
-
2015-07-30$124,500 Active
-
2011-12-31historical
-
2011-07-24$135,000 Active
-
2006-10-13soldstatus
-
2005-09-22soldstatus
-
1986-12-01soldstatus
ⓘ Source: listings_history table (triggers on properties + properties_extension) + one-shot
backfill from property_details.listing_events for pre-trigger history.
Tax reassessment forecast TX · Resets to sale price
- Current annual tax
- $3,066 · $256/mo
- Projected year-2 tax
- $3,294 · $274/mo
- Expected delta
- +$228/yr (+$19/mo · 7.4%)
ⓘ Screening estimate from a state-policy table — verify with the county assessor before closing.
Nearby sold comps map
Loading sold comps map…
Walkable amenities ~0.75 mi
Loading nearby amenities…
Taxation est. · year 1
- Rental income
- $28,800
- − Mortgage interest
- −$10,083
- − Property taxes
- −$3,066
- − Insurance
- −$900
- − Repairs & maintenance
- −$2,304
- − Management
- −$2,304
- − HOA
- −$180
- − Depreciation
- −$5,236
- Taxable income
- $4,727
- Est. tax owed @ 24.0%
- −$1,134
- After-tax cash flow
- $6,144/yr
For passive investors: Depreciation is non-cash, so a rental often shows a tax loss while cash-flowing — sheltering income. Rental losses are passive: they offset passive income freely, and up to $25,000/yr can offset ordinary (W-2) income if you actively participate and your MAGI is under $100k (phasing out to $0 by $150k); unused losses carry forward. On sale, claimed depreciation is recaptured at up to 25%, and gains may owe capital-gains tax (a 1031 exchange can defer both). Figures are a year-1 estimate at your 24.0% rate — not tax advice; consult a CPA.
Schools (NCES district)
- District
- Malakoff ISD
- NCES district ID
- 4828780
- Math proficiency
- 48% ▼ -14.00%
- Reading proficiency
- 54% ▼ -5.00%
- Median HH income
- $38,970
- Composite
- 42.54/100
- National rank
- #3200
- State rank
- #187 of 826 in TX
Livability — Caney City
- Score
- 45/100
- State rank
- #1562
- US rank
- #26636
Category grades
Schools grade is shown separately in the Schools card above.
Census & demographics
- Population (ZIP)
- 5,944
Population outlook (Henderson County) Hauer SSP2
- Today (2025)
- 80,471 people
- By 2030
- 80,608 · +0.2%
- By 2040
- 80,087 · -0.5%
- By 2050
- 78,208 · -2.8%
- By 2075
- 72,423 · -10.0%
- By 2100
- 61,012 · -24.2%
Race, ethnicity, and origin ACS 2023
- Neighborhood character
- Predominantly White (71%)
- Race & ethnicity
- White 71% Two or more races 11% Hispanic / Latino 11% Black 11%
- Hispanic origin (detail)
- Mexican 10%
- Common ancestry
- Russian 2% Slovak 2% Italian 1%
- Foreign-born
- 5% · Canada
- Languages at home
- 92% English-only · Spanish 8%
Political lean MEDSL · Henderson
- 2024 margin
- Solid R (+63.5) · D 18.0% · R 81.4%
- 2008→2024 swing
- -18.8pp toward R · 2008: -44.6pp · 2024: -63.5pp
- All cycles
- 2024: R+63.5 2020: R+60.2 2016: R+60.0 2012: R+54.8 2008: R+44.6
Not yet ingested
- Civics
- —
Market trends
- HPI YoY
- ▼ -82.76%
- Current HPI
- 217.1629
- Rent YoY
- —
- Metro
- —
- State GDP YoY
- ▲ 3.95%
- F500 in state
- 110
Industry mix (Fortune 500 HQ in TX)
| Industry | F500 HQs | Revenue |
|---|---|---|
| Energy | 16 | $1,198B |
|
||
| Technology | 5 | $198B |
|
||
| Engineering / Construction | 4 | $72B |
|
||
| Energy Services | 3 | $60B |
|
||
| Utilities | 3 | $41B |
|
||
| Healthcare | 2 | $330B |
|
||
Price history
+33.3% since first listed16 events — show timeline
- 2026-01-23 Listed $180,000 GTAR
- 2026-01-22 Listed $180,000 NTREIS
- 2024-05-06 Listing Removed — NTREIS
- 2024-02-05 Listed $190,000 NTREIS
- 2018-06-20 Listing Removed — NTREIS
- 2017-12-12 Relisted — NTREIS
- 2017-12-11 Listing Removed — NTREIS
- 2017-06-15 Price Changed $90,000 NTREIS
- 2016-12-06 Listed $100,000 NTREIS
- 2016-09-11 Listing Removed — NTREIS
- 2015-07-30 Listed $124,500 NTREIS
- 2011-12-31 Listing Removed — NTREIS
- 2011-07-24 Listed $135,000 NTREIS
- 2006-10-13 Sold (Public Records) — Public Records
- 2005-09-22 Sold (Public Records) — Public Records
- 1986-12-01 Sold (Public Records) — Public Records
Property tax history
+4.5%/yrLatest (2025): $3,066 · +10.6% YoY. Source: county tax records.
Cash-flow waterfall
monthlySold comps — $/sqft
last 12 mo · ≤1 miLoading sold comps…