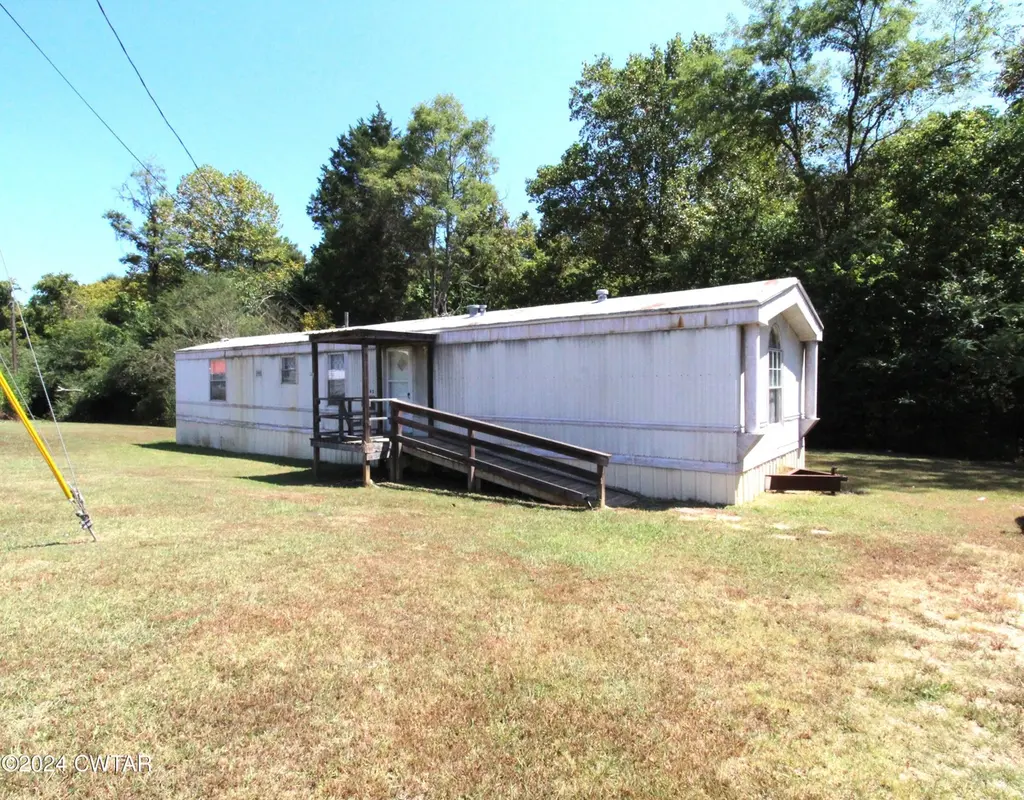
245 Bailey St · Lexington, TN
Flood risk 1/10 · Minimal
- FEMA flood zone
- X (unshaded)
- Chance of flooding over 30 yrs
- 0.0%
- Est. flood insurance / yr
- $507 – $1,088
Fire risk 4/10 · Minor
- Est. fire insurance / yr
- $949 – $1,763
Heat risk 5/10 · Moderate
- Hot days now (above 108°F)
- 7 days/yr
- Hot days in 30 yrs
- 21 days/yr
Wind risk 4/10 · Minor
- Chance of severe wind over 30 yrs
- 12.0%
Air-quality risk 1/10 · Minimal
- Unhealthy air days now
- 0 days/yr
- Unhealthy air days in 30 yrs
- 0 days/yr
Risk factors via First Street. Map © Google.
Why this score? — see what drove the B- grade
The composite is a weighted blend of 9 inputs, each scored 0–100. Each bar is that input's sub-score; the figure is the points it added to the 100-point composite (weight × sub-score).
- Cash flow +30.0/30.0
- DSCR +10.0/10.0
- 1% rule +9.6/10.0
- ARV discount +7.5/15.0
- Livability +3.4/5.0
- Rent growth +2.5/5.0
- Schools +2.4/10.0
- Condition / age +2.2/5.0
- Appreciation +0.0/10.0
$75,000
🖨 Deal sheet 📄 Offer letter ✓ Due diligence
Listing remarks
All the city convenience. .. 3BR/2BA with private back deck. Nice level lot for easy maintenance. Split BR plan with the main suite having private bath and double closets. Tile floors throughout. Call today for your private showing.
Key facts
- Tile floors
- Private back deck
- Main suite
Tags
Property features AI
Exterior
- Parking: 2 open gravel parking spaces (total 2 parking spaces)
- Utilities: Public water; Public sewer; Electricity connected; Natural gas connected / available
- Home design: Manufactured home; One level
- Construction: Metal siding; Block foundation; Metal roof; Built as a residential manufactured home
- Exterior features: Covered patio/deck and front porch; Level lot
Interior
- Kitchen: Electric cooktop
- Bedrooms: 2 bedrooms on the main level
- Flooring: Ceramic tile
- Bathrooms: 2 full bathrooms (1 on the main level)
- Heating & cooling: Natural gas heating; Central air conditioning
- Interior features: Eat-in kitchen; Open floor plan; Walk-in closets
- Laundry & utility: Washer hookup on the main level; Electric dryer hookup
Neighborhood map
What this means for you Summary
Snapshot
- This is a 3-bed/2.0-bath manufactured listed at $75k. Condition is rated fair.
Deal economics
- At list price, monthly cash flow is $350 ($4k/yr) — positive.
- The deal already cash-flows at list — no discount required.
- Meets the 1% rule at list price ($1k rent vs $75k).
- Cap rate 11.9% vs local median 2.7% in Lexington — top-decile yield for the area; either an underpriced asset or a hidden risk that comps aren't pricing in. Stress-test before assuming the spread holds.
Location & tenants
- Location reads 67/100 on livability (#96 in TN) — a middle-class / working-renter tenant base. Strengths: cost of living A+, health & safety A+, housing A-; Watch: crime D, schools F, amenities F.
- Lexington (town): math 31% / reading 26% proficiency, ranked #68 of 139 in TN (top 49%) — low school quality limits family demand, transient renter base, plan for 1-2y turnover.
- Market conditions: 158 active listings in the ZIP; 27 units permitted in Henderson County in 2024 (0 in 5+ unit buildings).
Forward outlook
- Local home prices are declining (-3.0%/yr); year-one equity from $519 of loan paydown is wiped out by about $2k of value loss. Plan a longer hold.
- Henderson County population projected at -11% by 2050 — secular population decline; favor cash flow + early exit over multi-decade hold.
- At projected returns (-3.0% appreciation + 3.0% rent growth), your $21k cash investment doubles in ~7 years — after that, you're playing with house money.
Negotiation context
- Only 9 days on market — expect competitive offers; lowballing is unlikely to land.
- 2 sale attempts since 2y ago with the ask held roughly flat each time — persistent listings suggest the price (not the market) is what's stuck; bring a comps-based counter.
Risks & watch-outs
- Climate carrying-cost: extreme-heat days projected 7→21/yr by 2055 (HVAC capex compounding) — expect insurance premiums to compound above CPI over the hold.
Questions for the listing agent
- Have any recent inspections been done? Can we get a copy of the seller's disclosures and any deferred-maintenance estimates?
- Is there a deadline driving the sale (1031 exchange, divorce, estate, relocation)? That informs how much negotiation room exists.
- Schools are F-rated, which usually means shorter tenancies and higher turnover. Who's the typical renter profile here, and what's been the actual vacancy rate?
- Crime grade is D in this area — have there been break-ins, vandalism, or insurance claims at this property in the last 3 years? What carrier currently insures it and at what premium?
- What's the average days-on-market for RENTAL listings here right now (not sales)? A rising rental-DOM trend means longer vacancies and softer asking-rent achievability than the comps imply.
- What's the recent tenant-quality profile in this submarket — average credit score on applications, eviction rate, late-payment / NSF rate, and stable-employment percentage? A property-management company in the area should have these aggregated.
- How much new for-sale + rental construction is in the pipeline within 1–3 miles? Heavy new supply typically softens prices + rents 12–24 months out; constrained supply supports both.
Investment metrics
- 1% rule
- 1.46% ✓
- Cap rate
- 11.89%
- Cash-on-cash
- 19.97%
- DSCR
- 1.89
- GRM
- 5.7
CMA / ARV
No comps found within radius.
Projected returns pro-forma
-3.0% appreciation · 3.0% rent growth · sell at horizon
- IRR
- 12.1%
- Equity multiple
- 1.48×
- Total profit
- $10,126
- Equity at exit
- $11,183
- IRR
- 21.1%
- Equity multiple
- 2.79×
- Total profit
- $37,552
- Equity at exit
- $6,485
Cash invested: $21,000 (down + closing). Projections, not guarantees.
Landlord ↔ Tenant lean methodology
- Overall (STATE)
- 87 Strongly Landlord-Friendly
- State Tennessee
- 87 Strongly Landlord-Friendly · R+13
- County
- — inherits STATE
- City
- — inherits STATE
ZIP-level market 38351
- Home prices YoY
- -10.8%
- Active inventory
- 158
- Price-to-rent
- 5.7×
Monthly cashflow live
- Estimated rent
- $1,099 medium interval (Pro) →
- Mortgage (P&I)
- −$393
- Tax est. 1.5%
- −$94 /mo · $1,125/yr
- Insurance
- −$31
- HOA
- −$0
- Vacancy / Maint / Mgmt
- −$231
- Net cashflow
- $350
Break-even live
UW: 25.0% down · 7.5% · 30yr · 1.5% tax · 5.0% vac · 8.0% maint · 8.0% mgmt
Financing live
Cash to close
- Down payment
- $18,750
- Closing costs
- $2,250
- Reserves months
- —
- Total cash needed
- —
Loan-product check · same deal, 3 products live
Conventional
25% down · 7.5% · 30yr
- Down + closing
- —
- Monthly P&I
- —
- Monthly cashflow
- —
- DSCR
- —
- Eligible?
- —
Personal DTI + credit; lowest rate.
DSCR
20% down · 8.5% · 30yr
- Down + closing
- —
- Monthly P&I
- —
- Monthly cashflow
- —
- DSCR
- —
- Eligible?
- —
No personal income docs; deal must DSCR.
Hard money
10% down · 12.0% · 12mo
- Down + closing
- —
- Monthly P&I
- —
- Monthly cashflow
- —
- DSCR
- —
- Eligible?
- —
Short-term bridge; refi at stabilization.
Listing history 8 events
-
2026-06-18days on market $75,000 Active 9 DOM
-
2026-06-17days on market $75,000 Active 8 DOM
-
2026-06-16days on market $75,000 Active 7 DOM
-
2026-06-15days on market $75,000 Active 6 DOM
-
2026-06-13days on market $75,000 Active 4 DOM
-
2026-06-12days on market $75,000 Active 3 DOM
-
2026-06-09remarks 232-char remark
-
2026-06-09$75,000 Active 1 DOM
ⓘ Source: listings_history table (triggers on properties + properties_extension) + one-shot
backfill from property_details.listing_events for pre-trigger history.
Climate risk First Street
- Flood 1/10 Low FEMA zone X (unshaded) · 0% chance over 30 yrs
- Wildfire 4/10 Moderate
- Heat 5/10 Major 7 d/yr ≥108°F today · 21 d/yr by 30 yrs out
- Wind 4/10 Moderate 12% chance of damaging wind over 30 yrs
- Air quality 1/10 Low 0 unhealthy d/yr today · 0 by 30 yrs out
Nearby sold comps map
Loading sold comps map…
Walkable amenities ~0.75 mi
Loading nearby amenities…
Taxation est. · year 1
- Rental income
- $13,183
- − Mortgage interest
- −$4,201
- − Property taxes
- −$1,125
- − Insurance
- −$375
- − Repairs & maintenance
- −$1,055
- − Management
- −$1,055
- − Depreciation
- −$2,182
- Taxable income
- $3,190
- Est. tax owed @ 24.0%
- −$766
- After-tax cash flow
- $3,429/yr
For passive investors: Depreciation is non-cash, so a rental often shows a tax loss while cash-flowing — sheltering income. Rental losses are passive: they offset passive income freely, and up to $25,000/yr can offset ordinary (W-2) income if you actively participate and your MAGI is under $100k (phasing out to $0 by $150k); unused losses carry forward. On sale, claimed depreciation is recaptured at up to 25%, and gains may owe capital-gains tax (a 1031 exchange can defer both). Figures are a year-1 estimate at your 24.0% rate — not tax advice; consult a CPA.
Condition & rehab AI · 12 photos
This manufactured home requires moderate repairs to its exterior and roof, but is otherwise in fair condition. Updates to the exterior and interior will significantly enhance its value and appeal.
Repairs flagged
- Major exterior siding — Significant rust and wear
- Major roof — Rusty metal roof
- Major exterior paint — Weathered and peeling paint
Value-add opportunities
- Both Paint exterior — Enhances curb appeal and value
- Both Replace roof — Critical for structural integrity and value
- Resale Update kitchen cabinetry — Modernizes the space and adds value
- Resale Update bathrooms — Modernizes the space and adds value
Renovation cost estimate screening
| Repair item | Severity | Est. cost |
|---|---|---|
| exterior siding · Significant rust and wear | Major | $15,000–50,000 |
| roof · Rusty metal roof | Major | $15,000–50,000 |
| exterior paint · Weathered and peeling paint | Major | $15,000–50,000 |
| Total estimated repair cost · 3 items | $45,000–150,000 |
Value-add ROI direction
- Both Paint exterior — Enhances curb appeal and value ↑
- Both Replace roof — Critical for structural integrity and value ↑
- Resale Update kitchen cabinetry — Modernizes the space and adds value ↑
- Resale Update bathrooms — Modernizes the space and adds value ↑
ⓘ Cost ranges are severity-bucket heuristics (US national rule-of-thumb). Get contractor quotes + a written scope before underwriting a rehab budget.
Schools (NCES district)
- District
- Lexington
- NCES district ID
- 4702460
- Math proficiency
- 31% ▼ -11.00%
- Reading proficiency
- 26% ▼ -6.00%
- Median HH income
- $40,428
- Composite
- 24.08/100
- National rank
- #7758
- State rank
- #68 of 139 in TN
Livability — Lexington
- Score
- 67/100
- State rank
- #96
- US rank
- #10272
Category grades
Schools grade is shown separately in the Schools card above.
Census & demographics
- Census place
- Lexington, TN
- City population
- 17,958
- Population (ZIP)
- 17,958
Population outlook (Henderson County) Hauer SSP2
- Today (2025)
- 28,057 people
- By 2030
- 27,730 · -1.2%
- By 2040
- 26,664 · -5.0%
- By 2050
- 25,081 · -10.6%
- By 2075
- 20,747 · -26.1%
- By 2100
- 15,603 · -44.4%
Race, ethnicity, and origin ACS 2023
- Neighborhood character
- Predominantly White (84%)
- Race & ethnicity
- White 84% Black 10% Two or more races 4% Hispanic / Latino 3%
- Common ancestry
- Italian 3% Serbian 1% Lithuanian 1%
- Foreign-born
- 1% · Canada
- Languages at home
- 98% English-only · Spanish 1%
Political lean MEDSL · Henderson
- 2024 margin
- Solid R (+67.9) · D 15.8% · R 83.7%
- 2008→2024 swing
- -25.0pp toward R · 2008: -42.9pp · 2024: -67.9pp
- All cycles
- 2024: R+67.9 2020: R+64.1 2016: R+62.1 2012: R+48.8 2008: R+42.9
Not yet ingested
- Civics
- —
Market trends
- HPI YoY
- ▼ -35.82%
- Current HPI
- 297.0387
- Rent YoY
- —
- Metro
- —
- State GDP YoY
- ▲ 2.78%
- F500 in state
- 22
Industry mix (Fortune 500 HQ in TN)
| Industry | F500 HQs | Revenue |
|---|---|---|
| Healthcare | 3 | $91B |
|
||
| Retail | 3 | $72B |
|
||
| Transportation / Logistics | 1 | $88B |
|
||
| Paper / Packaging | 1 | $19B |
|
||
| Insurance | 1 | $13B |
|
||
| Energy | 1 | $12B |
|
||
Price history
-40.0% since first listed4 events — show timeline
- 2026-06-09 Listed $75,000 CWTAR
- 2024-11-15 Listing Removed — REALTRACS as Distributed by MLS Grid
- 2024-09-16 Listed $125,000 REALTRACS as Distributed by MLS Grid
- 2024-09-06 Price Changed $125,000 CWTAR
Cash-flow waterfall
monthlySold comps — $/sqft
last 12 mo · ≤1 miLoading sold comps…