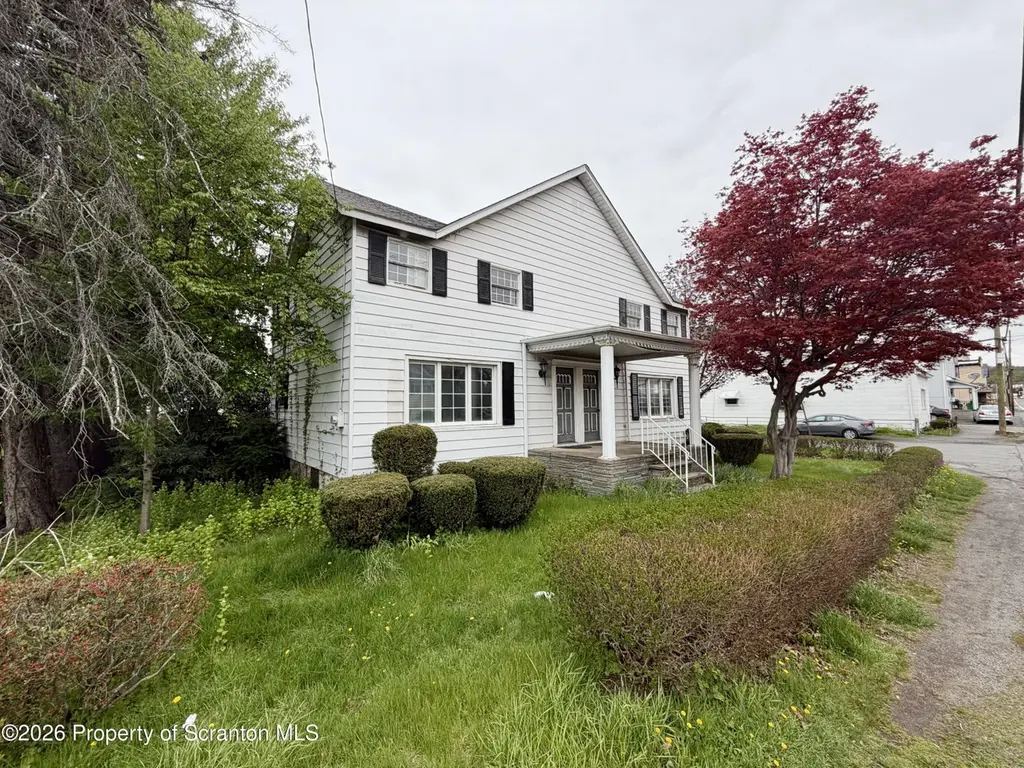
325 N Main St · Archbald, PA
Flood risk 1/10 · Minimal
- FEMA flood zone
- X (unshaded)
- Chance of flooding over 30 yrs
- 0.0%
- Est. flood insurance / yr
- $507 – $1,088
Fire risk 1/10 · Minimal
- Est. fire insurance / yr
- $511 – $949
Heat risk 3/10 · Minor
- Hot days now (above 94°F)
- 8 days/yr
- Hot days in 30 yrs
- 19 days/yr
Wind risk 2/10 · Minimal
- Chance of severe wind over 30 yrs
- 3.0%
Air-quality risk 2/10 · Minimal
- Unhealthy air days now
- 1 days/yr
- Unhealthy air days in 30 yrs
- 1 days/yr
Risk factors via First Street. Map © Google.
Why this score? — see what drove the B- grade
The composite is a weighted blend of 9 inputs, each scored 0–100. Each bar is that input's sub-score; the figure is the points it added to the 100-point composite (weight × sub-score).
- Cash flow +30.0/30.0
- DSCR +10.0/10.0
- 1% rule +9.6/10.0
- ARV discount +7.5/15.0
- Schools +3.9/10.0
- Livability +3.7/5.0
- Rent growth +2.5/5.0
- Condition / age +2.5/5.0
- Appreciation +0.0/10.0
$120,000
🖨 Deal sheet (PDF) 📄 Offer letter ✓ Due diligence
Listing remarks
Opportunity knocks in Eynon with this versatile side-by-side duplex, perfectly positioned on a rare oversized corner lot just under 15,000 sq ft. Zoned for commercial use while currently operating as a residential property, this is a unique find with multiple paths for future use. Each unit offers approximately 1,100 sq ft of living space, featuring 2 bedrooms and 1 full bath, making it well-suited for rental income, owner-occupancy, or a value-add renovation. Whether you're an investor searching for your next project, a first-time buyer looking to build equity, or a commercial buyer ready to develop on a highly visible, generously sized lot, this property delivers flexibility and potential
Key facts
- 0.34 acre lot
- Built 1930
- Listed 9 days
Property features AI
Finance
- Other: Living area reported as 2,200 above-grade finished area
- Financial info: Two total units
- HOA & community: Community features include curbs, sidewalks and street lights
Exterior
- Parking: On-street parking (see remarks)
- Utilities: Public water; Public sewer; Electricity connected with 100 amp service
- Home design: Duplex (residential income, multi-family); Two levels; Built circa 1930 (estimated); Fixer condition; 1 common wall
- Construction: Block, metal siding and concrete construction materials; Foundation of block, stone and combination; Shingle roof
- Exterior features: Private yard; Front and rear porches; Rain gutters; Back yard, level corner lot; City street frontage on a paved public road with curb, sidewalk and street lights
Interior
- Kitchen: Each unit includes a kitchen
- Bedrooms: 4 bedrooms total; Two 2-bedroom units (Unit 325 and Unit 327)
- Flooring: Hardwood; Wood
- Bathrooms: 2 full bathrooms total (one in each unit)
- Heating & cooling: Baseboard heating (oil); No central cooling
- Interior features: Hardwood and wood flooring; Full basement with walk-out access, interior and exterior entry; concrete and dirt floor
Neighborhood map
What this means for you Summary
Snapshot
- This is a 4-bed/2.0-bath single-family listed at $120k.
Deal economics
- At list price, monthly cash flow is $555 ($7k/yr) — positive.
- The deal already cash-flows at list — no discount required.
- Meets the 1% rule at list price ($2k rent vs $120k).
- Cap rate 11.8% vs local median 2.6% in Archbald — top-decile yield for the area; either an underpriced asset or a hidden risk that comps aren't pricing in. Stress-test before assuming the spread holds.
Location & tenants
- Location reads 73/100 on livability (#596 in PA) — a middle-class / working-renter tenant base. Strengths: crime A+, cost of living A+, housing A+; Watch: amenities F, commute F.
- Valley View SD (rural): math 34% / reading 57% proficiency, ranked #269 of 539 in PA (top 50%) — families likely to look elsewhere, expect single-tenant / working-renter base with shorter leases.
- Zoned schools: Valley View Intrmd Sch (math 28% / reading 60%, grade F, #858 of 1,518 statewide, top 57%, 540 students, 34% FRL); Valley View Ms (math 8% / reading 52%, grade F, #382 of 512 statewide, top 75%, 563 students, 38% FRL); Valley View Hs (math 72%, 761 students, 25% FRL) — zoned schools at 32% FRL track the district average.
- Market conditions: 69 active listings in the ZIP; 2 comparable units currently listed for rent nearby; 251 units permitted in Lackawanna County in 2024 (0 in 5+ unit buildings).
Forward outlook
- Local home prices are declining (-3.0%/yr); year-one equity from $830 of loan paydown is wiped out by about $4k of value loss. Plan a longer hold.
- Lackawanna County population projected to shrink 4% by 2050 — rents likely to lag national; underwrite the cash flow, not the appreciation.
- At projected returns (-3.0% appreciation + 3.0% rent growth), your $34k cash investment doubles in ~7 years — after that, you're playing with house money.
Negotiation context
- Only 9 days on market — expect competitive offers; lowballing is unlikely to land.
Risks & watch-outs
- Watch-outs: built in 1930 — expect roof / HVAC / electrical / plumbing capex.
Questions for the listing agent
- Built in 1930 — when were the roof, HVAC, electrical panel, plumbing, and water heater last replaced?
- Is there a deadline driving the sale (1031 exchange, divorce, estate, relocation)? That informs how much negotiation room exists.
- Schools are B-rated — typically a magnet for longer-tenancy family renters. What's the average tenant stay here, and is there a school-zone premium baked into asking?
- What's the average days-on-market for RENTAL listings here right now (not sales)? A rising rental-DOM trend means longer vacancies and softer asking-rent achievability than the comps imply.
- What's the recent tenant-quality profile in this submarket — average credit score on applications, eviction rate, late-payment / NSF rate, and stable-employment percentage? A property-management company in the area should have these aggregated.
- How much new for-sale + rental construction is in the pipeline within 1–3 miles? Heavy new supply typically softens prices + rents 12–24 months out; constrained supply supports both.
Investment metrics
- 1% rule
- 1.46% ✓
- Cap rate
- 11.84%
- Cash-on-cash
- 19.81%
- DSCR
- 1.88
- GRM
- 5.7
CMA / ARV
- ARV (median comp)
- $241,677
- List price
- $120,000
- Delta
- -50.35%
- Verdict
- UNDERPRICED
- Comps
- 20 within 1.0 mi
Show comp detail 10 sales within ~0.75 mi
| Address | Dist | Beds/Ba | Sqft | Sold | Price | $/sf | Match |
|---|---|---|---|---|---|---|---|
| 332 Main St | 0.03mi | 3/2.0 (-1) | 2,340 (+6%) | 14mo | $244,500 | $104 | 71 |
| 202 Carol Rd | 0.57mi | 4/2.0 | 2,069 (-6%) | 12mo | $355,000 | $172 | 54 |
| 135 Beverly Rd Unit Blg5 U-135 | 0.49mi | 3/2.5 (-1) | 2,300 (+4%) | 11mo | $319,900 | $139 | 53 |
| 139 Church St | 0.22mi | 3/2.0 (-1) | 2,500 (+14%) | 15mo | $212,500 | $85 | 50 |
| 107 Catherine Dr | 0.32mi | 4/2.5 | 2,006 (-9%) | 22mo | $410,000 | $204 | 50 |
| 402 Kennedy Dr | 0.52mi | 3/2.0 (-1) | 2,050 (-7%) | 13mo | $299,000 | $146 | 48 |
| 100 Carol Rd | 0.56mi | 3/2.0 (-1) | 2,336 (+6%) | 23mo | $311,000 | $133 | 39 |
| 635 N Miller St Unit L 1 | 0.53mi | 3/2.0 (-1) | 2,480 (+13%) | 14mo | $257,500 | $104 | 38 |
| 101 Main St | 0.54mi | 3/2.0 (-1) | 2,430 (+10%) | 20mo | $258,500 | $106 | 36 |
| 504 Union St | 0.74mi | 3/2.0 (-1) | 2,528 (+15%) | 7mo | $260,000 | $103 | 30 |
Match score weights: distance 35% · size 25% · config 20% · recency 20%. Top-matched comps best support the ARV.
Projected returns pro-forma
-3.0% appreciation · 3.0% rent growth · sell at horizon
- IRR
- 11.9%
- Equity multiple
- 1.47×
- Total profit
- $15,906
- Equity at exit
- $17,892
- IRR
- 20.9%
- Equity multiple
- 2.77×
- Total profit
- $59,445
- Equity at exit
- $10,375
Cash invested: $33,600 (down + closing). Projections, not guarantees.
Landlord ↔ Tenant lean methodology
- Overall (STATE)
- 62 Landlord-Friendly
- State Pennsylvania
- 62 Landlord-Friendly · EVEN
- County
- — inherits STATE
- City
- — inherits STATE
ZIP-level market 18403
- Active inventory
- 69
- Price-to-rent
- 5.7×
Monthly cashflow live
- Estimated rent
- $1,752 medium interval (Pro) →
- Mortgage (P&I)
- −$629
- Tax est. 1.5%
- −$150 /mo · $1,800/yr
- Insurance
- −$50
- HOA
- −$0
- Vacancy / Maint / Mgmt
- −$368
- Net cashflow
- $555
Break-even live
Sensitivity live
| Price | -10% $638 | -5% $596 | +0% $555 | +5% $513 | +10% $472 |
|---|---|---|---|---|---|
| Rent | -10% $416 | -5% $485 | +0% $555 | +5% $624 | +10% $693 |
| Rate | -1.0pp $615 | -0.5pp $585 | base $555 | +0.5pp $524 | +1.0pp $492 |
UW: 25.0% down · 7.5% · 30yr · 1.5% tax · 5.0% vac · 8.0% maint · 8.0% mgmt
Financing live
Cash to close
- Down payment
- $30,000
- Closing costs
- $3,600
- Reserves months
- —
- Total cash needed
- —
Loan-product check · same deal, 3 products live
Conventional
25% down · 7.5% · 30yr
- Down + closing
- —
- Monthly P&I
- —
- Monthly cashflow
- —
- DSCR
- —
- Eligible?
- —
Personal DTI + credit; lowest rate.
DSCR
20% down · 8.5% · 30yr
- Down + closing
- —
- Monthly P&I
- —
- Monthly cashflow
- —
- DSCR
- —
- Eligible?
- —
No personal income docs; deal must DSCR.
Hard money
10% down · 12.0% · 12mo
- Down + closing
- —
- Monthly P&I
- —
- Monthly cashflow
- —
- DSCR
- —
- Eligible?
- —
Short-term bridge; refi at stabilization.
Rent comps 2 comps
| Address | Beds | Baths | Sqft | Rent | $/sqft | DOM | Units | Dist |
|---|---|---|---|---|---|---|---|---|
| 319 Union St Peckville, PA | 3.0 | 1.5 | 1400 | $1,695 | $1.21 | 15d | 1 | 0.86mi |
| 421 Academy St Unit 1 Peckville, PA | 3.0 | 1.0 | 2135 | $1,800 | $0.84 | 15d | 1 | 1.11mi |
Listing history 2 events
-
2026-05-08status Pending 973-char remark
-
2026-04-29$120,000 Active 973-char remark
ⓘ Source: listings_history table (triggers on properties + properties_extension) + one-shot
backfill from property_details.listing_events for pre-trigger history.
Climate risk First Street
- Flood 1/10 Low FEMA zone X (unshaded) · 0% chance over 30 yrs
- Wildfire 1/10 Low
- Heat 3/10 Moderate 8 d/yr ≥94°F today · 19 d/yr by 30 yrs out
- Wind 2/10 Low 3% chance of damaging wind over 30 yrs
- Air quality 2/10 Low 1 unhealthy d/yr today · 1 by 30 yrs out
Nearby sold comps map
Loading sold comps map…
Walkable amenities ~0.75 mi
Loading nearby amenities…
Taxation est. · year 1
- Rental income
- $21,022
- − Mortgage interest
- −$6,722
- − Property taxes
- −$1,800
- − Insurance
- −$600
- − Repairs & maintenance
- −$1,682
- − Management
- −$1,682
- − Depreciation
- −$3,491
- Taxable income
- $5,045
- Est. tax owed @ 24.0%
- −$1,211
- After-tax cash flow
- $5,445/yr
For passive investors: Depreciation is non-cash, so a rental often shows a tax loss while cash-flowing — sheltering income. Rental losses are passive: they offset passive income freely, and up to $25,000/yr can offset ordinary (W-2) income if you actively participate and your MAGI is under $100k (phasing out to $0 by $150k); unused losses carry forward. On sale, claimed depreciation is recaptured at up to 25%, and gains may owe capital-gains tax (a 1031 exchange can defer both). Figures are a year-1 estimate at your 24.0% rate — not tax advice; consult a CPA.
Schools (NCES district)
- District
- Valley View SD
- NCES district ID
- 4224650
- Math proficiency
- 34% ▼ -10.00%
- Reading proficiency
- 57% ▼ -12.00%
- Median HH income
- $45,562
- Composite
- 38.54/100
- National rank
- #4174
- State rank
- #269 of 539 in PA
Livability — Archbald
- Score
- 73/100
- State rank
- #596
- US rank
- #5675
Category grades
Schools grade is shown separately in the Schools card above.
Census & demographics
- Census place
- Archbald, PA
- City population
- 6,580
- Population (ZIP)
- 6,580
Population outlook (Lackawanna County) Hauer SSP2
- Today (2025)
- 210,652 people
- By 2030
- 208,623 · -1.0%
- By 2040
- 203,980 · -3.2%
- By 2050
- 201,069 · -4.5%
- By 2075
- 205,026 · -2.7%
- By 2100
- 210,851 · +0.1%
Race, ethnicity, and origin ACS 2023
- Neighborhood character
- Predominantly White (98%)
- Race & ethnicity
- White 98% Two or more races 1%
- Common ancestry
- Romanian 13% Scotch-Irish 6% Subsaharan African 1%
- Foreign-born
- 1%
Political lean MEDSL · Lackawanna
- 2024 margin
- Toss-up / Even · D 51.0% · R 48.3%
- 2008→2024 swing
- -23.2pp toward R · 2008: 26.0pp · 2024: 2.8pp
- All cycles
- 2024: D+2.8 2020: D+8.4 2016: D+3.4 2012: D+27.4 2008: D+26.0
Not yet ingested
- Civics
- —
Market trends
- HPI YoY
- ▼ -149.56%
- Current HPI
- 208.173
- Rent YoY
- —
- Metro
- —
- State GDP YoY
- ▲ 1.68%
- F500 in state
- 34
Industry mix (Fortune 500 HQ in PA)
| Industry | F500 HQs | Revenue |
|---|---|---|
| Healthcare | 2 | $309B |
|
||
| Insurance | 2 | $27B |
|
||
| Telecommunications / Media | 1 | $124B |
|
||
| Industrial Distribution | 1 | $22B |
|
||
| Financial Services | 1 | $20B |
|
||
| Chemicals / Materials | 1 | $18B |
|
||
Price history
+4.2% since first listed3 events — show timeline
- 2026-05-27 Sold (MLS) $125,000 GSBR as distributed by MLS GRID
- 2026-05-08 Pending — GSBR as distributed by MLS GRID
- 2026-04-29 Listed $120,000 GSBR as distributed by MLS GRID
Property tax history
+37.9%/yrLatest (2026): $55,781 · +2549.1% YoY. Source: county tax records.
Cash-flow waterfall
monthlySold comps — $/sqft
last 12 mo · ≤1 miLoading sold comps…