 Triplex
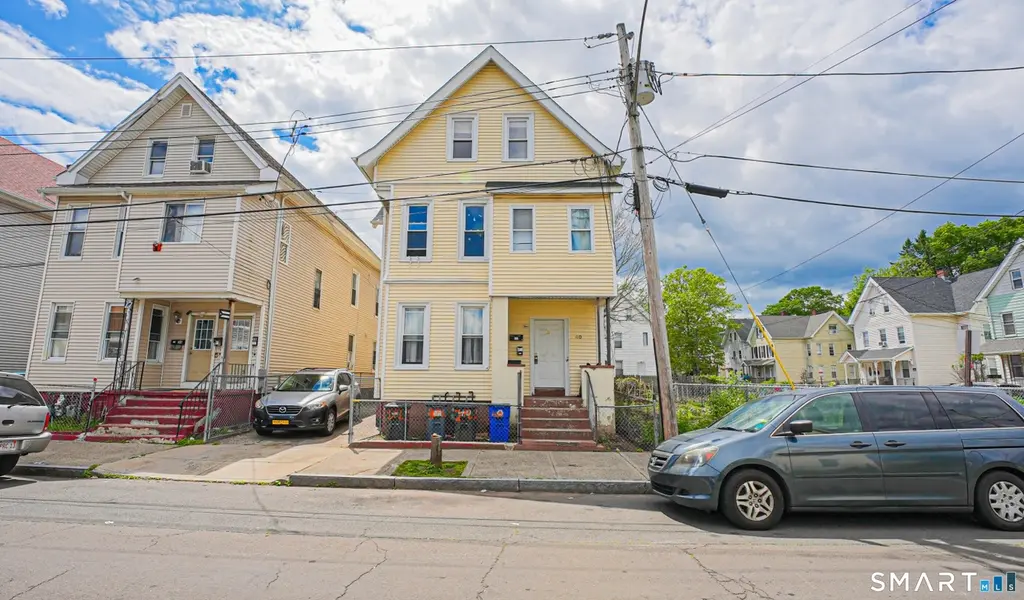
40 Shelter St · New Haven, CT
Flood risk 6/10 · Moderate
- FEMA flood zone
- X (unshaded)
- Chance of flooding over 30 yrs
- 0.69%
- Est. flood insurance / yr
- $473 – $860
Fire risk 1/10 · Minimal
- Est. fire insurance / yr
- $829 – $1,539
Heat risk 7/10 · Major
- Hot days now (above 99°F)
- 7 days/yr
- Hot days in 30 yrs
- 16 days/yr
Wind risk 6/10 · Moderate
- Chance of severe wind over 30 yrs
- 56.0%
Air-quality risk 5/10 · Moderate
- Unhealthy air days now
- 6 days/yr
- Unhealthy air days in 30 yrs
- 8 days/yr
Risk factors via First Street. Map © Google.
Why this score? — see what drove the C+ grade
The composite is a weighted blend of 9 inputs, each scored 0–100. Each bar is that input's sub-score; the figure is the points it added to the 100-point composite (weight × sub-score).
- Cash flow +29.7/30.0
- DSCR +10.0/10.0
- 1% rule +7.9/10.0
- Livability +4.0/5.0
- Rent growth +3.5/5.0
- Condition / age +2.5/5.0
- ARV discount +1.5/15.0
- Schools +1.5/10.0
- Appreciation +0.0/10.0
$499,990
🖨 Deal sheet (PDF) 📄 Offer letter ✓ Due diligence
Multi-family units
County records classify this as Multi-Family (2-4 Unit). Listing-text estimate: 3 units. confirmed
Listing remarks MLS
Investment opportunity! This well-maintained three-family home provides a lucrative income stream for savvy investors. Each unit is thoughtfully designed, ensuring comfortable living spaces. The property features spacious layouts & bright living areas. Conveniently located in New Haven, it provides easy access to public transportation, schools, shopping, and dining. Whether you're expanding your portfolio or seeking a property with income potential, this home is a smart choice. Don't miss out on this rare opportunity!
Key facts
- 2,613 sq ft lot
- Built 1900
- Listed 9 days
Property features AI
Exterior
- Utilities: Public water connected; Public sewer connected; Gas available in street
- Home design: Multi-family 3-family property
- Construction: Frame construction; Concrete and stone foundation
- Exterior features: Level lot; Vinyl siding; Shingle roof
Interior
- Bedrooms: 8 bedrooms total
- Bathrooms: 3 full bathrooms
- Heating & cooling: Hot air heating; Window unit cooling; 40-gallon hot water tank
- Interior features: Partial basement; Total of 14 rooms
Neighborhood map
What this means for you Summary
Snapshot
- This is a 3 × 3-bed/1.0-bath units multifamily listed at $500k.
Deal economics
- At list price, monthly cash flow is $2k ($22k/yr) — positive. Per door: $609/mo.
- The deal already cash-flows at list — no discount required.
- Meets the 1% rule at list price ($6k rent vs $500k).
- Cap rate 10.7% vs local median 4.8% in New Haven — top-decile yield for the area; either an underpriced asset or a hidden risk that comps aren't pricing in. Stress-test before assuming the spread holds.
Location & tenants
- Location reads 79/100 on livability (#31 in CT, #2,190 nationally) — a middle-class / working-renter tenant base. Strengths: amenities A+, commute A+, health & safety A+; Watch: employment D, crime F.
- New Haven School District (urban): math 12% / reading 25% proficiency, ranked #147 of 153 in CT (top 96%) — low school quality limits family demand, transient renter base, plan for 1-2y turnover; 66% free/reduced lunch — lower-income household profile, screen leases tightly.
- Zoned schools: Betsy Ross Arts Magnet School (math 12% / reading 27%, grade F, #161 of 175 statewide, top 93%, 327 students, 70% FRL) — zoned schools at 70% FRL track the district average.
- Market conditions: Rents rising fast (+4.1%/yr); 102 active listings in the ZIP; 2 comparable units currently listed for rent nearby; 1,059 units permitted in South Central Connecticut Planning Region in 2024 (779 in 5+ unit buildings).
- At $6,446/mo this rent would consume 159% of the median local household income ($48k/yr) (locally 2664% of renters already pay >50% of income on rent) — very limited rent-growth headroom before tenants either downsize or default.
Forward outlook
- Local home prices are declining (-3.0%/yr); year-one equity from $3k of loan paydown is wiped out by about $15k of value loss. Plan a longer hold.
- At projected returns (-3.0% appreciation + 4.1% rent growth), your $140k cash investment doubles in ~7 years — after that, you're playing with house money.
Negotiation context
- Only 9 days on market — expect competitive offers; lowballing is unlikely to land.
- 7 sale attempts since 17y ago with the ask held roughly flat each time — persistent listings suggest the price (not the market) is what's stuck; bring a comps-based counter.
Risks & watch-outs
- Watch-outs: built in 1900 — expect roof / HVAC / electrical / plumbing capex.
- Climate carrying-cost: major flood risk; major wind risk, 56% chance of damaging wind over 30y; extreme-heat days projected 7→16/yr by 2055 (HVAC capex compounding) — expect insurance premiums to compound above CPI over the hold.
Questions for the listing agent
- Can we see the unit-by-unit rent roll, current vacancy, and any below-market leases? What's the average tenancy length?
- What capital expenditures (roof, boiler, parking lot, exteriors) have been made in the last 5 years, and what's planned in the next 2?
- Built in 1900 — when were the roof, HVAC, electrical panel, plumbing, and water heater last replaced?
- Is there a deadline driving the sale (1031 exchange, divorce, estate, relocation)? That informs how much negotiation room exists.
- Schools are D-rated, which usually means shorter tenancies and higher turnover. Who's the typical renter profile here, and what's been the actual vacancy rate?
- Crime grade is F in this area — have there been break-ins, vandalism, or insurance claims at this property in the last 3 years? What carrier currently insures it and at what premium?
- What's the average days-on-market for RENTAL listings here right now (not sales)? A rising rental-DOM trend means longer vacancies and softer asking-rent achievability than the comps imply.
- What's the recent tenant-quality profile in this submarket — average credit score on applications, eviction rate, late-payment / NSF rate, and stable-employment percentage? A property-management company in the area should have these aggregated.
- How much new apartment / multifamily construction is in the pipeline within 1–3 miles? Heavy new supply (>2% of stock underway) typically softens rents 12–24 months out; light construction supports rent growth.
Investment metrics
- 1% rule
- 1.29% ✓
- Cap rate
- 10.68%
- Cash-on-cash
- 15.66%
- DSCR
- 1.70
- GRM
- 6.5
CMA / ARV
- ARV (median comp)
- $440,978
- List price
- $499,990
- Delta
- 13.38%
- Verdict
- OVERPRICED
- Comps
- 20 within 1.0 mi
Show comp detail 12 sales within ~0.75 mi
| Address | Dist | Beds/Ba | Sqft | Sold | Price | $/sf | Match |
|---|---|---|---|---|---|---|---|
| 36 Shelter St | 0.01mi | 7/3.0 (+1) | 3,161 (+2%) | 5mo | $440,000 | $139 | 83 |
| 115 Clay St | 0.03mi | 7/3.0 (+1) | 2,850 (-8%) | 5mo | $450,000 | $158 | 73 |
| 181 Lombard St | 0.59mi | 6/3.0 | 3,222 (+4%) | 1mo | $462,500 | $144 | 61 |
| 222 Dover St | 0.54mi | 6/3.0 | 3,108 (+0%) | 12mo | $294,800 | $95 | 60 |
| 56 Nash St | 0.70mi | 6/3.0 | 3,096 (+0%) | 4mo | $815,000 | $263 | 60 |
| 369 Poplar St | 0.20mi | 5/2.0 (-1) | 2,760 (-11%) | 1mo | $449,000 | $163 | 59 |
| 241 Ferry St | 0.40mi | 6/3.0 | 2,906 (-6%) | 14mo | $515,000 | $177 | 56 |
| 33 Chapel St | 0.53mi | 7/2.0 (+1) | 2,976 (-4%) | 1mo | $480,000 | $161 | 55 |
| 544 Ferry St | 0.35mi | 6/2.0 | 3,355 (+8%) | 12mo | $540,000 | $161 | 51 |
| 122 Atwater St | 0.45mi | 6/3.0 | 3,407 (+10%) | 9mo | $430,000 | $126 | 51 |
| 141 Wolcott St | 0.27mi | 5/3.0 (-1) | 2,632 (-15%) | 8mo | $449,900 | $171 | 48 |
| 117 Lloyd St | 0.38mi | 7/3.0 (+1) | 2,737 (-12%) | 13mo | $400,000 | $146 | 43 |
Match score weights: distance 35% · size 25% · config 20% · recency 20%. Top-matched comps best support the ARV.
Projected returns pro-forma
-3.0% appreciation · 4.12% rent growth · sell at horizon
- IRR
- 7.7%
- Equity multiple
- 1.30×
- Total profit
- $42,637
- Equity at exit
- $74,550
- IRR
- 17.9%
- Equity multiple
- 2.55×
- Total profit
- $217,679
- Equity at exit
- $43,230
Cash invested: $139,997 (down + closing). Projections, not guarantees.
Landlord ↔ Tenant lean methodology
- Overall (STATE)
- 27 Tenant-Leaning
- State Connecticut
- 27 Tenant-Leaning · D+7
- County
- — inherits STATE
- City
- — inherits STATE
ZIP-level market 06513
- Home prices YoY
- -7.8%
- Rents YoY
- 4.1%
- Active inventory
- 102
- Price-to-rent
- 19.4×
Monthly cashflow live
- Estimated rent
- $6,446 high interval (Pro) →
- Mortgage (P&I)
- −$2,622
- Tax from tax record
- −$436 /mo · $5,226/yr
- Insurance
- −$208
- HOA
- −$0
- Vacancy / Maint / Mgmt
- −$1,354
- Net cashflow
- $1,827
Break-even live
Sensitivity live
| Price | -10% $2,110 | -5% $1,968 | +0% $1,827 | +5% $1,685 | +10% $1,543 |
|---|---|---|---|---|---|
| Rent | -10% $1,317 | -5% $1,572 | +0% $1,827 | +5% $2,081 | +10% $2,336 |
| Rate | -1.0pp $2,078 | -0.5pp $1,954 | base $1,827 | +0.5pp $1,697 | +1.0pp $1,565 |
3-unit breakdown (identical units grouped — click to expand)
| Units | Beds | Baths | Est. rent |
|---|---|---|---|
| 3× units | 3 | 1 | $6,447 |
| #1 | 3 | 1 | $2,149 |
| #2 | 3 | 1 | $2,149 |
| #3 | 3 | 1 | $2,149 |
| Total (3 units) | $6,446 | ||
UW: 25.0% down · 7.5% · 30yr · 1.5% tax · 5.0% vac · 8.0% maint · 8.0% mgmt
Financing live
Cash to close
- Down payment
- $124,998
- Closing costs
- $15,000
- Reserves months
- —
- Total cash needed
- —
Loan-product check · same deal, 3 products live
Conventional
25% down · 7.5% · 30yr
- Down + closing
- —
- Monthly P&I
- —
- Monthly cashflow
- —
- DSCR
- —
- Eligible?
- —
Personal DTI + credit; lowest rate.
DSCR
20% down · 8.5% · 30yr
- Down + closing
- —
- Monthly P&I
- —
- Monthly cashflow
- —
- DSCR
- —
- Eligible?
- —
No personal income docs; deal must DSCR.
Hard money
10% down · 12.0% · 12mo
- Down + closing
- —
- Monthly P&I
- —
- Monthly cashflow
- —
- DSCR
- —
- Eligible?
- —
Short-term bridge; refi at stabilization.
Rent comps 2 comps
| Address | Beds | Baths | Sqft | Rent | $/sqft | DOM | Units | Dist |
|---|---|---|---|---|---|---|---|---|
| 30 Trumbull St New Haven, CT | 5.0 | 4.0 | 2668 | $5,000 | $1.87 | 5d | 1 | 0.93mi |
| 54 Trumbull St Unit 54-1 New Haven, CT | 5.0 | 2.5 | 2250 | $6,695 | $2.98 | 16d | 1 | 1.04mi |
Listing history 19 events
-
2026-05-15status Under Contract 600-char remark
-
2026-05-06$499,990 Active 600-char remark
-
2025-04-16status Under Contract 527-char remark
Show marketing remark (527 chars)
Investment opportunity! This well-maintained three-family home provides a lucrative income stream for savvy investors. Each unit is thoughtfully designed, ensuring comfortable living spaces. The property features spacious layouts & bright living areas. Conveniently located in New Haven, it provides easy access to public transportation, schools, shopping, and dining. Whether you're expanding your portfolio or seeking a property with income potential, this home is a smart choice. Don't miss out on this rare opportunity!
-
2025-04-16soldstatus $450,000 Closed 527-char remark
Show marketing remark (527 chars)
Investment opportunity! This well-maintained three-family home provides a lucrative income stream for savvy investors. Each unit is thoughtfully designed, ensuring comfortable living spaces. The property features spacious layouts & bright living areas. Conveniently located in New Haven, it provides easy access to public transportation, schools, shopping, and dining. Whether you're expanding your portfolio or seeking a property with income potential, this home is a smart choice. Don't miss out on this rare opportunity!
-
2025-03-12historical Under Contract - Continue to Show 527-char remark
Show marketing remark (527 chars)
Investment opportunity! This well-maintained three-family home provides a lucrative income stream for savvy investors. Each unit is thoughtfully designed, ensuring comfortable living spaces. The property features spacious layouts & bright living areas. Conveniently located in New Haven, it provides easy access to public transportation, schools, shopping, and dining. Whether you're expanding your portfolio or seeking a property with income potential, this home is a smart choice. Don't miss out on this rare opportunity!
-
2025-03-04status Active 527-char remark
Show marketing remark (527 chars)
Investment opportunity! This well-maintained three-family home provides a lucrative income stream for savvy investors. Each unit is thoughtfully designed, ensuring comfortable living spaces. The property features spacious layouts & bright living areas. Conveniently located in New Haven, it provides easy access to public transportation, schools, shopping, and dining. Whether you're expanding your portfolio or seeking a property with income potential, this home is a smart choice. Don't miss out on this rare opportunity!
-
2025-02-12historical Under Contract - Continue to Show 527-char remark
Show marketing remark (527 chars)
Investment opportunity! This well-maintained three-family home provides a lucrative income stream for savvy investors. Each unit is thoughtfully designed, ensuring comfortable living spaces. The property features spacious layouts & bright living areas. Conveniently located in New Haven, it provides easy access to public transportation, schools, shopping, and dining. Whether you're expanding your portfolio or seeking a property with income potential, this home is a smart choice. Don't miss out on this rare opportunity!
-
2025-01-31$465,000 Active 527-char remark
Show marketing remark (527 chars)
Investment opportunity! This well-maintained three-family home provides a lucrative income stream for savvy investors. Each unit is thoughtfully designed, ensuring comfortable living spaces. The property features spacious layouts & bright living areas. Conveniently located in New Haven, it provides easy access to public transportation, schools, shopping, and dining. Whether you're expanding your portfolio or seeking a property with income potential, this home is a smart choice. Don't miss out on this rare opportunity!
-
2020-07-07soldstatus $170,000
-
2018-01-02historical
-
2017-09-17$189,900 Active
-
2017-09-09historical
-
2017-06-14$189,900
-
2016-08-26historical
-
2016-02-27$179,900
-
2009-06-19soldstatus $100,000
-
2009-05-07$119,900
-
2008-01-10soldstatus $296,000
-
1989-06-21soldstatus $155,000
ⓘ Source: listings_history table (triggers on properties + properties_extension) + one-shot
backfill from property_details.listing_events for pre-trigger history.
Tax reassessment forecast CT · Partial reset (capped growth)
- Current annual tax
- $5,226 · $436/mo
- Projected year-2 tax
- $7,963 · $664/mo
- Expected delta
- +$2,737/yr (+$228/mo · 52.4%)
ⓘ Screening estimate from a state-policy table — verify with the county assessor before closing.
Climate risk First Street
- Flood 6/10 Major FEMA zone X (unshaded) · 69% chance over 30 yrs
- Wildfire 1/10 Low
- Heat 7/10 Severe 7 d/yr ≥99°F today · 16 d/yr by 30 yrs out
- Wind 6/10 Major 56% chance of damaging wind over 30 yrs
- Air quality 5/10 Major 6 unhealthy d/yr today · 8 by 30 yrs out
Nearby sold comps map
Loading sold comps map…
Walkable amenities ~0.75 mi
Loading nearby amenities…
Taxation est. · year 1
- Rental income
- $77,352
- − Mortgage interest
- −$28,007
- − Property taxes
- −$5,226
- − Insurance
- −$2,500
- − Repairs & maintenance
- −$6,188
- − Management
- −$6,188
- − Depreciation
- −$14,545
- Taxable income
- $14,697
- Est. tax owed @ 24.0%
- −$3,527
- After-tax cash flow
- $18,391/yr
For passive investors: Depreciation is non-cash, so a rental often shows a tax loss while cash-flowing — sheltering income. Rental losses are passive: they offset passive income freely, and up to $25,000/yr can offset ordinary (W-2) income if you actively participate and your MAGI is under $100k (phasing out to $0 by $150k); unused losses carry forward. On sale, claimed depreciation is recaptured at up to 25%, and gains may owe capital-gains tax (a 1031 exchange can defer both). Figures are a year-1 estimate at your 24.0% rate — not tax advice; consult a CPA.
Schools (NCES district)
- District
- New Haven School District
- NCES district ID
- 0902790
- Math proficiency
- 12% ▼ -10.00%
- Reading proficiency
- 25% ▼ -10.00%
- Median HH income
- $38,058
- Composite
- 15.48/100
- National rank
- #9308
- State rank
- #147 of 153 in CT
Livability — New Haven
- Score
- 79/100
- State rank
- #31
- US rank
- #2190
Category grades
Schools grade is shown separately in the Schools card above.
Census & demographics
- Census place
- New Haven, CT
- County
- New Haven County · 688,236 people
- City population
- 132,813
- Metro
- New Haven-Milford, CT
- Population (ZIP)
- 38,888
- Household income
- $48,500
- Rent vs Own
- Severe rent burden
- 2664.0
Population outlook (South Central Connecticut County) Hauer SSP2
- By 2040
- 608,362
Race, ethnicity, and origin ACS 2023
- Neighborhood character
- Diverse neighborhood (Simpson 0.66)
- Race & ethnicity
- Hispanic / Latino 47% White 26% Black 22% Two or more races 12% Asian 1%
- Hispanic origin (detail)
- Mexican 7% Puerto Rican 25% Dominican 2%
- Common ancestry
- Romanian 2% Lithuanian 1% Slovak 1%
- Foreign-born
- 17% · Canada, Jamaica, South Korea
- Languages at home
- 56% English-only · Spanish 39% Other Indo-European 1% Russian/Polish/Slavic 1%
Political lean MEDSL · South Central Connecticut
- 2024 margin
- Strong D (+20.1) · D 59.0% · R 38.9% · Other 2.1%
- All cycles
- 2024: D+20.1
Not yet ingested
- Civics
- —
Market trends
- HPI YoY
- ▼ -30.87%
- Current HPI
- 364.006
- Rent YoY
- ▲ 4.12%
- Metro
- New Haven-Milford, CT
- State GDP YoY
- ▲ 1.06%
- F500 in state
- 38
Industry mix (Fortune 500 HQ in CT)
| Industry | F500 HQs | Revenue |
|---|---|---|
| Industrial Machinery | 4 | $38B |
|
||
| Insurance | 3 | $71B |
|
||
| Financial Services | 2 | $25B |
|
||
| Transportation / Logistics | 2 | $18B |
|
||
| Healthcare | 1 | $247B |
|
||
| Telecommunications | 1 | $55B |
|
||
Price history
+222.6% since first listed19 events — show timeline
- 2026-05-15 Pending — Smart MLS
- 2026-05-06 Listed $499,990 Smart MLS
- 2025-04-16 Pending — Smart MLS
- 2025-04-16 Sold (MLS) $450,000 Smart MLS
- 2025-03-12 Contingent — Smart MLS
- 2025-03-04 Relisted — Smart MLS
- 2025-02-12 Contingent — Smart MLS
- 2025-01-31 Listed $465,000 Smart MLS
- 2020-07-07 Sold (Public Records) $170,000 Public Records
- 2018-01-02 Listing Removed — Smart MLS
- 2017-09-17 Listed $189,900 Smart MLS
- 2017-09-09 Listing Removed — Smart MLS
- 2017-06-14 Listed $189,900 Smart MLS
- 2016-08-26 Listing Removed — Smart MLS
- 2016-02-27 Listed $179,900 Smart MLS
- 2009-06-19 Sold (MLS) $100,000 Smart MLS
- 2009-05-07 Listed $119,900 Smart MLS
- 2008-01-10 Sold (Public Records) $296,000 Public Records
- 1989-06-21 Sold (Public Records) $155,000 Public Records
Property tax history
+4.4%/yrLatest (2023): $5,226 · -6.4% YoY. Source: county tax records.
Cash-flow waterfall
monthlySold comps — $/sqft
last 12 mo · ≤1 miLoading sold comps…