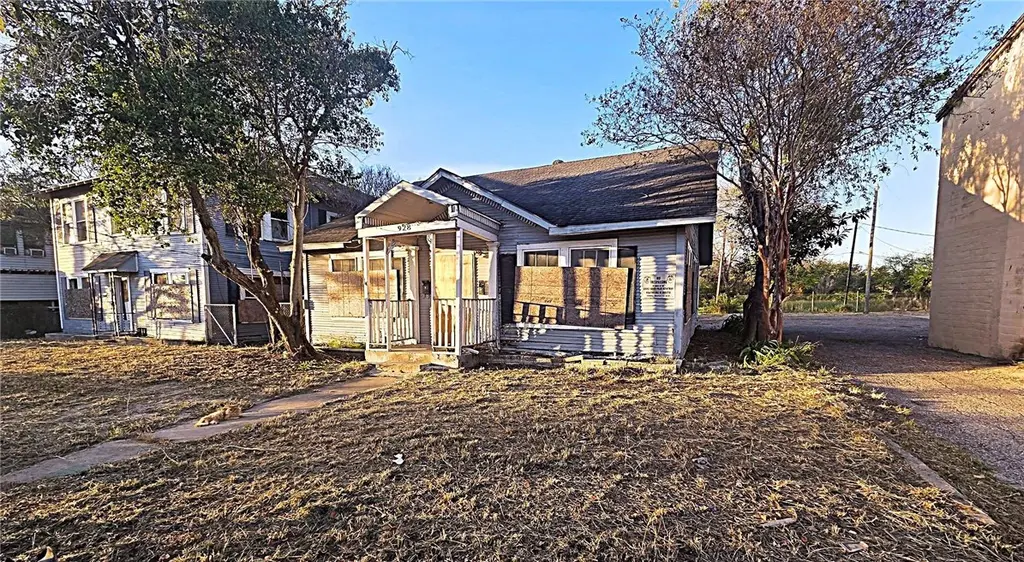
928 Park Ave · Corpus Christi, TX
Flood risk 1/10 · Minimal
- FEMA flood zone
- X (unshaded)
- Chance of flooding over 30 yrs
- 0.0%
- Est. flood insurance / yr
- $507 – $1,088
Fire risk 1/10 · Minimal
- Est. fire insurance / yr
- $1,222 – $2,270
Heat risk 10/10 · Severe
- Hot days now (above 107°F)
- 7 days/yr
- Hot days in 30 yrs
- 26 days/yr
Wind risk 9/10 · Severe
- Chance of severe wind over 30 yrs
- 99.0%
Air-quality risk 1/10 · Minimal
- Unhealthy air days now
- 0 days/yr
- Unhealthy air days in 30 yrs
- 0 days/yr
Risk factors via First Street. Map © Google.
Why this score? — see what drove the B+ grade
The composite is a weighted blend of 9 inputs, each scored 0–100. Each bar is that input's sub-score; the figure is the points it added to the 100-point composite (weight × sub-score).
- Cash flow +30.0/30.0
- 1% rule +10.0/10.0
- DSCR +10.0/10.0
- ARV discount +7.5/15.0
- Appreciation +6.7/10.0
- Livability +3.9/5.0
- Rent growth +2.9/5.0
- Schools +2.8/10.0
- Condition / age +2.5/5.0
$92,490
🖨 Deal sheet (PDF) 📄 Offer letter ✓ Due diligence
Listing remarks MLS
928 Park Avenue is a duplex featuring two 1-bedroom, 1-bath apartments located just a short distance from the bayfront. The property has a long rental history and offers strong potential for investors seeking a value-add opportunity. The duplex is currently in fair condition and presents an opportunity for improvements that could enhance both value and rental income. With the right vision and updates, this property has the potential to become a solid cash-flowing investment. Bring your favorite Realtor and your general contractor to explore the possibilities and see the potential this property has to offer.
Key facts
- 7,283 sq ft lot
- Built 1965
- Listed 54 days
Neighborhood map
What this means for you Summary
Snapshot
- This is a 4-bed/4.0-bath other listed at $92k.
Deal economics
- At list price, monthly cash flow is $644 ($8k/yr) — positive.
- The deal already cash-flows at list — no discount required.
- Meets the 1% rule at list price ($2k rent vs $92k).
- Recommended offer: $90k (3.0% below list) — sets the bar for market timing.
- Cap rate 14.7% vs local median 3.6% in Corpus Christi — top-decile yield for the area; either an underpriced asset or a hidden risk that comps aren't pricing in. Stress-test before assuming the spread holds.
Location & tenants
- Location reads 78/100 on livability (#66 in TX, #2,404 nationally) — a middle-class / working-renter tenant base. Strengths: commute A+, cost of living A+, housing A+; Watch: crime F.
- Corpus Christi ISD (urban): math 31% / reading 35% proficiency, ranked #562 of 826 in TX (top 68%) — families likely to look elsewhere, expect single-tenant / working-renter base with shorter leases; 63% free/reduced lunch — lower-income household profile, screen leases tightly.
- Market conditions: Rents rising (+1.6%/yr); 41 active listings in the ZIP; 6 comparable units currently listed for rent nearby; rentals at typical pace (median 23d on market — plan ~3-4 weeks tenant-placement turnaround); lower-income renter base — watch delinquency; 1,397 units permitted in Nueces County in 2024 (47 in 5+ unit buildings).
- At $1,625/mo this rent would consume 48% of the median local household income ($41k/yr) (locally 336% of renters already pay >50% of income on rent) — very limited rent-growth headroom before tenants either downsize or default.
Forward outlook
- In year one you build about $4k of equity ($640 loan paydown + $3k appreciation (3.4% local appreciation)).
- Nueces County population projected at +36% by 2050 — long-run rental-demand tailwind backs the buy-and-hold thesis.
- At projected returns (3.4% appreciation + 1.6% rent growth), your $26k cash investment doubles in ~3 years — after that, you're playing with house money.
- By year 9, paydown + projected appreciation supports a ~$32k cash-out refi (75% LTV) — recoverable capital for the next deal without selling this one.
Negotiation context
- It's been on market 54 days — a 3% lower offer ($90k) is reasonable based on typical stale-listing flexibility.
- 4 sale attempts since 27y ago with the ask held roughly flat each time — persistent listings suggest the price (not the market) is what's stuck; bring a comps-based counter.
Risks & watch-outs
- Climate carrying-cost: severe wind risk, 99% chance of damaging wind over 30y; extreme-heat days projected 7→26/yr by 2055 (HVAC capex compounding) — expect insurance premiums to compound above CPI over the hold.
Questions for the listing agent
- It's been on market 54 days. Have you received any prior offers? Is the seller open to a 3% concession, seller financing, or rate buy-down credit?
- Built in 1965 — when were the roof, HVAC, electrical panel, plumbing, and water heater last replaced?
- Is there a deadline driving the sale (1031 exchange, divorce, estate, relocation)? That informs how much negotiation room exists.
- Crime grade is F in this area — have there been break-ins, vandalism, or insurance claims at this property in the last 3 years? What carrier currently insures it and at what premium?
- What's the average days-on-market for RENTAL listings here right now (not sales)? A rising rental-DOM trend means longer vacancies and softer asking-rent achievability than the comps imply.
- What's the recent tenant-quality profile in this submarket — average credit score on applications, eviction rate, late-payment / NSF rate, and stable-employment percentage? A property-management company in the area should have these aggregated.
- How much new for-sale + rental construction is in the pipeline within 1–3 miles? Heavy new supply typically softens prices + rents 12–24 months out; constrained supply supports both.
Investment metrics
- 1% rule
- 1.76% ✓
- Cap rate
- 14.65%
- Cash-on-cash
- 29.85%
- DSCR
- 2.33
- GRM
- 4.7
CMA / ARV
- ARV (median comp)
- $262,647
- List price
- $92,490
- Delta
- -64.79%
- Verdict
- UNDERPRICED
- Comps
- 11 within 1.0 mi
Projected returns pro-forma
3.37% appreciation · 1.63% rent growth · sell at horizon
- IRR
- 35.3%
- Equity multiple
- 3.00×
- Total profit
- $51,822
- Equity at exit
- $43,541
- IRR
- 34.3%
- Equity multiple
- 5.71×
- Total profit
- $121,911
- Equity at exit
- $68,663
Cash invested: $25,897 (down + closing). Projections, not guarantees.
Landlord ↔ Tenant lean methodology
- Overall (STATE)
- 87 Strongly Landlord-Friendly
- State Texas
- 87 Strongly Landlord-Friendly · R+5
- County
- — inherits STATE
- City
- — inherits STATE
ZIP-level market 78401
- Home prices YoY
- 3.8%
- Rents YoY
- 1.6%
- Active inventory
- 41
- Price-to-rent
- 4.7×
Monthly cashflow live
- Estimated rent
- $1,625 high interval (Pro) →
- Mortgage (P&I)
- −$485
- Tax est. 1.5%
- −$116 /mo · $1,387/yr
- Insurance
- −$39
- HOA
- −$0
- Vacancy / Maint / Mgmt
- −$341
- Net cashflow
- $644
Break-even live
Sensitivity live
| Price | -10% $708 | -5% $676 | +0% $644 | +5% $612 | +10% $580 |
|---|---|---|---|---|---|
| Rent | -10% $516 | -5% $580 | +0% $644 | +5% $708 | +10% $773 |
| Rate | -1.0pp $691 | -0.5pp $668 | base $644 | +0.5pp $620 | +1.0pp $596 |
UW: 25.0% down · 7.5% · 30yr · 1.5% tax · 5.0% vac · 8.0% maint · 8.0% mgmt
Financing live
Cash to close
- Down payment
- $23,122
- Closing costs
- $2,775
- Reserves months
- —
- Total cash needed
- —
Loan-product check · same deal, 3 products live
Conventional
25% down · 7.5% · 30yr
- Down + closing
- —
- Monthly P&I
- —
- Monthly cashflow
- —
- DSCR
- —
- Eligible?
- —
Personal DTI + credit; lowest rate.
DSCR
20% down · 8.5% · 30yr
- Down + closing
- —
- Monthly P&I
- —
- Monthly cashflow
- —
- DSCR
- —
- Eligible?
- —
No personal income docs; deal must DSCR.
Hard money
10% down · 12.0% · 12mo
- Down + closing
- —
- Monthly P&I
- —
- Monthly cashflow
- —
- DSCR
- —
- Eligible?
- —
Short-term bridge; refi at stabilization.
Rent comps 6 comps
| Address | Beds | Baths | Sqft | Rent | $/sqft | DOM | Units | Dist |
|---|---|---|---|---|---|---|---|---|
| 813 Furman Ave Apt 1 Corpus Christi, TX | 3.0 | 2.0 | 1430 | $1,475 | $1.03 | 15d | 1 | 0.22mi |
| 110 Josephine St Corpus Christi, TX | 3.0 | 2.0 | 1050 | $2,000 | $1.90 | 45d | 1 | 0.47mi |
| 616 16th St Unit A Corpus Christi, TX | 3.0 | 1.0 | 1040 | $1,050 | $1.01 | 45d | 1 | 0.56mi |
| 2245 Comanche St Unit A Corpus Christi, TX | 3.0 | 1.0 | 1016 | $1,350 | $1.33 | 22d | 1 | 0.97mi |
| 1525 S 19th St Unit B Corpus Christi, TX | 3.0 | 2.0 | 1062 | $2,100 | $1.98 | 15d | 1 | 1.08mi |
| 2522 Cleo St Corpus Christi, TX | 3.0 | 1.0 | 992 | $1,350 | $1.36 | 15d | 1 | 1.31mi |
Listing history 10 events
-
2026-05-14status Pending 614-char remark
Show marketing remark (614 chars)
928 Park Avenue is a duplex featuring two 1-bedroom, 1-bath apartments located just a short distance from the bayfront. The property has a long rental history and offers strong potential for investors seeking a value-add opportunity. The duplex is currently in fair condition and presents an opportunity for improvements that could enhance both value and rental income. With the right vision and updates, this property has the potential to become a solid cash-flowing investment. Bring your favorite Realtor and your general contractor to explore the possibilities and see the potential this property has to offer.
-
2026-05-06historical 614-char remark
Show marketing remark (614 chars)
928 Park Avenue is a duplex featuring two 1-bedroom, 1-bath apartments located just a short distance from the bayfront. The property has a long rental history and offers strong potential for investors seeking a value-add opportunity. The duplex is currently in fair condition and presents an opportunity for improvements that could enhance both value and rental income. With the right vision and updates, this property has the potential to become a solid cash-flowing investment. Bring your favorite Realtor and your general contractor to explore the possibilities and see the potential this property has to offer.
-
2026-03-12$92,490 Active 614-char remark
Show marketing remark (614 chars)
928 Park Avenue is a duplex featuring two 1-bedroom, 1-bath apartments located just a short distance from the bayfront. The property has a long rental history and offers strong potential for investors seeking a value-add opportunity. The duplex is currently in fair condition and presents an opportunity for improvements that could enhance both value and rental income. With the right vision and updates, this property has the potential to become a solid cash-flowing investment. Bring your favorite Realtor and your general contractor to explore the possibilities and see the potential this property has to offer.
-
2021-11-02soldstatus
-
2008-03-28$492,000
-
2003-07-28soldstatus $145,000
-
2001-02-28soldstatus
-
2000-07-15$41,000
-
2000-03-15soldstatus
-
1999-06-29$45,000
ⓘ Source: listings_history table (triggers on properties + properties_extension) + one-shot
backfill from property_details.listing_events for pre-trigger history.
Climate risk First Street
- Flood 1/10 Low FEMA zone X (unshaded) · 0% chance over 30 yrs
- Wildfire 1/10 Low
- Heat 10/10 Extreme 7 d/yr ≥107°F today · 26 d/yr by 30 yrs out
- Wind 9/10 Extreme 99% chance of damaging wind over 30 yrs
- Air quality 1/10 Low 0 unhealthy d/yr today · 0 by 30 yrs out
Nearby sold comps map
Loading sold comps map…
Walkable amenities ~0.75 mi
Loading nearby amenities…
Taxation est. · year 1
- Rental income
- $19,494
- − Mortgage interest
- −$5,181
- − Property taxes
- −$1,387
- − Insurance
- −$462
- − Repairs & maintenance
- −$1,560
- − Management
- −$1,560
- − Depreciation
- −$2,691
- Taxable income
- $6,654
- Est. tax owed @ 24.0%
- −$1,597
- After-tax cash flow
- $6,133/yr
For passive investors: Depreciation is non-cash, so a rental often shows a tax loss while cash-flowing — sheltering income. Rental losses are passive: they offset passive income freely, and up to $25,000/yr can offset ordinary (W-2) income if you actively participate and your MAGI is under $100k (phasing out to $0 by $150k); unused losses carry forward. On sale, claimed depreciation is recaptured at up to 25%, and gains may owe capital-gains tax (a 1031 exchange can defer both). Figures are a year-1 estimate at your 24.0% rate — not tax advice; consult a CPA.
Schools (NCES district)
- District
- Corpus Christi ISD
- NCES district ID
- 4815270
- Math proficiency
- 31% ▼ -18.00%
- Reading proficiency
- 35% ▼ -7.00%
- Median HH income
- $45,672
- Composite
- 28.27/100
- National rank
- #6793
- State rank
- #562 of 826 in TX
Livability — Corpus Christi
- Score
- 78/100
- State rank
- #66
- US rank
- #2404
Category grades
Schools grade is shown separately in the Schools card above.
Census & demographics
- Census place
- Corpus Christi, TX
- County
- Nueces County · 296,836 people
- City population
- 296,836
- Metro
- Corpus Christi, TX
- Population (ZIP)
- 4,344
- Household income
- $40,841
- Rent vs Own
- Severe rent burden
- 336.0
Population outlook (Nueces County) Hauer SSP2
- Today (2025)
- 418,037 people
- By 2030
- 447,123 · +7.0%
- By 2040
- 505,911 · +21.0%
- By 2050
- 567,522 · +35.8%
- By 2075
- 729,686 · +74.6%
- By 2100
- 847,087 · +102.6%
Race, ethnicity, and origin ACS 2023
- Neighborhood character
- Diverse neighborhood (Simpson 0.62)
- Race & ethnicity
- Hispanic / Latino 46% White 38% Two or more races 27% Black 13% Native American 2%
- Hispanic origin (detail)
- Mexican 43%
- Common ancestry
- Slovak 2% Portuguese 1% Lithuanian 1%
- Foreign-born
- 7% · Canada, South Korea
- Languages at home
- 71% English-only · Spanish 27% French/Haitian/Cajun 1%
Political lean MEDSL · Nueces
- 2024 margin
- R (+11.5) · D 43.8% · R 55.3%
- 2008→2024 swing
- -7.1pp toward R · 2008: -4.4pp · 2024: -11.5pp
- All cycles
- 2024: R+11.5 2020: R+2.9 2016: R+1.5 2012: R+3.2 2008: R+4.4
Not yet ingested
- Civics
- —
Market trends
- HPI YoY
- ▲ 3.37%
- Current HPI
- 92.634
- Rent YoY
- ▲ 1.63%
- Metro
- Corpus Christi, TX
- State GDP YoY
- ▲ 3.95%
- F500 in state
- 110
Industry mix (Fortune 500 HQ in TX)
| Industry | F500 HQs | Revenue |
|---|---|---|
| Energy | 16 | $1,198B |
|
||
| Technology | 5 | $198B |
|
||
| Engineering / Construction | 4 | $72B |
|
||
| Energy Services | 3 | $60B |
|
||
| Utilities | 3 | $41B |
|
||
| Healthcare | 2 | $330B |
|
||
Price history
+105.5% since first listed10 events — show timeline
- 2026-05-14 Pending — CBMLS
- 2026-05-06 Delisted — CBMLS
- 2026-03-12 Listed $92,490 CBMLS
- 2021-11-02 Sold (Public Records) — Public Records
- 2008-03-28 Listed $492,000 CBMLS
- 2003-07-28 Sold (Public Records) $145,000 Public Records
- 2001-02-28 Sold (MLS) — CBMLS
- 2000-07-15 Listed $41,000 CBMLS
- 2000-03-15 Sold (MLS) — CBMLS
- 1999-06-29 Listed $45,000 CBMLS
Property tax history
+22.4%/yrLatest (2025): $5,412 · +22.1% YoY. Source: county tax records.
Cash-flow waterfall
monthlySold comps — $/sqft
last 12 mo · ≤1 miLoading sold comps…