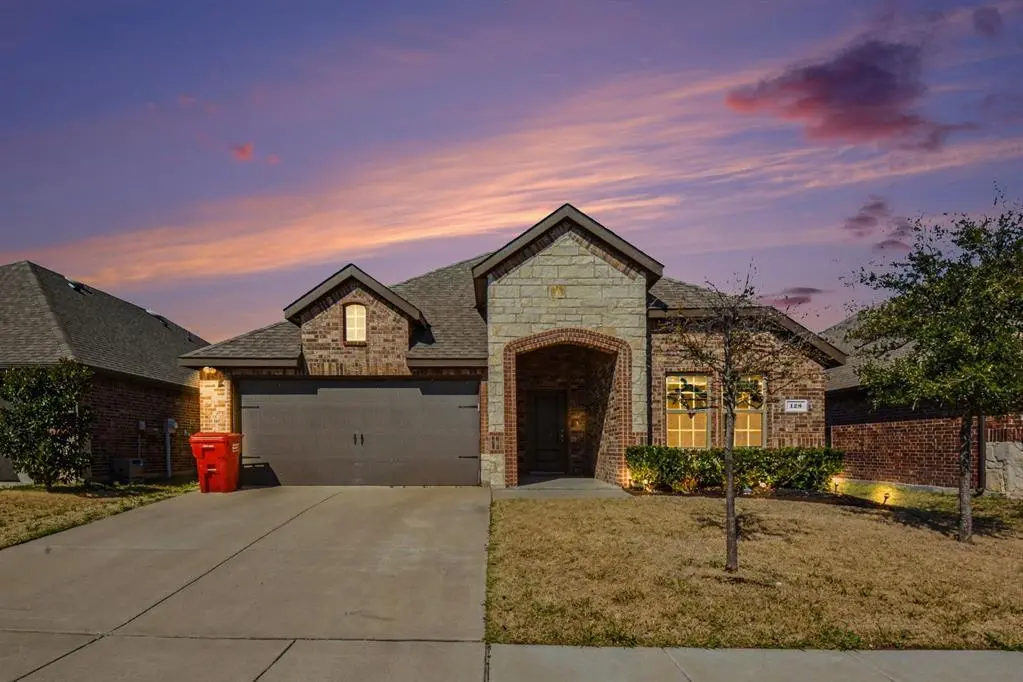
128 Newsom Dr · Royse City, TX
Flood risk 1/10 · Minimal
- FEMA flood zone
- X (unshaded)
- Chance of flooding over 30 yrs
- 0.0%
- Est. flood insurance / yr
- $507 – $1,088
Fire risk 2/10 · Minimal
- Est. fire insurance / yr
- $1,222 – $2,270
Heat risk 8/10 · Major
- Hot days now (above 110°F)
- 7 days/yr
- Hot days in 30 yrs
- 25 days/yr
Wind risk 6/10 · Moderate
- Chance of severe wind over 30 yrs
- 27.0%
Air-quality risk 2/10 · Minimal
- Unhealthy air days now
- 1 days/yr
- Unhealthy air days in 30 yrs
- 1 days/yr
Risk factors via First Street. Map © Google.
Why this score? — see what drove the D grade
The composite is a weighted blend of 9 inputs, each scored 0–100. Each bar is that input's sub-score; the figure is the points it added to the 100-point composite (weight × sub-score).
- ARV discount +15.0/15.0
- Cash flow +8.0/30.0
- Schools +3.8/10.0
- Livability +3.8/5.0
- Condition / age +3.8/5.0
- 1% rule +3.6/10.0
- Rent growth +2.2/5.0
- DSCR +2.1/10.0
- Appreciation +0.0/10.0
$260,000
🖨 Deal sheet (PDF) 📄 Offer letter ✓ Due diligence
Listing remarks MLS
Welcome to this beautifully maintained home in the heart of Royse City! This charming property offers the perfect combination of comfort, style, and functionality. Step inside to an inviting open-concept floor plan filled with natural light, featuring spacious living and dining areas ideal for everyday living or entertaining. The modern kitchen boasts stainless steel appliances, granite countertops, a large center island, and plenty of cabinet space. The primary suite provides a peaceful retreat with a luxurious ensuite bathroom that includes dual sinks, a soaking tub, and a separate shower. Additional bedrooms are generously sized and versatile for guests, a home office, or hobbies. Outside, enjoy a private fenced backyard with a covered patio—perfect for relaxing evenings or weekend gatherings. Conveniently located near top-rated Royse City ISD schools, parks, shopping, and dining, this home truly has it all. Don’t miss your chance to make it yours!
Key facts
- Large center island
- Modern kitchen
- Granite countertops
Tags
Neighborhood map
What this means for you Summary
Snapshot
- This is a 3-bed/2.0-bath single-family listed at $260k. Condition is rated good.
Deal economics
- At list price, monthly cash flow is $-264 ($-3k/yr) — negative.
- To cash-flow at today's rent, offer at most $213k (17.9% below list).
- To meet the 1% rule (rent ≥ 1% of price), the offer needs to be $224k (13.9% below list).
- Recommended offer: $213k (17.9% below list) — sets the bar for cash-flow.
- Cap rate 5.1% vs local median 4.2% in Royse City — meaningfully above typical; check what's discounted (condition, days-on-market, listing class) to confirm the premium yield is real.
Location & tenants
- Location reads 75/100 on livability (#158 in TX, #4,292 nationally) — a middle-class / working-renter tenant base. Strengths: crime A+, employment A+, housing A+; Watch: amenities F, commute F.
- Royse City ISD (rural): math 42% / reading 42% proficiency, ranked #266 of 826 in TX (top 32%) — families likely to look elsewhere, expect single-tenant / working-renter base with shorter leases.
- Zoned schools: W R (Bill) Fort El (math 51% / reading 36%, grade F, #1,269 of 4,322 statewide, top 30%, 614 students, 36% FRL); Ouida Baley Middle (math 32% / reading 35%, grade F, #911 of 1,662 statewide, top 56%, 934 students, 43% FRL); Royse City H S (math 38% / reading 55%, grade D-, #621 of 1,632 statewide, top 38%, 2,526 students, 37% FRL) — zoned schools at 38% FRL track the district average.
- Market conditions: Rents soft (-1.1%/yr); 1301 active listings in the ZIP; 39 comparable units currently listed for rent nearby; rentals at typical pace (median 24d on market — plan ~3-4 weeks tenant-placement turnaround); high-income renter base; 1,810 units permitted in Rockwall County in 2024 (0 in 5+ unit buildings).
Forward outlook
- Local home prices are declining (-3.0%/yr); year-one equity from $2k of loan paydown is wiped out by about $8k of value loss. Plan a longer hold.
- Rockwall County population projected at +56% by 2050 — long-run rental-demand tailwind backs the buy-and-hold thesis.
Negotiation context
- It's been on market 123 days — a 12% lower offer ($229k) is reasonable based on typical stale-listing flexibility.
Risks & watch-outs
- Climate carrying-cost: major wind risk, 27% chance of damaging wind over 30y; extreme-heat days projected 7→25/yr by 2055 (HVAC capex compounding) — expect insurance premiums to compound above CPI over the hold.
Questions for the listing agent
- What do current leases actually rent for vs. the listed asking? Can we see a recent rent roll and the last 12 months of T-12 income?
- It's been on market 123 days. Have you received any prior offers? Is the seller open to a 18% concession, seller financing, or rate buy-down credit?
- What does the HOA fee cover, when was the last increase, and are there any pending special assessments or reserve-fund shortfalls?
- Why hasn't it sold? Are there any deal-killer items the seller is aware of (foundation, flood, title, zoning, code violations)?
- Is there a deadline driving the sale (1031 exchange, divorce, estate, relocation)? That informs how much negotiation room exists.
- The area grade is low — what's the realistic commute time and amenity access for the typical tenant pool here? Any planned neighborhood developments (good or bad) we should know about?
- What's the average days-on-market for RENTAL listings here right now (not sales)? A rising rental-DOM trend means longer vacancies and softer asking-rent achievability than the comps imply.
- What's the recent tenant-quality profile in this submarket — average credit score on applications, eviction rate, late-payment / NSF rate, and stable-employment percentage? A property-management company in the area should have these aggregated.
- How much new for-sale + rental construction is in the pipeline within 1–3 miles? Heavy new supply typically softens prices + rents 12–24 months out; constrained supply supports both.
Investment metrics
- 1% rule
- 0.86% ✗
- Cap rate
- 5.07%
- Cash-on-cash
- -4.35%
- DSCR
- 0.81
- GRM
- 9.7
CMA / ARV
- ARV (median comp)
- $316,827
- List price
- $260,000
- Delta
- -17.94%
- Verdict
- UNDERPRICED
- Comps
- 20 within 1.0 mi
Show comp detail 12 sales within ~0.75 mi
| Address | Dist | Beds/Ba | Sqft | Sold | Price | $/sf | Match |
|---|---|---|---|---|---|---|---|
| 5015 Strait Way | 0.20mi | 3/2.0 | 1,598 (-1%) | 1mo | $313,490 | $196 | 88 |
| 504 Overlook Dr | 0.12mi | 3/2.0 | 1,642 (+2%) | 5mo | $289,000 | $176 | 87 |
| 3000 Spruce St | 0.31mi | 3/2.0 | 1,628 (+1%) | 1mo | $265,000 | $163 | 83 |
| 3025 Spruce St | 0.34mi | 3/2.0 | 1,599 (-1%) | 3mo | $259,000 | $162 | 80 |
| 5027 Strait Way | 0.18mi | 3/2.0 | 1,787 (+11%) | 3mo | $339,990 | $190 | 71 |
| 725 Orchid Blvd | 0.46mi | 3/2.0 | 1,558 (-3%) | 4mo | $230,000 | $148 | 70 |
| 307 Lilac View Ln | 0.20mi | 4/2.0 (+1) | 1,830 (+14%) | 1mo | $305,000 | $167 | 62 |
| 2909 Marsha Ln | 0.56mi | 3/2.0 | 1,702 (+6%) | 5mo | $250,000 | $147 | 61 |
| 3404 Oak Ln | 0.66mi | 3/2.0 | 1,678 (+4%) | 4mo | $299,900 | $179 | 59 |
| 1021 Peach St | 0.67mi | 3/2.0 | 1,529 (-5%) | 4mo | $239,000 | $156 | 57 |
| 2604 Spencer Cir | 0.52mi | 3/2.0 | 1,834 (+14%) | 4mo | $232,000 | $126 | 49 |
| 319 Jasmine Dr | 0.71mi | 3/2.0 | 1,843 (+14%) | 1mo | $328,900 | $178 | 42 |
Match score weights: distance 35% · size 25% · config 20% · recency 20%. Top-matched comps best support the ARV.
Projected returns pro-forma
-3.0% appreciation · 0.0% rent growth · sell at horizon
- IRR
- -27.5%
- Equity multiple
- 0.10×
- Total profit
- $-65,337
- Equity at exit
- $38,767
- IRR
- -45.1%
- Equity multiple
- -0.42×
- Total profit
- $-103,192
- Equity at exit
- $22,480
Cash invested: $72,800 (down + closing). Projections, not guarantees.
Landlord ↔ Tenant lean methodology
- Overall (STATE)
- 87 Strongly Landlord-Friendly
- State Texas
- 87 Strongly Landlord-Friendly · R+5
- County
- — inherits STATE
- City
- — inherits STATE
ZIP-level market 75189
- Home prices YoY
- -25.0%
- Rents YoY
- -1.1%
- Active inventory
- 1301
- Price-to-rent
- 9.7×
Monthly cashflow live
- Estimated rent
- $2,240 high interval (Pro) →
- Mortgage (P&I)
- −$1,363
- Tax from tax record
- −$514 /mo · $6,163/yr
- Insurance
- −$108
- HOA
- −$48
- Vacancy / Maint / Mgmt
- −$470
- Net cashflow
- $-264
Break-even live
Sensitivity live
| Price | -10% $-117 | -5% $-191 | +0% $-264 | +5% $-338 | +10% $-411 |
|---|---|---|---|---|---|
| Rent | -10% $-441 | -5% $-353 | +0% $-264 | +5% $-176 | +10% $-87 |
| Rate | -1.0pp $-133 | -0.5pp $-198 | base $-264 | +0.5pp $-331 | +1.0pp $-400 |
UW: 25.0% down · 7.5% · 30yr · 1.5% tax · 5.0% vac · 8.0% maint · 8.0% mgmt
Financing live
Cash to close
- Down payment
- $65,000
- Closing costs
- $7,800
- Reserves months
- —
- Total cash needed
- —
Loan-product check · same deal, 3 products live
Conventional
25% down · 7.5% · 30yr
- Down + closing
- —
- Monthly P&I
- —
- Monthly cashflow
- —
- DSCR
- —
- Eligible?
- —
Personal DTI + credit; lowest rate.
DSCR
20% down · 8.5% · 30yr
- Down + closing
- —
- Monthly P&I
- —
- Monthly cashflow
- —
- DSCR
- —
- Eligible?
- —
No personal income docs; deal must DSCR.
Hard money
10% down · 12.0% · 12mo
- Down + closing
- —
- Monthly P&I
- —
- Monthly cashflow
- —
- DSCR
- —
- Eligible?
- —
Short-term bridge; refi at stabilization.
Rent comps 39 comps
| Address | Beds | Baths | Sqft | Rent | $/sqft | DOM | Units | Dist |
|---|---|---|---|---|---|---|---|---|
| 3136 Overlook Dr Royse City, TX | 4.0 | 2.0 | 2046 | $2,295 | $1.12 | 45d | 1 | 0.16mi |
| 3136 Overlook Dr Royse City, TX | 4.0 | 2.0 | 2046 | $2,295 | $1.12 | 5d | 1 | 0.16mi |
| 3140 Overlook Dr Royse City, TX | 4.0 | 2.0 | 1866 | $2,200 | $1.18 | 45d | 1 | 0.17mi |
| 523 Francis Ln Royse City, TX | 4.0 | 3.0 | 2029 | $2,299 | $1.13 | 45d | 1 | 0.22mi |
| 3213 Shady River Trl Royse City, TX | 3.0 | 2.0 | 1858 | $1,849 | $1.00 | 24d | 1 | 0.27mi |
| 208 Sunny Corner Rd Royse City, TX | 3.0 | 2.0 | 1780 | $1,695 | $0.95 | 21d | 1 | 0.27mi |
| 3108 Overstreet Ln Royse City, TX | 3.0 | 2.0 | 1680 | $1,899 | $1.13 | 5d | 1 | 0.34mi |
| 725 Orchid Blvd Royse City, TX | 3.0 | 2.0 | 1558 | $1,795 | $1.15 | 45d | 1 | 0.43mi |
| 2031 Roaring Fork Dr Royse City, TX | 3.0 | 2.0 | 1861 | $2,495 | $1.34 | 7d | 1 | 0.45mi |
| 712 Preston Dr Royse City, TX | 4.0 | 2.0 | 1965 | $1,895 | $0.96 | 5d | 1 | 0.48mi |
| 3178 Wind Knot Way Royse City, TX | 3.0 | 2.0 | 1798 | $2,150 | $1.20 | 17d | 1 | 0.50mi |
| 2909 Marsha Ln Royse City, TX | 3.0 | 2.0 | 1702 | $2,900 | $1.70 | 4d | 1 | 0.53mi |
| 917 Orchid Blvd Royse City, TX | 3.0 | 2.0 | 1628 | $1,895 | $1.16 | 45d | 1 | 0.58mi |
| 2704 Redwood St Royse City, TX | 4.0 | 2.0 | 1760 | $1,850 | $1.05 | 24d | 1 | 0.60mi |
| 2701 Redwood St Royse City, TX | 3.0 | 2.0 | 1816 | $2,100 | $1.16 | 7d | 1 | 0.63mi |
| 1021 Peach St Royse City, TX | 3.0 | 2.0 | 1530 | $1,200 | $0.78 | 45d | 1 | 0.64mi |
| 426 Oleander Dr Fate, TX | 3.0 | 2.0 | 2126 | $2,495 | $1.17 | 26d | 1 | 0.68mi |
| 7015 Hopper Ct Royse City, TX | 4.0 | 2.5 | 2198 | $2,300 | $1.05 | 45d | 1 | 0.68mi |
| 4023 Anglers Way Royse City, TX | 4.0 | 3.5 | 2122 | $2,900 | $1.37 | 7d | 1 | 0.69mi |
| 430 Oleander Dr Fate, TX | 3.0 | 2.0 | 2039 | $2,350 | $1.15 | 45d | 1 | 0.69mi |
| 207 Gardenia Dr Royse City, TX | 3.0 | 2.0 | 1830 | $2,195 | $1.20 | 26d | 1 | 0.73mi |
| 513 Redbud Dr Royse City, TX | 3.0 | 2.0 | 1830 | $2,050 | $1.12 | 45d | 1 | 0.79mi |
| 525 Redbud Dr Royse City, TX | 3.0 | 2.0 | 2147 | $2,395 | $1.12 | 45d | 1 | 0.83mi |
| 552 Firethorn Dr Royse City, TX | 3.0 | 2.0 | 1830 | $2,350 | $1.28 | 1d | 1 | 0.86mi |
| 4005 Bailey Way Royse City, TX | 4.0 | 3.0 | 2036 | $2,250 | $1.11 | 4d | 1 | 0.88mi |
| 1204 Cedar Cove Pl Royse City, TX | 3.0 | 2.0 | 1450 | $1,925 | $1.33 | 26d | 1 | 0.96mi |
| 3105 Oak Crest Dr Royse City, TX | 3.0 | 2.0 | 1864 | $1,929 | $1.03 | 24d | 1 | 1.04mi |
| 3270 Timineri Ln Royse City, TX | 4.0 | 2.5 | 2239 | $2,500 | $1.12 | 0d | 1 | 1.07mi |
| 1328 River Oak Ln Royse City, TX | 4.0 | 2.0 | 2196 | $2,400 | $1.09 | 5d | 1 | 1.13mi |
| 1309 Honeywood Ln Royse City, TX | 3.0 | 2.0 | 1514 | $1,746 | $1.15 | 1d | 1 | 1.22mi |
| 1225 Alder Tree Ln Royse City, TX | 3.0 | 2.5 | 2181 | $2,000 | $0.92 | 5d | 1 | 1.27mi |
| 1125 Silver Maple Ln Royse City, TX | 3.0 | 2.0 | 1590 | $1,895 | $1.19 | 26d | 1 | 1.32mi |
| 1125 Silver Maple Ln Royse City, TX | 3.0 | 2.0 | 1444 | $1,895 | $1.31 | 45d | 1 | 1.32mi |
| 1312 Silver Maple Ln Royse City, TX | 3.0 | 2.5 | 1406 | $1,695 | $1.21 | 45d | 1 | 1.36mi |
| 1004 Basswood Ln Royse City, TX | 4.0 | 2.0 | 2097 | $1,995 | $0.95 | 17d | 1 | 1.38mi |
| 2113 Tulipwood Dr Royse City, TX | 4.0 | 2.0 | 1857 | $2,075 | $1.12 | 4d | 1 | 1.42mi |
| 2124 Tulipwood Dr Royse City, TX | 4.0 | 2.0 | 1703 | $2,200 | $1.29 | 21d | 1 | 1.43mi |
| 1817 Acacia Dr Royse City, TX | 4.0 | 3.0 | 2118 | $2,000 | $0.94 | 16d | 1 | 1.45mi |
| 2133 Tulipwood Dr Royse City, TX | 4.0 | 2.0 | 1770 | $2,295 | $1.30 | 45d | 1 | 1.47mi |
HOA detail
- Monthly dues
- $48 · $576/yr
Listing history 18 events
-
2026-06-21pricedays on market $260,000 Active 123 DOM
-
2026-06-18days on market $265,000 Active 120 DOM
-
2026-06-17days on market $265,000 Active 119 DOM
-
2026-06-16days on market $265,000 Active 118 DOM
-
2026-06-15days on market $265,000 Active 117 DOM
-
2026-06-13days on market $265,000 Active 115 DOM
-
2026-06-09days on market $265,000 Active 111 DOM
-
2026-06-08days on market $265,000 Active 110 DOM
-
2026-06-07days on market $265,000 Active 109 DOM
-
2026-06-04days on market $265,000 Active 106 DOM
-
2026-06-03days on market $265,000 Active 105 DOM
-
2026-06-02days on market $265,000 Active 104 DOM
-
2026-06-01days on market $265,000 Active 103 DOM
-
2026-05-31days on market $265,000 Active 102 DOM
-
2026-05-11price $270,000 977-char remark
Show marketing remark (977 chars)
Welcome to this beautifully maintained home in the heart of Royse City! This charming property offers the perfect combination of comfort, style, and functionality. Step inside to an inviting open-concept floor plan filled with natural light, featuring spacious living and dining areas ideal for everyday living or entertaining. The modern kitchen boasts stainless steel appliances, granite countertops, a large center island, and plenty of cabinet space. The primary suite provides a peaceful retreat with a luxurious ensuite bathroom that includes dual sinks, a soaking tub, and a separate shower. Additional bedrooms are generously sized and versatile for guests, a home office, or hobbies. Outside, enjoy a private fenced backyard with a covered patio—perfect for relaxing evenings or weekend gatherings. Conveniently located near top-rated Royse City ISD schools, parks, shopping, and dining, this home truly has it all. Don’t miss your chance to make it yours!
-
2026-04-05price $285,000 977-char remark
Show marketing remark (977 chars)
Welcome to this beautifully maintained home in the heart of Royse City! This charming property offers the perfect combination of comfort, style, and functionality. Step inside to an inviting open-concept floor plan filled with natural light, featuring spacious living and dining areas ideal for everyday living or entertaining. The modern kitchen boasts stainless steel appliances, granite countertops, a large center island, and plenty of cabinet space. The primary suite provides a peaceful retreat with a luxurious ensuite bathroom that includes dual sinks, a soaking tub, and a separate shower. Additional bedrooms are generously sized and versatile for guests, a home office, or hobbies. Outside, enjoy a private fenced backyard with a covered patio—perfect for relaxing evenings or weekend gatherings. Conveniently located near top-rated Royse City ISD schools, parks, shopping, and dining, this home truly has it all. Don’t miss your chance to make it yours!
-
2026-02-18$295,000 Active 977-char remark
Show marketing remark (977 chars)
Welcome to this beautifully maintained home in the heart of Royse City! This charming property offers the perfect combination of comfort, style, and functionality. Step inside to an inviting open-concept floor plan filled with natural light, featuring spacious living and dining areas ideal for everyday living or entertaining. The modern kitchen boasts stainless steel appliances, granite countertops, a large center island, and plenty of cabinet space. The primary suite provides a peaceful retreat with a luxurious ensuite bathroom that includes dual sinks, a soaking tub, and a separate shower. Additional bedrooms are generously sized and versatile for guests, a home office, or hobbies. Outside, enjoy a private fenced backyard with a covered patio—perfect for relaxing evenings or weekend gatherings. Conveniently located near top-rated Royse City ISD schools, parks, shopping, and dining, this home truly has it all. Don’t miss your chance to make it yours!
-
2026-01-30soldstatus
ⓘ Source: listings_history table (triggers on properties + properties_extension) + one-shot
backfill from property_details.listing_events for pre-trigger history.
Tax reassessment forecast TX · Resets to sale price
- Current annual tax
- $6,163 · $514/mo
- Projected year-2 tax
- $6,163 · $514/mo
- Expected delta
- $0/yr ($0/mo · 0.0%)
ⓘ Screening estimate from a state-policy table — verify with the county assessor before closing.
Climate risk First Street
- Flood 1/10 Low FEMA zone X (unshaded) · 0% chance over 30 yrs
- Wildfire 2/10 Low
- Heat 8/10 Severe 7 d/yr ≥110°F today · 25 d/yr by 30 yrs out
- Wind 6/10 Major 27% chance of damaging wind over 30 yrs
- Air quality 2/10 Low 1 unhealthy d/yr today · 1 by 30 yrs out
Nearby sold comps map
Loading sold comps map…
Walkable amenities ~0.75 mi
Loading nearby amenities…
Taxation est. · year 1
- Rental income
- $26,875
- − Mortgage interest
- −$14,564
- − Property taxes
- −$6,163
- − Insurance
- −$1,300
- − Repairs & maintenance
- −$2,150
- − Management
- −$2,150
- − HOA
- −$576
- − Depreciation
- −$7,564
- Taxable loss
- −$7,592
- Est. tax savings @ 24.0%
- +$1,822
- After-tax cash flow
- $-1,347/yr
For passive investors: Depreciation is non-cash, so a rental often shows a tax loss while cash-flowing — sheltering income. Rental losses are passive: they offset passive income freely, and up to $25,000/yr can offset ordinary (W-2) income if you actively participate and your MAGI is under $100k (phasing out to $0 by $150k); unused losses carry forward. On sale, claimed depreciation is recaptured at up to 25%, and gains may owe capital-gains tax (a 1031 exchange can defer both). Figures are a year-1 estimate at your 24.0% rate — not tax advice; consult a CPA.
Condition & rehab AI · 3 photos
This well-maintained single-family home in Royse City offers a good condition with a modern kitchen and a luxurious primary suite. It is ready for a cosmetic upgrade to enhance its curb appeal and value.
Value-add opportunities
- Both Paint exterior walls — Enhances curb appeal and can increase both resale and rental value.
- Both Clean gutters — Improves drainage and can prevent water damage, enhancing both resale and rental value.
Renovation cost estimate screening
Value-add ROI direction
- Both Paint exterior walls — Enhances curb appeal and can increase both resale and rental value. ↑
- Both Clean gutters — Improves drainage and can prevent water damage, enhancing both resale and rental value. ↑
ⓘ Cost ranges are severity-bucket heuristics (US national rule-of-thumb). Get contractor quotes + a written scope before underwriting a rehab budget.
Schools (NCES district)
- District
- Royse City ISD
- NCES district ID
- 4838220
- Math proficiency
- 42% ▼ -10.00%
- Reading proficiency
- 42% ▼ -5.00%
- Median HH income
- $73,810
- Composite
- 38.44/100
- National rank
- #4197
- State rank
- #266 of 826 in TX
Livability — Royse City
- Score
- 75/100
- State rank
- #158
- US rank
- #4292
Category grades
Schools grade is shown separately in the Schools card above.
Census & demographics
- Census place
- Royse City, TX
- County
- Rockwall County · 132,930 people
- City population
- 48,739
- Metro
- Dallas-Fort Worth-Arlington, TX
- Population (ZIP)
- 48,739
- Household income
- $117,125
- Rent vs Own
- Severe rent burden
- 569.0
Population outlook (Rockwall County) Hauer SSP2
- Today (2025)
- 118,396 people
- By 2030
- 132,209 · +11.7%
- By 2040
- 159,538 · +34.7%
- By 2050
- 185,299 · +56.5%
- By 2075
- 243,489 · +105.7%
- By 2100
- 277,814 · +134.6%
Race, ethnicity, and origin ACS 2023
- Neighborhood character
- Diverse neighborhood (Simpson 0.57)
- Race & ethnicity
- White 60% Hispanic / Latino 25% Two or more races 12% Black 10% Asian 2%
- Hispanic origin (detail)
- Mexican 20%
- Common ancestry
- Slovak 2% Serbian 1% Lithuanian 1%
- Foreign-born
- 10% · Canada, Philippines, Jamaica
- Languages at home
- 80% English-only · Spanish 15% Other Indo-European 1%
Political lean MEDSL · Rockwall
- 2024 margin
- Solid R (+40.9) · D 29.1% · R 70.0%
- 2008→2024 swing
- +5.3pp toward D · 2008: -46.2pp · 2024: -40.9pp
- All cycles
- 2024: R+40.9 2020: R+37.7 2016: R+47.5 2012: R+53.3 2008: R+46.2
Not yet ingested
- Civics
- —
Market trends
- HPI YoY
- ▼ -71.10%
- Current HPI
- 212.8422
- Rent YoY
- ▼ -1.13%
- Metro
- Dallas-Fort Worth-Arlington, TX
- State GDP YoY
- ▲ 3.95%
- F500 in state
- 110
Industry mix (Fortune 500 HQ in TX)
| Industry | F500 HQs | Revenue |
|---|---|---|
| Energy | 16 | $1,198B |
|
||
| Technology | 5 | $198B |
|
||
| Engineering / Construction | 4 | $72B |
|
||
| Energy Services | 3 | $60B |
|
||
| Utilities | 3 | $41B |
|
||
| Healthcare | 2 | $330B |
|
||
Price history
-8.5% since first listed4 events — show timeline
- 2026-05-11 Price Changed $270,000 NTREIS
- 2026-04-05 Price Changed $285,000 NTREIS
- 2026-02-18 Listed $295,000 NTREIS
- 2026-01-30 Sold (Public Records) — Public Records
Property tax history
+47.7%/yrLatest (2025): $6,163 · +0.8% YoY. Source: county tax records.
Cash-flow waterfall
monthlySold comps — $/sqft
last 12 mo · ≤1 miLoading sold comps…