 🏢 Co-op
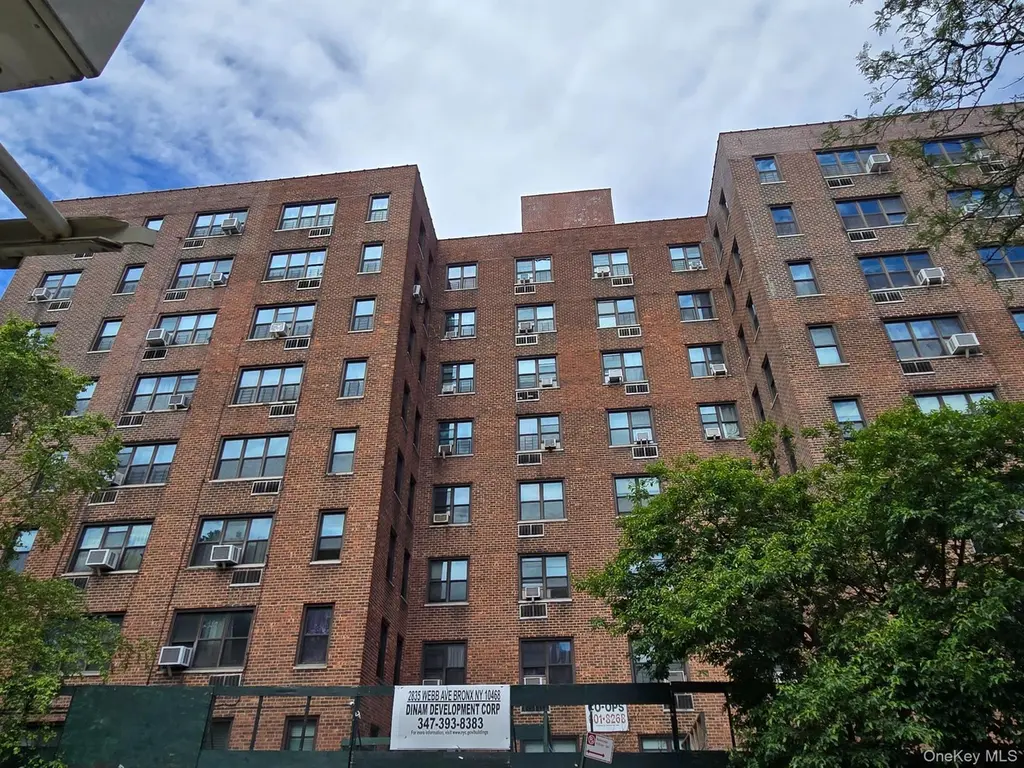
2835 Webb Ave Unit 2J · New York, NY
Flood risk No data
- FEMA flood zone
- —
- Chance of flooding over 30 yrs
- %
- Est. flood insurance / yr
- —
Fire risk No data
- Est. fire insurance / yr
- —
Heat risk No data
- Hot days now (above °F)
- days/yr
- Hot days in 30 yrs
- days/yr
Wind risk No data
- Chance of severe wind over 30 yrs
- %
Air-quality risk No data
- Unhealthy air days now
- days/yr
- Unhealthy air days in 30 yrs
- days/yr
Risk factors via First Street. Map © Google.
Why this score? — see what drove the A grade
The composite is a weighted blend of 9 inputs, each scored 0–100. Each bar is that input's sub-score; the figure is the points it added to the 100-point composite (weight × sub-score).
- Cash flow +30.0/30.0
- ARV discount +15.0/15.0
- DSCR +10.0/10.0
- 1% rule +9.6/10.0
- Appreciation +5.3/10.0
- Schools +5.0/10.0
- Rent growth +4.2/5.0
- Livability +3.8/5.0
- Condition / age +2.5/5.0
$149,900
🖨 Deal sheet (PDF) 📄 Offer letter ✓ Due diligence
Listing remarks
SPONSOR UNIT – NO BOARD APPROVAL REQUIRED 20% Down Welcome to 2835 Webb Avenue, located in the vibrant Kingsbridge section of the Bronx. This spacious one-bedroom apartment features an eat-in kitchen, an inviting entry foyer, a generously sized living room, and beautiful parquet flooring throughout. You'll appreciate the excellent closet space and the fresh paint, including a newly painted building foyer. Conveniently situated near public transportation, parks, restaurants, shops, and several colleges and universities. Parking is available via a waitlist. Common laundry.
Key facts
- Garage
- Built 1959
- Listed 8 days
Neighborhood map
What this means for you Summary
Snapshot
- This is a 1-bed/1.0-bath townhouse listed at $150k.
Deal economics
- At list price, monthly cash flow is $698 ($8k/yr) — positive.
- The deal already cash-flows at list — no discount required.
- Meets the 1% rule at list price ($2k rent vs $150k).
- Cap rate 11.9% vs local median 2.6% in New York — top-decile yield for the area; either an underpriced asset or a hidden risk that comps aren't pricing in. Stress-test before assuming the spread holds.
Location & tenants
- Location reads 75/100 on livability (#268 in NY, #4,188 nationally) — a middle-class / working-renter tenant base. Strengths: amenities A+, commute A+, health & safety A; Watch: crime F, cost of living F.
- Market conditions: Rents rising fast (+6.7%/yr); 122 active listings in the ZIP; 1 comparable units currently listed for rent nearby; 6,929 units permitted in Bronx County in 2024 (6,829 in 5+ unit buildings).
- At $2,195/mo this rent would consume 57% of the median local household income ($46k/yr) (locally 9659% of renters already pay >50% of income on rent) — very limited rent-growth headroom before tenants either downsize or default.
Forward outlook
- In year one you build about $2k of equity ($1k loan paydown + $755 appreciation (0.5% local appreciation)).
- Bronx County population projected at +21% by 2050 — long-run rental-demand tailwind backs the buy-and-hold thesis.
- At projected returns (0.5% appreciation + 6.7% rent growth), your $42k cash investment doubles in ~4 years — after that, you're playing with house money.
Negotiation context
- Only 8 days on market — expect competitive offers; lowballing is unlikely to land.
Risks & watch-outs
- Watch-outs: built in 1959 — expect roof / HVAC / electrical / plumbing capex.
Questions for the listing agent
- Built in 1959 — when were the roof, HVAC, electrical panel, plumbing, and water heater last replaced?
- Is there a deadline driving the sale (1031 exchange, divorce, estate, relocation)? That informs how much negotiation room exists.
- Schools are B-rated — typically a magnet for longer-tenancy family renters. What's the average tenant stay here, and is there a school-zone premium baked into asking?
- Crime grade is F in this area — have there been break-ins, vandalism, or insurance claims at this property in the last 3 years? What carrier currently insures it and at what premium?
- What's the average days-on-market for RENTAL listings here right now (not sales)? A rising rental-DOM trend means longer vacancies and softer asking-rent achievability than the comps imply.
- What's the recent tenant-quality profile in this submarket — average credit score on applications, eviction rate, late-payment / NSF rate, and stable-employment percentage? A property-management company in the area should have these aggregated.
- How much new for-sale + rental construction is in the pipeline within 1–3 miles? Heavy new supply typically softens prices + rents 12–24 months out; constrained supply supports both.
Investment metrics
- 1% rule
- 1.46% ✓
- Cap rate
- 11.88%
- Cash-on-cash
- 19.97%
- DSCR
- 1.89
- GRM
- 5.7
CMA / ARV
- ARV (on-the-fly)
- $181,041
- Comps found
- 12
Show comp detail 12 sales within ~0.75 mi
| Address | Dist | Beds/Ba | Sqft | Sold | Price | $/sf | Match |
|---|---|---|---|---|---|---|---|
| 2630 Kingsbridge Ter Unit 6B | 0.31mi | 1/1.0 | 750 (-4%) | 4mo | $140,000 | $187 | 76 |
| 2860 Bailey Ave Unit 4F | 0.21mi | 1/1.0 | 700 (-10%) | 2mo | $149,000 | $213 | 72 |
| 3123 Bailey Ave Unit 4A | 0.42mi | 1/1.0 | 750 (-4%) | 4mo | $175,000 | $233 | 71 |
| 2685 Creston Ave Unit 2-L | 0.48mi | 1/1.0 | 750 (-4%) | 2mo | $165,000 | $220 | 70 |
| 7 Fordham Hl Unit 15D | 0.64mi | 1/1.0 | 750 (-4%) | 1mo | $165,000 | $220 | 64 |
| 9 Fordham Hill Oval Unit 112E | 0.71mi | 1/1.0 | 800 (+3%) | 2mo | $170,000 | $213 | 61 |
| 2685 Creston Ave Unit 1-M | 0.48mi | 1/1.0 | 700 (-10%) | 1mo | $149,000 | $213 | 60 |
| 2750 Johnson Ave Unit 3H | 0.75mi | 1/1.0 | 800 (+3%) | 1mo | $210,000 | $263 | 60 |
| 2750 Johnson Ave Unit 7G | 0.75mi | 2/1.0 (+1) | 755 (-3%) | 0mo | $317,500 | $421 | 55 |
| 2506 Davidson Ave Unit 3C | 0.59mi | 2/1.0 (+1) | 862 (+11%) | 3mo | $275,000 | $319 | 47 |
| 55 E 190 St #56 | 0.66mi | 1/1.0 | 887 (+14%) | 2mo | $209,000 | $236 | 44 |
| 3850 Sedgwick Ave Unit 11A | 0.73mi | 2/1.0 (+1) | 850 (+9%) | 3mo | $259,000 | $305 | 43 |
Match score weights: distance 35% · size 25% · config 20% · recency 20%. Top-matched comps best support the ARV.
Projected returns pro-forma
0.5% appreciation · 6.7% rent growth · sell at horizon
- IRR
- 24.1%
- Equity multiple
- 2.24×
- Total profit
- $52,190
- Equity at exit
- $47,340
- IRR
- 29.7%
- Equity multiple
- 4.91×
- Total profit
- $164,200
- Equity at exit
- $60,045
Cash invested: $41,972 (down + closing). Projections, not guarantees.
Landlord ↔ Tenant lean methodology
- Overall (CITY)
- 0 Strongly Tenant-Friendly
- State New York
- 15 Strongly Tenant-Friendly · D+10
- County
- — inherits STATE
- City New York
- 0 Strongly Tenant-Friendly · D+34
ZIP-level market 10468
- Home prices YoY
- 0.2%
- Rents YoY
- 6.7%
- Active inventory
- 122
- Price-to-rent
- 5.7×
Monthly cashflow live
- Estimated rent
- $2,195 medium interval (Pro) →
- Mortgage (P&I)
- −$786
- Tax est. 1.5%
- −$187 /mo · $2,248/yr
- Insurance
- −$62
- HOA
- −$0
- Vacancy / Maint / Mgmt
- −$461
- Net cashflow
- $698
Break-even live
Sensitivity live
| Price | -10% $802 | -5% $750 | +0% $698 | +5% $647 | +10% $595 |
|---|---|---|---|---|---|
| Rent | -10% $525 | -5% $612 | +0% $698 | +5% $785 | +10% $872 |
| Rate | -1.0pp $774 | -0.5pp $737 | base $698 | +0.5pp $660 | +1.0pp $620 |
UW: 25.0% down · 7.5% · 30yr · 1.5% tax · 5.0% vac · 8.0% maint · 8.0% mgmt
Financing live
Cash to close
- Down payment
- $37,475
- Closing costs
- $4,497
- Reserves months
- —
- Total cash needed
- —
Loan-product check · same deal, 3 products live
Conventional
25% down · 7.5% · 30yr
- Down + closing
- —
- Monthly P&I
- —
- Monthly cashflow
- —
- DSCR
- —
- Eligible?
- —
Personal DTI + credit; lowest rate.
DSCR
20% down · 8.5% · 30yr
- Down + closing
- —
- Monthly P&I
- —
- Monthly cashflow
- —
- DSCR
- —
- Eligible?
- —
No personal income docs; deal must DSCR.
Hard money
10% down · 12.0% · 12mo
- Down + closing
- —
- Monthly P&I
- —
- Monthly cashflow
- —
- DSCR
- —
- Eligible?
- —
Short-term bridge; refi at stabilization.
Rent comps 1 comps
| Address | Beds | Baths | Sqft | Rent | $/sqft | DOM | Units | Dist |
|---|---|---|---|---|---|---|---|---|
| 2600 Netherland Ave Bronx, NY | 1.0–3.0 | 1.0–2.5 | 1132 | $2,775 | $2.45 | 22d | 3 | 0.83mi |
Listing history 2 events
-
2026-06-18remarks 578-char remark
-
2026-06-18$149,900 Pending 8 DOM
ⓘ Source: listings_history table (triggers on properties + properties_extension) + one-shot
backfill from property_details.listing_events for pre-trigger history.
Nearby sold comps map
Loading sold comps map…
Walkable amenities ~0.75 mi
Loading nearby amenities…
Taxation est. · year 1
- Rental income
- $26,344
- − Mortgage interest
- −$8,397
- − Property taxes
- −$2,248
- − Insurance
- −$750
- − Repairs & maintenance
- −$2,108
- − Management
- −$2,108
- − Depreciation
- −$4,361
- Taxable income
- $6,374
- Est. tax owed @ 24.0%
- −$1,530
- After-tax cash flow
- $6,851/yr
For passive investors: Depreciation is non-cash, so a rental often shows a tax loss while cash-flowing — sheltering income. Rental losses are passive: they offset passive income freely, and up to $25,000/yr can offset ordinary (W-2) income if you actively participate and your MAGI is under $100k (phasing out to $0 by $150k); unused losses carry forward. On sale, claimed depreciation is recaptured at up to 25%, and gains may owe capital-gains tax (a 1031 exchange can defer both). Figures are a year-1 estimate at your 24.0% rate — not tax advice; consult a CPA.
Schools (NCES district)
No district data.
Livability — New York
- Score
- 75/100
- State rank
- #268
- US rank
- #4188
Category grades
Schools grade is shown separately in the Schools card above.
Census & demographics
- Census place
- New York, NY
- County
- Bronx County · 1,197,324 people
- City population
- 7,731,280
- Metro
- New York-Newark-Jersey City, NY-NJ-PA
- Population (ZIP)
- 75,557
- Household income
- $46,233
- Rent vs Own
- Severe rent burden
- 9659.0
Population outlook (Bronx County) Hauer SSP2
- Today (2025)
- 1,607,353 people
- By 2030
- 1,681,852 · +4.6%
- By 2040
- 1,824,421 · +13.5%
- By 2050
- 1,945,470 · +21.0%
- By 2075
- 2,187,887 · +36.1%
- By 2100
- 2,244,136 · +39.6%
Race, ethnicity, and origin ACS 2023
- Neighborhood character
- Predominantly Hispanic (76%)
- Race & ethnicity
- Hispanic / Latino 76% Black 17% Two or more races 15% White 3% Asian 2% Native American 2%
- Hispanic origin (detail)
- Mexican 10% Puerto Rican 11% Dominican 45%
- Common ancestry
- Hispanic 1%
- Foreign-born
- 46% · Canada, Vietnam, Jamaica
- Languages at home
- 22% English-only · Spanish 69% French/Haitian/Cajun 1% Other Indo-European 1%
Political lean MEDSL · Bronx
- 2024 margin
- Solid D (+45.4) · D 72.7% · R 27.3%
- 2008→2024 swing
- -32.3pp toward R · 2008: 77.8pp · 2024: 45.4pp
- All cycles
- 2024: D+45.4 2020: D+67.6 2016: D+79.1 2012: D+82.9 2008: D+77.8
Not yet ingested
- Civics
- —
Market trends
- HPI YoY
- ▲ 0.50%
- Current HPI
- 249.8923
- Rent YoY
- ▲ 6.70%
- Metro
- New York-Newark-Jersey City, NY-NJ-PA
- State GDP YoY
- ▲ 2.60%
- F500 in state
- 92
Industry mix (Fortune 500 HQ in NY)
| Industry | F500 HQs | Revenue |
|---|---|---|
| Financial Services | 10 | $950B |
|
||
| Consumer Goods | 9 | $162B |
|
||
| Insurance | 4 | $225B |
|
||
| Telecommunications | 2 | $144B |
|
||
| Pharmaceuticals | 2 | $112B |
|
||
| Media / Entertainment | 2 | $69B |
|
||
Cash-flow waterfall
monthlySold comps — $/sqft
last 12 mo · ≤1 miLoading sold comps…