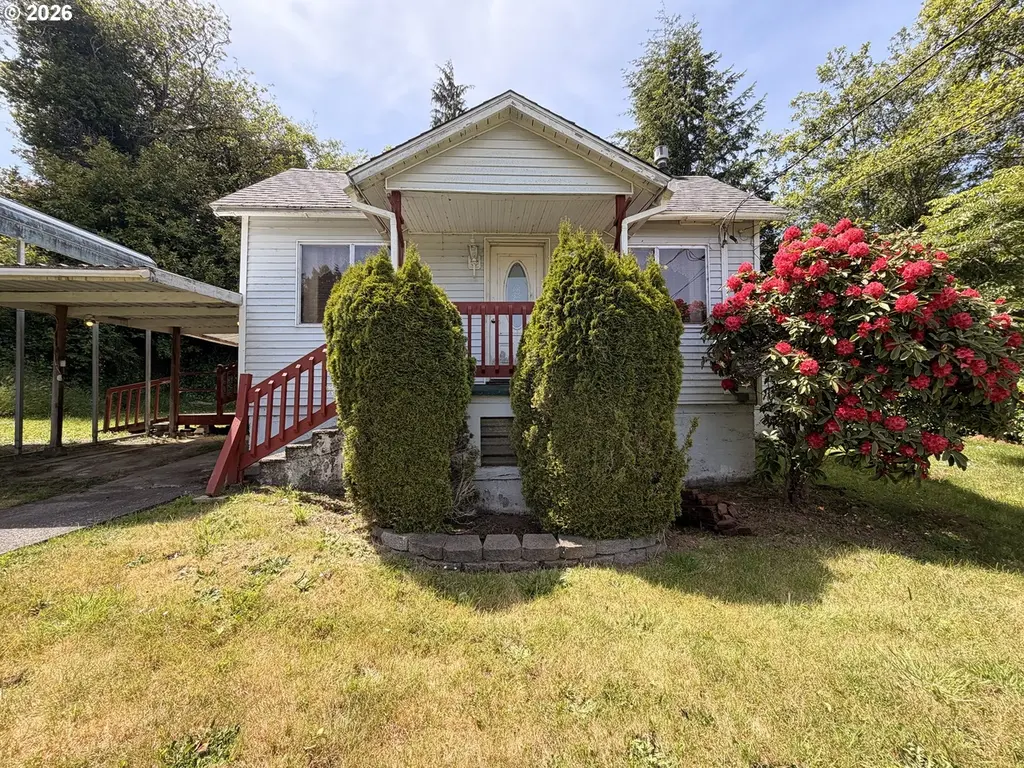
63554 Dusty Rd · Bunker Hill, OR
Flood risk 1/10 · Minimal
- FEMA flood zone
- X (unshaded)
- Chance of flooding over 30 yrs
- 0.0%
- Est. flood insurance / yr
- $507 – $1,088
Fire risk 1/10 · Minimal
- Est. fire insurance / yr
- $498 – $926
Heat risk 1/10 · Minimal
- Hot days now (above 78°F)
- 7 days/yr
- Hot days in 30 yrs
- 21 days/yr
Wind risk 1/10 · Minimal
- Chance of severe wind over 30 yrs
- —
Air-quality risk 6/10 · Moderate
- Unhealthy air days now
- 9 days/yr
- Unhealthy air days in 30 yrs
- 9 days/yr
Risk factors via First Street. Map © Google.
Why this score? — see what drove the B- grade
The composite is a weighted blend of 9 inputs, each scored 0–100. Each bar is that input's sub-score; the figure is the points it added to the 100-point composite (weight × sub-score).
- Cash flow +25.0/30.0
- ARV discount +15.0/15.0
- DSCR +8.1/10.0
- 1% rule +6.1/10.0
- Rent growth +4.7/5.0
- Livability +3.4/5.0
- Schools +2.5/10.0
- Condition / age +2.5/5.0
- Appreciation +0.0/10.0
$130,000
🖨 Deal sheet 📄 Offer letter ✓ Due diligence
Listing remarks
Tucked away with beautiful river views and just a short drive to the ocean, this one-bedroom, one-bath fixer offers endless potential for the right buyer. Featuring covered RV parking and plenty of opportunity to make it your own, this property is perfect for a getaway retreat, investment project, or full-time living with a little vision and TLC. Enjoy peaceful surroundings, scenic views, and the charm of coastal living at an affordable price point.
Key facts
- Covered rv parking
- Scenic views
- River views
Tags
Property features AI
Finance
- Other: Property condition: fixer; Main level area reported as 976 (assessor); Lot roughly 0.2 acre (7,000–9,999 sq ft range); Not a land lease
Exterior
- Parking: Carport (2 spaces); Driveway; RV parking available; Total parking for 2 vehicles
- Utilities: Public water; Public sewer; Electricity and propane fuel available
- Home design: Single-family residence (residential); Main living area on main level; Built in 1926; Views of river, territorial, and valley
- Construction: Composition roof; Concrete perimeter and pillar/post/pier foundation; Wood siding; Year built 1926
- Exterior features: Covered deck and deck; Porch; Yard; RV parking; Patio with sliding doors; Wood siding; Level lot; Dirt road access
Interior
- Kitchen: Pantry; Free-standing range; Free-standing refrigerator
- Bedrooms: Primary bedroom on main level with deck, sliding doors, closet, and wall-to-wall carpet
- Flooring: Wall-to-wall carpet
- Bathrooms: One full bathroom on the main level
- Heating & cooling: Wall heater; Other heating (propane listed as fuel); No central cooling
- Interior features: Laundry area; Wall-to-wall carpet; Ceiling fan in living room; Walk-in shower (accessibility feature); Propane fireplace; Aluminum window frames; Crawl space basement with dirt floor and storage space
- Laundry & utility: Main-level laundry
Neighborhood map
What this means for you Summary
Snapshot
- This is a 1-bed/1.0-bath single-family listed at $130k.
Deal economics
- At list price, monthly cash flow is $282 ($3k/yr) — positive.
- The deal already cash-flows at list — no discount required.
- Meets the 1% rule at list price ($1k rent vs $130k).
- Cap rate 8.9% vs local median 3.4% in Bunker Hill — top-decile yield for the area; either an underpriced asset or a hidden risk that comps aren't pricing in. Stress-test before assuming the spread holds.
Location & tenants
- Location reads 67/100 on livability (#171 in OR) — a middle-class / working-renter tenant base. Strengths: cost of living A+, housing A+, crime A-; Watch: health & safety C-, amenities F, commute F.
- Coos Bay SD 9 (town): math 22% / reading 39% proficiency, ranked #45 of 58 in OR (top 78%) — families likely to look elsewhere, expect single-tenant / working-renter base with shorter leases.
- Zoned schools: Marshfield Senior High School (math 17% / reading 54%, grade F, #89 of 143 statewide, top 62%, 835 students, 31% FRL) — zoned schools average 31% FRL vs 55% district-wide (24 pts lower); this property's tenant base skews higher-income than the district average.
- Market conditions: Rents rising fast (+8.7%/yr); 342 active listings in the ZIP; 2 comparable units currently listed for rent nearby; 122 units permitted in Coos County in 2024 (16 in 5+ unit buildings).
Forward outlook
- Local home prices are declining (-3.0%/yr); year-one equity from $899 of loan paydown is wiped out by about $4k of value loss. Plan a longer hold.
- Coos County population projected to shrink 9% by 2050 — rents likely to lag national; underwrite the cash flow, not the appreciation.
- At projected returns (-3.0% appreciation + 8.0% rent growth), your $36k cash investment doubles in ~8 years — after that, you're playing with house money.
Negotiation context
- Only 7 days on market — expect competitive offers; lowballing is unlikely to land.
Risks & watch-outs
- Watch-outs: built in 1926 — expect roof / HVAC / electrical / plumbing capex.
Questions for the listing agent
- Built in 1926 — when were the roof, HVAC, electrical panel, plumbing, and water heater last replaced?
- Is there a deadline driving the sale (1031 exchange, divorce, estate, relocation)? That informs how much negotiation room exists.
- Schools are F-rated, which usually means shorter tenancies and higher turnover. Who's the typical renter profile here, and what's been the actual vacancy rate?
- What's the average days-on-market for RENTAL listings here right now (not sales)? A rising rental-DOM trend means longer vacancies and softer asking-rent achievability than the comps imply.
- What's the recent tenant-quality profile in this submarket — average credit score on applications, eviction rate, late-payment / NSF rate, and stable-employment percentage? A property-management company in the area should have these aggregated.
- How much new for-sale + rental construction is in the pipeline within 1–3 miles? Heavy new supply typically softens prices + rents 12–24 months out; constrained supply supports both.
Investment metrics
- 1% rule
- 1.11% ✓
- Cap rate
- 8.90%
- Cash-on-cash
- 9.29%
- DSCR
- 1.41
- GRM
- 7.5
CMA / ARV
- ARV (on-the-fly)
- $248,880
- Comps found
- 3
Show comp detail 3 sales within ~0.75 mi
| Address | Dist | Beds/Ba | Sqft | Sold | Price | $/sf | Match |
|---|---|---|---|---|---|---|---|
| 93554 Mccullum Ln | 0.38mi | 2/1.0 (+1) | 960 (-2%) | 23mo | $270,000 | $281 | 55 |
| 63751 Ellen St | 0.37mi | 2/1.0 (+1) | 882 (-10%) | 19mo | $218,000 | $247 | 46 |
| 63684 S Barry Rd | 0.43mi | 2/2.0 (+1) | 830 (-15%) | 21mo | $212,000 | $255 | 29 |
Match score weights: distance 35% · size 25% · config 20% · recency 20%. Top-matched comps best support the ARV.
Projected returns pro-forma
-3.0% appreciation · 8.0% rent growth · sell at horizon
- IRR
- 3.1%
- Equity multiple
- 1.12×
- Total profit
- $4,517
- Equity at exit
- $19,383
- IRR
- 16.8%
- Equity multiple
- 2.70×
- Total profit
- $61,770
- Equity at exit
- $11,240
Cash invested: $36,400 (down + closing). Projections, not guarantees.
Landlord ↔ Tenant lean methodology
- Overall (STATE)
- 28 Tenant-Leaning
- State Oregon
- 28 Tenant-Leaning · D+6
- County
- — inherits STATE
- City
- — inherits STATE
ZIP-level market 97420
- Rents YoY
- 8.7%
- Active inventory
- 342
- Price-to-rent
- 7.5×
Monthly cashflow live
- Estimated rent
- $1,444 medium interval (Pro) →
- Mortgage (P&I)
- −$682
- Tax from tax record
- −$123 /mo · $1,473/yr
- Insurance
- −$54
- HOA
- −$0
- Vacancy / Maint / Mgmt
- −$303
- Net cashflow
- $282
Break-even live
UW: 25.0% down · 7.5% · 30yr · 1.5% tax · 5.0% vac · 8.0% maint · 8.0% mgmt
Financing live
Cash to close
- Down payment
- $32,500
- Closing costs
- $3,900
- Reserves months
- —
- Total cash needed
- —
Loan-product check · same deal, 3 products live
Conventional
25% down · 7.5% · 30yr
- Down + closing
- —
- Monthly P&I
- —
- Monthly cashflow
- —
- DSCR
- —
- Eligible?
- —
Personal DTI + credit; lowest rate.
DSCR
20% down · 8.5% · 30yr
- Down + closing
- —
- Monthly P&I
- —
- Monthly cashflow
- —
- DSCR
- —
- Eligible?
- —
No personal income docs; deal must DSCR.
Hard money
10% down · 12.0% · 12mo
- Down + closing
- —
- Monthly P&I
- —
- Monthly cashflow
- —
- DSCR
- —
- Eligible?
- —
Short-term bridge; refi at stabilization.
Rent comps 2 comps
| Address | Beds | Baths | Sqft | Rent | $/sqft | DOM | Units | Dist |
|---|---|---|---|---|---|---|---|---|
| 995 S 10th St Coos Bay, OR | 2.0 | 1.0 | 850 | $1,375 | $1.62 | 43d | 1 | 1.18mi |
| 426 S 9th Ct Coos Bay, OR | 1.0 | 1.0 | 800 | $1,600 | $2.00 | 43d | 1 | 1.40mi |
Listing history 1 events
-
2026-05-21$130,000 Active
ⓘ Source: listings_history table (triggers on properties + properties_extension) + one-shot
backfill from property_details.listing_events for pre-trigger history.
Tax reassessment forecast OR · Resets to sale price
- Current annual tax
- $1,473 · $123/mo
- Projected year-2 tax
- $1,473 · $123/mo
- Expected delta
- $0/yr ($0/mo · 0.0%)
ⓘ Screening estimate from a state-policy table — verify with the county assessor before closing.
Climate risk First Street
- Flood 1/10 Low FEMA zone X (unshaded) · 0% chance over 30 yrs
- Wildfire 1/10 Low
- Heat 1/10 Low 7 d/yr ≥78°F today · 21 d/yr by 30 yrs out
- Wind 1/10 Low
- Air quality 6/10 Major 9 unhealthy d/yr today · 9 by 30 yrs out
Nearby sold comps map
Loading sold comps map…
Walkable amenities ~0.75 mi
Loading nearby amenities…
Taxation est. · year 1
- Rental income
- $17,325
- − Mortgage interest
- −$7,282
- − Property taxes
- −$1,473
- − Insurance
- −$650
- − Repairs & maintenance
- −$1,386
- − Management
- −$1,386
- − Depreciation
- −$3,782
- Taxable income
- $1,366
- Est. tax owed @ 24.0%
- −$328
- After-tax cash flow
- $3,055/yr
For passive investors: Depreciation is non-cash, so a rental often shows a tax loss while cash-flowing — sheltering income. Rental losses are passive: they offset passive income freely, and up to $25,000/yr can offset ordinary (W-2) income if you actively participate and your MAGI is under $100k (phasing out to $0 by $150k); unused losses carry forward. On sale, claimed depreciation is recaptured at up to 25%, and gains may owe capital-gains tax (a 1031 exchange can defer both). Figures are a year-1 estimate at your 24.0% rate — not tax advice; consult a CPA.
Schools (NCES district)
- District
- Coos Bay SD 9
- NCES district ID
- 4103660
- Math proficiency
- 22% ▼ -6.00%
- Reading proficiency
- 39% ▼ -4.00%
- Median HH income
- $38,630
- Composite
- 25.46/100
- National rank
- #7450
- State rank
- #45 of 58 in OR
Livability — Bunker Hill
- Score
- 67/100
- State rank
- #171
- US rank
- #10322
Category grades
Schools grade is shown separately in the Schools card above.
Census & demographics
- Census place
- Bunker Hill, OR
- County
- Coos County · 27,621 people
- Metro
- Coos Bay, OR
- Population (ZIP)
- 27,621
- Household income
- $61,574
- Rent vs Own
- Severe rent burden
- 799.0
Population outlook (Coos County) Hauer SSP2
- Today (2025)
- 62,222 people
- By 2030
- 61,120 · -1.8%
- By 2040
- 58,478 · -6.0%
- By 2050
- 56,819 · -8.7%
- By 2075
- 54,915 · -11.7%
- By 2100
- 51,403 · -17.4%
Race, ethnicity, and origin ACS 2023
- Neighborhood character
- Predominantly White (81%)
- Race & ethnicity
- White 81% Hispanic / Latino 10% Two or more races 8% Native American 2% Asian 1%
- Hispanic origin (detail)
- Mexican 7%
- Common ancestry
- Italian 5% Slovak 3% Lithuanian 3%
- Foreign-born
- 5% · Canada, Vietnam
- Languages at home
- 92% English-only · Spanish 6%
Political lean MEDSL · Coos
- 2024 margin
- R (+19.9) · D 38.7% · R 58.5% · Other 2.8%
- 2008→2024 swing
- -16.8pp toward R · 2008: -3.1pp · 2024: -19.9pp
- All cycles
- 2024: R+19.9 2020: R+20.5 2016: R+24.3 2012: R+6.3 2008: R+3.1
Not yet ingested
- Civics
- —
Market trends
- HPI YoY
- ▼ -315.58%
- Current HPI
- 198.3249
- Rent YoY
- ▲ 8.65%
- Metro
- Coos Bay, OR
- State GDP YoY
- ▲ 2.05%
- F500 in state
- 2
Industry mix (Fortune 500 HQ in OR)
| Industry | F500 HQs | Revenue |
|---|---|---|
| Consumer Goods | 1 | $51B |
|
||
Price history
1 event — show timeline
- 2026-05-21 Listed $130,000 RMLS
Property tax history
+4.5%/yrLatest (2025): $1,473 · +1.9% YoY. Source: county tax records.
Cash-flow waterfall
monthlySold comps — $/sqft
last 12 mo · ≤1 miLoading sold comps…