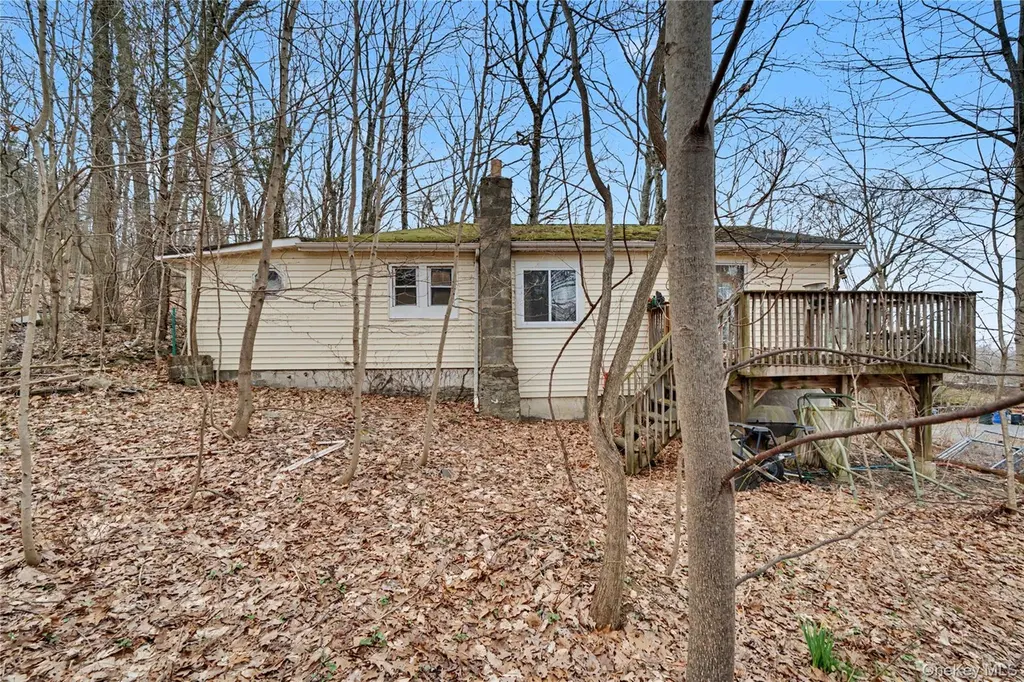
15 Arcadian Trl · Mountain Lodge Park, NY
Flood risk 1/10 · Minimal
- FEMA flood zone
- X (unshaded)
- Chance of flooding over 30 yrs
- 0.0%
- Est. flood insurance / yr
- $473 – $860
Fire risk 6/10 · Moderate
- Est. fire insurance / yr
- $691 – $1,283
Heat risk 3/10 · Minor
- Hot days now (above 97°F)
- 7 days/yr
- Hot days in 30 yrs
- 16 days/yr
Wind risk 4/10 · Minor
- Chance of severe wind over 30 yrs
- 17.0%
Air-quality risk 2/10 · Minimal
- Unhealthy air days now
- 1 days/yr
- Unhealthy air days in 30 yrs
- 2 days/yr
Risk factors via First Street. Map © Google.
Why this score? — see what drove the B+ grade
The composite is a weighted blend of 9 inputs, each scored 0–100. Each bar is that input's sub-score; the figure is the points it added to the 100-point composite (weight × sub-score).
- Cash flow +30.0/30.0
- ARV discount +15.0/15.0
- 1% rule +10.0/10.0
- DSCR +10.0/10.0
- Schools +4.8/10.0
- Livability +3.7/5.0
- Rent growth +2.9/5.0
- Condition / age +2.5/5.0
- Appreciation +0.0/10.0
$149,000
🖨 Deal sheet (PDF) 📄 Offer letter ✓ Due diligence
Listing remarks
Everything you need, without the extra fuss this 5-room home is set up for simple, comfortable living. The layout flows naturally from the living area into the kitchen, with just the right amount of space in each room to make it feel balanced and usable. Bedrooms are nicely sized, offering flexibility for sleeping, or whatever you need. The home has a clean, easy feel throughout, with space that’s practical and not overdone.
Key facts
- 0.31 acre lot
- Built 1938
- Listed 6 days
Neighborhood map
What this means for you Summary
Snapshot
- This is a 2-bed/2.0-bath single-family listed at $149k.
Deal economics
- At list price, monthly cash flow is $626 ($8k/yr) — positive.
- The deal already cash-flows at list — no discount required.
- Meets the 1% rule at list price ($2k rent vs $149k).
- Cap rate 11.3% vs local median 5.3% in Mountain Lodge Park — top-decile yield for the area; either an underpriced asset or a hidden risk that comps aren't pricing in. Stress-test before assuming the spread holds.
Location & tenants
- Location reads 73/100 on livability (#308 in NY) — a middle-class / working-renter tenant base. Strengths: employment A+, housing A+, health & safety A+; Watch: amenities F, commute F.
- Washingtonville Central School District (suburban): math 44% / reading 60% proficiency, ranked #288 of 590 in NY (top 49%) — acceptable for families but not a draw, mixed tenant base, ~2y average lease; only 16% free/reduced lunch — higher-income household profile.
- Zoned schools: Round Hill Elementary School (math 27% / reading 52%, grade F, #1,444 of 2,108 statewide, top 71%, 653 students, 38% FRL); Washingtonville Middle School (math 21% / reading 50%, grade F, #473 of 729 statewide, top 66%, 900 students, 35% FRL); Washingtonville Senior High School (math 92% / reading 89%, grade A+, #231 of 1,100 statewide, top 21%, 1,318 students, 29% FRL) — zoned schools average 34% FRL vs 16% district-wide (18 pts higher); higher-poverty schools than district average — tighter screening recommended.
- Market conditions: Rents rising (+1.5%/yr); 322 active listings in the ZIP; 8 comparable units currently listed for rent nearby; rentals at typical pace (median 16d on market — plan ~3-4 weeks tenant-placement turnaround); solid renter incomes; 1,746 units permitted in Orange County in 2024 (1,265 in 5+ unit buildings).
- This rent runs 37% of the median local income ($79k/yr) — at the standard rent-burdened threshold; future hikes will face affordability resistance.
Forward outlook
- Local home prices are declining (-3.0%/yr); year-one equity from $1k of loan paydown is wiped out by about $4k of value loss. Plan a longer hold.
- At projected returns (-3.0% appreciation + 1.5% rent growth), your $42k cash investment doubles in ~8 years — after that, you're playing with house money.
Negotiation context
- Only 6 days on market — expect competitive offers; lowballing is unlikely to land.
- Current owner paid $50k; list at $149k implies a 198% gain — meaningful room to come down on a strong offer.
Risks & watch-outs
- Watch-outs: property tax is 3.8% of price; built in 1938 — expect roof / HVAC / electrical / plumbing capex.
- Climate carrying-cost: major wildfire risk — expect insurance premiums to compound above CPI over the hold.
Questions for the listing agent
- Built in 1938 — when were the roof, HVAC, electrical panel, plumbing, and water heater last replaced?
- Property tax is high relative to price — has the assessment been appealed recently, and will the sale trigger a re-assessment?
- Is there a deadline driving the sale (1031 exchange, divorce, estate, relocation)? That informs how much negotiation room exists.
- Schools are F-rated, which usually means shorter tenancies and higher turnover. Who's the typical renter profile here, and what's been the actual vacancy rate?
- What's the average days-on-market for RENTAL listings here right now (not sales)? A rising rental-DOM trend means longer vacancies and softer asking-rent achievability than the comps imply.
- What's the recent tenant-quality profile in this submarket — average credit score on applications, eviction rate, late-payment / NSF rate, and stable-employment percentage? A property-management company in the area should have these aggregated.
- How much new for-sale + rental construction is in the pipeline within 1–3 miles? Heavy new supply typically softens prices + rents 12–24 months out; constrained supply supports both.
Investment metrics
- 1% rule
- 1.65% ✓
- Cap rate
- 11.33%
- Cash-on-cash
- 18.00%
- DSCR
- 1.80
- GRM
- 5.1
CMA / ARV
- ARV (on-the-fly)
- $297,360
- Comps found
- 12
Show comp detail 12 sales within ~0.75 mi
| Address | Dist | Beds/Ba | Sqft | Sold | Price | $/sf | Match |
|---|---|---|---|---|---|---|---|
| 15 Arcadian Trl | 0.00mi | 2/2.0 | 1,008 (0%) | 0mo | $162,000 | $161 | 100 |
| 5 Orchard Trl | 0.23mi | 2/1.0 | 963 (-4%) | 6mo | $264,500 | $275 | 73 |
| 15 Claremont Trl | 0.25mi | 2/1.0 | 980 (-3%) | 8mo | $265,000 | $270 | 73 |
| 51 Glenwood Rd | 0.15mi | 3/2.0 (+1) | 1,040 (+3%) | 13mo | $260,000 | $250 | 72 |
| 39 Hillcrest Trl | 0.49mi | 2/1.0 | 1,000 (-1%) | 6mo | $295,000 | $295 | 67 |
| 3 Brookside Trl | 0.19mi | 2/2.0 | 1,120 (+11%) | 9mo | $265,000 | $237 | 65 |
| 19 Grandview Trl | 0.49mi | 3/2.0 (+1) | 1,050 (+4%) | 2mo | $375,000 | $357 | 63 |
| 5 Beverly Trl | 0.27mi | 3/2.0 (+1) | 900 (-11%) | 3mo | $315,000 | $350 | 62 |
| 27 Revere Rd | 0.48mi | 3/2.0 (+1) | 1,048 (+4%) | 9mo | $330,000 | $315 | 58 |
| 4 Wildwood Trl | 0.32mi | 3/1.0 (+1) | 883 (-12%) | 11mo | $255,000 | $289 | 46 |
| 20 Windsor Rd | 0.48mi | 3/1.0 (+1) | 900 (-11%) | 9mo | $284,000 | $316 | 44 |
| 15 Herbst Dr | 0.70mi | 2/1.0 | 876 (-13%) | 2mo | $339,000 | $387 | 40 |
Match score weights: distance 35% · size 25% · config 20% · recency 20%. Top-matched comps best support the ARV.
Projected returns pro-forma
-3.0% appreciation · 1.5% rent growth · sell at horizon
- IRR
- 7.7%
- Equity multiple
- 1.29×
- Total profit
- $12,280
- Equity at exit
- $22,216
- IRR
- 15.5%
- Equity multiple
- 2.16×
- Total profit
- $48,353
- Equity at exit
- $12,883
Cash invested: $41,720 (down + closing). Projections, not guarantees.
Landlord ↔ Tenant lean methodology
- Overall (STATE)
- 15 Strongly Tenant-Friendly
- State New York
- 15 Strongly Tenant-Friendly · D+10
- County
- — inherits STATE
- City
- — inherits STATE
ZIP-level market 10950
- Rents YoY
- 1.5%
- Active inventory
- 322
- Price-to-rent
- 5.1×
Monthly cashflow live
- Estimated rent
- $2,453 high interval (Pro) →
- Mortgage (P&I)
- −$781
- Tax from tax record
- −$469 /mo · $5,623/yr
- Insurance
- −$62
- HOA
- −$0
- Vacancy / Maint / Mgmt
- −$515
- Net cashflow
- $626
Break-even live
Sensitivity live
| Price | -10% $710 | -5% $668 | +0% $626 | +5% $584 | +10% $542 |
|---|---|---|---|---|---|
| Rent | -10% $432 | -5% $529 | +0% $626 | +5% $723 | +10% $820 |
| Rate | -1.0pp $701 | -0.5pp $664 | base $626 | +0.5pp $587 | +1.0pp $548 |
UW: 25.0% down · 7.5% · 30yr · 1.5% tax · 5.0% vac · 8.0% maint · 8.0% mgmt
Financing live
Cash to close
- Down payment
- $37,250
- Closing costs
- $4,470
- Reserves months
- —
- Total cash needed
- —
Loan-product check · same deal, 3 products live
Conventional
25% down · 7.5% · 30yr
- Down + closing
- —
- Monthly P&I
- —
- Monthly cashflow
- —
- DSCR
- —
- Eligible?
- —
Personal DTI + credit; lowest rate.
DSCR
20% down · 8.5% · 30yr
- Down + closing
- —
- Monthly P&I
- —
- Monthly cashflow
- —
- DSCR
- —
- Eligible?
- —
No personal income docs; deal must DSCR.
Hard money
10% down · 12.0% · 12mo
- Down + closing
- —
- Monthly P&I
- —
- Monthly cashflow
- —
- DSCR
- —
- Eligible?
- —
Short-term bridge; refi at stabilization.
Rent comps 8 comps
| Address | Beds | Baths | Sqft | Rent | $/sqft | DOM | Units | Dist |
|---|---|---|---|---|---|---|---|---|
| 357 Mountain Lodge Rd Monroe, NY | 2.0 | 1.0 | 760 | $2,000 | $2.63 | 15d | 1 | 0.28mi |
| 12 Utopian Trl Monroe, NY | 2.0 | 1.0 | 850 | $2,150 | $2.53 | 15d | 1 | 0.29mi |
| 2 Ascension Trl Monroe, NY | 3.0 | 1.0 | 1500 | $2,275 | $1.52 | 22d | 1 | 0.30mi |
| 14 Woodland Cir S Monroe, NY | 3.0 | 1.0 | 750 | $2,100 | $2.80 | 15d | 1 | 0.32mi |
| 2 Edgewood Trl Monroe, NY | 2.0 | 1.0 | 959 | $2,400 | $2.50 | 15d | 1 | 0.41mi |
| 32 Cedar Trl Monroe, NY | 3.0 | 1.0 | 825 | $2,200 | $2.67 | 25d | 1 | 0.49mi |
| 66 Higgins Trl Blooming Grove, NY | 2.0 | 1.5 | 800 | $1,700 | $2.12 | 15d | 1 | 0.53mi |
| 25 Gloria Trl Monroe, NY | 3.0 | 1.0 | 835 | $2,200 | $2.63 | 15d | 1 | 0.68mi |
Listing history 3 events
-
2026-05-17status Pending
-
2026-04-13$149,000 Active
-
1990-01-22soldstatus $50,000
ⓘ Source: listings_history table (triggers on properties + properties_extension) + one-shot
backfill from property_details.listing_events for pre-trigger history.
Tax reassessment forecast NY · Partial reset (capped growth)
- Current annual tax
- $5,623 · $469/mo
- Projected year-2 tax
- $5,623 · $469/mo
- Expected delta
- $0/yr ($0/mo · 0.0%)
ⓘ Screening estimate from a state-policy table — verify with the county assessor before closing.
Climate risk First Street
- Flood 1/10 Low FEMA zone X (unshaded) · 0% chance over 30 yrs
- Wildfire 6/10 Major
- Heat 3/10 Moderate 7 d/yr ≥97°F today · 16 d/yr by 30 yrs out
- Wind 4/10 Moderate 17% chance of damaging wind over 30 yrs
- Air quality 2/10 Low 1 unhealthy d/yr today · 2 by 30 yrs out
Nearby sold comps map
Loading sold comps map…
Walkable amenities ~0.75 mi
Loading nearby amenities…
Taxation est. · year 1
- Rental income
- $29,437
- − Mortgage interest
- −$8,346
- − Property taxes
- −$5,623
- − Insurance
- −$745
- − Repairs & maintenance
- −$2,355
- − Management
- −$2,355
- − Depreciation
- −$4,335
- Taxable income
- $5,678
- Est. tax owed @ 24.0%
- −$1,363
- After-tax cash flow
- $6,148/yr
For passive investors: Depreciation is non-cash, so a rental often shows a tax loss while cash-flowing — sheltering income. Rental losses are passive: they offset passive income freely, and up to $25,000/yr can offset ordinary (W-2) income if you actively participate and your MAGI is under $100k (phasing out to $0 by $150k); unused losses carry forward. On sale, claimed depreciation is recaptured at up to 25%, and gains may owe capital-gains tax (a 1031 exchange can defer both). Figures are a year-1 estimate at your 24.0% rate — not tax advice; consult a CPA.
Schools (NCES district)
- District
- Washingtonville Central School District
- NCES district ID
- 3630030
- Math proficiency
- 44% ▼ -13.00%
- Reading proficiency
- 60% ▲ 11.00%
- Median HH income
- $89,379
- Composite
- 48.15/100
- National rank
- #2178
- State rank
- #288 of 590 in NY
Livability — Mountain Lodge Park
- Score
- 73/100
- State rank
- #308
- US rank
- #5092
Category grades
Schools grade is shown separately in the Schools card above.
Census & demographics
- Census place
- Mountain Lodge Park, NY
- County
- Orange County · 267,004 people
- Metro
- Poughkeepsie-Newburgh-Middletown, NY
- Population (ZIP)
- 68,136
- Household income
- $78,931
- Rent vs Own
- Severe rent burden
- 3149.0
Population outlook (Orange County) Hauer SSP2
- Today (2025)
- 379,830 people
- By 2030
- 378,955 · -0.2%
- By 2040
- 375,444 · -1.2%
- By 2050
- 369,311 · -2.8%
- By 2075
- 354,233 · -6.7%
- By 2100
- 318,150 · -16.2%
Race, ethnicity, and origin ACS 2023
- Neighborhood character
- Predominantly White (81%)
- Race & ethnicity
- White 81% Hispanic / Latino 12% Two or more races 6% Black 3% Asian 1%
- Hispanic origin (detail)
- Puerto Rican 5% Dominican 2%
- Common ancestry
- Romanian 3% Scandinavian 2% Italian 2%
- Foreign-born
- 11% · Canada, Dominican Republic
- Languages at home
- 33% English-only · German/W. Germanic 52% Spanish 9% Russian/Polish/Slavic 1%
Political lean MEDSL · Orange
- 2024 margin
- Lean R (+8.4) · D 45.8% · R 54.2%
- 2008→2024 swing
- -12.5pp toward R · 2008: 4.1pp · 2024: -8.4pp
- All cycles
- 2024: R+8.4 2020: R+0.2 2016: R+6.5 2012: D+5.2 2008: D+4.1
Not yet ingested
- Civics
- —
Market trends
- HPI YoY
- ▼ -309.81%
- Current HPI
- 314.2081
- Rent YoY
- ▲ 1.50%
- Metro
- Poughkeepsie-Newburgh-Middletown, NY
- State GDP YoY
- ▲ 2.60%
- F500 in state
- 92
Industry mix (Fortune 500 HQ in NY)
| Industry | F500 HQs | Revenue |
|---|---|---|
| Financial Services | 10 | $950B |
|
||
| Consumer Goods | 9 | $162B |
|
||
| Insurance | 4 | $225B |
|
||
| Telecommunications | 2 | $144B |
|
||
| Pharmaceuticals | 2 | $112B |
|
||
| Media / Entertainment | 2 | $69B |
|
||
Price history
+198.0% since first listed3 events — show timeline
- 2026-05-17 Pending — OneKey® MLS as Distributed by MLS Grid
- 2026-04-13 Listed $149,000 OneKey® MLS as Distributed by MLS Grid
- 1990-01-22 Sold (Public Records) $50,000 Public Records
Property tax history
+3.2%/yrLatest (2025): $5,623 · +1.2% YoY. Source: county tax records.
Cash-flow waterfall
monthlySold comps — $/sqft
last 12 mo · ≤1 miLoading sold comps…