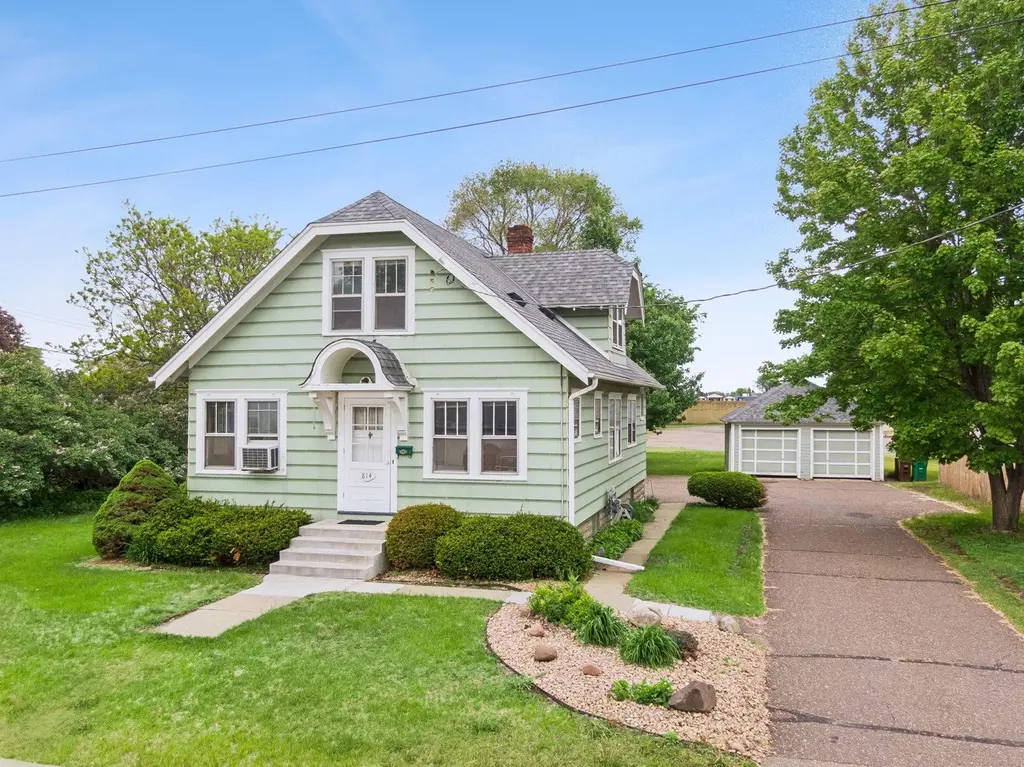
814 62nd Ave N · Brooklyn Center, MN
Flood risk 1/10 · Minimal
- FEMA flood zone
- X (unshaded)
- Chance of flooding over 30 yrs
- 0.0%
- Est. flood insurance / yr
- $507 – $1,088
Fire risk 1/10 · Minimal
- Est. fire insurance / yr
- $888 – $1,650
Heat risk 2/10 · Minimal
- Hot days now (above 99°F)
- 7 days/yr
- Hot days in 30 yrs
- 14 days/yr
Wind risk 2/10 · Minimal
- Chance of severe wind over 30 yrs
- —
Air-quality risk 2/10 · Minimal
- Unhealthy air days now
- 2 days/yr
- Unhealthy air days in 30 yrs
- 2 days/yr
Risk factors via First Street. Map © Google.
Why this score? — see what drove the C- grade
The composite is a weighted blend of 9 inputs, each scored 0–100. Each bar is that input's sub-score; the figure is the points it added to the 100-point composite (weight × sub-score).
- Cash flow +20.7/30.0
- ARV discount +7.5/15.0
- DSCR +6.6/10.0
- 1% rule +5.2/10.0
- Livability +3.7/5.0
- Rent growth +2.5/5.0
- Condition / age +2.5/5.0
- Schools +1.9/10.0
- Appreciation +0.0/10.0
$249,000
🖨 Deal sheet (PDF) 📄 Offer letter ✓ Due diligence
Listing remarks
Welcome to this charming home nestled on a spacious . 55-acre lot in a quiet, established neighborhood. Lovingly cared for by one owner, for over 50 years, this property is full of warmth, character, and timeless appeal. Step inside to discover beautiful woodwork, hardwood floors and custom built-ins that highlight the inviting living room, creating a cozy yet distinctive space. The formal dining room is perfect for gatherings, while an additional main-level room just off the living area offers flexibility as a home office, music room, or creative space. The main level features two comfortable bedrooms and a full bath, providing convenient one-level living. Upstairs, you’ll find an ad
Key facts
- Flexible space
- Main-level room
- Spacious lot
Tags
Property features AI
Finance
- Other: Lot about 0.55 acres (approx. 150 x 100), city street frontage
Exterior
- Parking: 2-car garage (approximately 24.4 x 20.3)
- Utilities: City water connected; City sewer connected; Oil fuel
- Home design: Residential property; One and one-half story; Above-grade finished living area 1,364; Main level finished area 873
- Construction: Block construction; Block foundation; Roof replaced or is 8 years old or newer; Below-grade area 795
- Exterior features: Patio; Other exterior features
Interior
- Kitchen: Dishwasher; Range; Refrigerator; Microwave; Freezer
- Bedrooms: 3 bedrooms (includes a main-floor bedroom and upper-level bedrooms)
- Flooring: Hardwood floors
- Bathrooms: Main floor full bath
- Heating & cooling: Gravity heating; Window cooling units
- Interior features: Hardwood floors; Separate/formal dining room; Loft; Daylight/lookout windows in basement
- Laundry & utility: Washer; Dryer
Neighborhood map
What this means for you Summary
Snapshot
- This is a 5-bed/2.0-bath single-family listed at $249k.
Deal economics
- At list price, monthly cash flow is $339 ($4k/yr) — positive.
- The deal already cash-flows at list — no discount required.
- Meets the 1% rule at list price ($3k rent vs $249k).
- Recommended offer: $245k (1.5% below list) — sets the bar for market timing.
- Cap rate 7.9% vs local median 5.0% in Brooklyn Center — top-decile yield for the area; either an underpriced asset or a hidden risk that comps aren't pricing in. Stress-test before assuming the spread holds.
Location & tenants
- Location reads 73/100 on livability (#253 in MN) — a middle-class / working-renter tenant base. Strengths: commute A+, housing A+, cost of living A-; Watch: schools D+, crime F, amenities F.
- Brooklyn Center School District (suburban): math 14% / reading 22% proficiency, ranked #425 of 467 in MN (top 91%) — low school quality limits family demand, transient renter base, plan for 1-2y turnover; 64% free/reduced lunch — lower-income household profile, screen leases tightly.
- Market conditions: 93 active listings in the ZIP; 1 comparable units currently listed for rent nearby; solid renter incomes; 4,651 units permitted in Hennepin County in 2024 (2,443 in 5+ unit buildings).
- This rent runs 40% of the median local income ($76k/yr) — at the standard rent-burdened threshold; future hikes will face affordability resistance.
Forward outlook
- Local home prices are declining (-3.0%/yr); year-one equity from $2k of loan paydown is wiped out by about $7k of value loss. Plan a longer hold.
- Hennepin County population projected at +30% by 2050 — long-run rental-demand tailwind backs the buy-and-hold thesis.
Negotiation context
- It's been on market 29 days — a 2% lower offer ($245k) is reasonable based on typical stale-listing flexibility.
Risks & watch-outs
- Watch-outs: built in 1929 — expect roof / HVAC / electrical / plumbing capex.
Questions for the listing agent
- Built in 1929 — when were the roof, HVAC, electrical panel, plumbing, and water heater last replaced?
- Is there a deadline driving the sale (1031 exchange, divorce, estate, relocation)? That informs how much negotiation room exists.
- Schools are D-rated, which usually means shorter tenancies and higher turnover. Who's the typical renter profile here, and what's been the actual vacancy rate?
- Crime grade is F in this area — have there been break-ins, vandalism, or insurance claims at this property in the last 3 years? What carrier currently insures it and at what premium?
- What's the average days-on-market for RENTAL listings here right now (not sales)? A rising rental-DOM trend means longer vacancies and softer asking-rent achievability than the comps imply.
- What's the recent tenant-quality profile in this submarket — average credit score on applications, eviction rate, late-payment / NSF rate, and stable-employment percentage? A property-management company in the area should have these aggregated.
- How much new for-sale + rental construction is in the pipeline within 1–3 miles? Heavy new supply typically softens prices + rents 12–24 months out; constrained supply supports both.
Investment metrics
- 1% rule
- 1.02% ✓
- Cap rate
- 7.93%
- Cash-on-cash
- 5.83%
- DSCR
- 1.26
- GRM
- 8.1
CMA / ARV
No comps found within radius.
Projected returns pro-forma
-3.0% appreciation · 3.0% rent growth · sell at horizon
- IRR
- -7.3%
- Equity multiple
- 0.73×
- Total profit
- $-18,762
- Equity at exit
- $37,127
- IRR
- 2.3%
- Equity multiple
- 1.16×
- Total profit
- $11,491
- Equity at exit
- $21,529
Cash invested: $69,720 (down + closing). Projections, not guarantees.
Landlord ↔ Tenant lean methodology
- Overall (STATE)
- 46 Balanced
- State Minnesota
- 46 Balanced · D+2
- County
- — inherits STATE
- City
- — inherits STATE
ZIP-level market 55430
- Active inventory
- 93
- Price-to-rent
- 8.1×
Monthly cashflow live
- Estimated rent
- $2,552 medium interval (Pro) →
- Mortgage (P&I)
- −$1,306
- Tax from tax record
- −$268 /mo · $3,210/yr
- Insurance
- −$104
- HOA
- −$0
- Vacancy / Maint / Mgmt
- −$536
- Net cashflow
- $339
Break-even live
Sensitivity live
| Price | -10% $480 | -5% $409 | +0% $339 | +5% $268 | +10% $198 |
|---|---|---|---|---|---|
| Rent | -10% $137 | -5% $238 | +0% $339 | +5% $440 | +10% $540 |
| Rate | -1.0pp $464 | -0.5pp $402 | base $339 | +0.5pp $274 | +1.0pp $209 |
UW: 25.0% down · 7.5% · 30yr · 1.5% tax · 5.0% vac · 8.0% maint · 8.0% mgmt
Financing live
Cash to close
- Down payment
- $62,250
- Closing costs
- $7,470
- Reserves months
- —
- Total cash needed
- —
Loan-product check · same deal, 3 products live
Conventional
25% down · 7.5% · 30yr
- Down + closing
- —
- Monthly P&I
- —
- Monthly cashflow
- —
- DSCR
- —
- Eligible?
- —
Personal DTI + credit; lowest rate.
DSCR
20% down · 8.5% · 30yr
- Down + closing
- —
- Monthly P&I
- —
- Monthly cashflow
- —
- DSCR
- —
- Eligible?
- —
No personal income docs; deal must DSCR.
Hard money
10% down · 12.0% · 12mo
- Down + closing
- —
- Monthly P&I
- —
- Monthly cashflow
- —
- DSCR
- —
- Eligible?
- —
Short-term bridge; refi at stabilization.
Rent comps 1 comps
| Address | Beds | Baths | Sqft | Rent | $/sqft | DOM | Units | Dist |
|---|---|---|---|---|---|---|---|---|
| 5700 Colfax Ave N Minneapolis, MN | 4.0 | 1.5 | 1425 | $2,375 | $1.67 | 21d | 1 | 0.59mi |
Listing history 15 events
-
2026-06-18days on market $249,000 Active 29 DOM
-
2026-06-17price $249,000 Active 28 DOM
-
2026-06-17days on market $259,000 Active 28 DOM
-
2026-06-16days on market $259,000 Active 27 DOM
-
2026-06-15days on market $259,000 Active 26 DOM
-
2026-06-13days on market $259,000 Active 24 DOM
-
2026-06-09days on market $259,000 Active 20 DOM
-
2026-06-08days on market $259,000 Active 19 DOM
-
2026-06-07pricedays on market $259,000 Active 18 DOM
-
2026-06-04days on market $275,000 Active 15 DOM
-
2026-06-03days on market $275,000 Active 14 DOM
-
2026-06-02days on market $275,000 Active 13 DOM
-
2026-06-01days on market $275,000 Active 12 DOM
-
2026-05-31days on market $275,000 Active 11 DOM
-
2026-05-20$275,000 Active
ⓘ Source: listings_history table (triggers on properties + properties_extension) + one-shot
backfill from property_details.listing_events for pre-trigger history.
Tax reassessment forecast MN · Partial reset (capped growth)
- Current annual tax
- $3,210 · $268/mo
- Projected year-2 tax
- $3,210 · $268/mo
- Expected delta
- $0/yr ($0/mo · 0.0%)
ⓘ Screening estimate from a state-policy table — verify with the county assessor before closing.
Climate risk First Street
- Flood 1/10 Low FEMA zone X (unshaded) · 0% chance over 30 yrs
- Wildfire 1/10 Low
- Heat 2/10 Low 7 d/yr ≥99°F today · 14 d/yr by 30 yrs out
- Wind 2/10 Low
- Air quality 2/10 Low 2 unhealthy d/yr today · 2 by 30 yrs out
Nearby sold comps map
Loading sold comps map…
Walkable amenities ~0.75 mi
Loading nearby amenities…
Taxation est. · year 1
- Rental income
- $30,620
- − Mortgage interest
- −$13,948
- − Property taxes
- −$3,210
- − Insurance
- −$1,245
- − Repairs & maintenance
- −$2,450
- − Management
- −$2,450
- − Depreciation
- −$7,244
- Taxable income
- $74
- Est. tax owed @ 24.0%
- −$18
- After-tax cash flow
- $4,047/yr
For passive investors: Depreciation is non-cash, so a rental often shows a tax loss while cash-flowing — sheltering income. Rental losses are passive: they offset passive income freely, and up to $25,000/yr can offset ordinary (W-2) income if you actively participate and your MAGI is under $100k (phasing out to $0 by $150k); unused losses carry forward. On sale, claimed depreciation is recaptured at up to 25%, and gains may owe capital-gains tax (a 1031 exchange can defer both). Figures are a year-1 estimate at your 24.0% rate — not tax advice; consult a CPA.
Schools (NCES district)
- District
- Brooklyn Center School District
- NCES district ID
- 2706240
- Math proficiency
- 14% ▼ -2.00%
- Reading proficiency
- 22% ▼ -3.00%
- Median HH income
- $44,797
- Composite
- 19.07/100
- National rank
- #13976
- State rank
- #425 of 467 in MN
Livability — Brooklyn Center
- Score
- 73/100
- State rank
- #253
- US rank
- #5422
Category grades
Schools grade is shown separately in the Schools card above.
Census & demographics
- Census place
- Brooklyn Center, MN
- County
- Hennepin County · 1,150,272 people
- City population
- 22,749
- Metro
- Minneapolis-St. Paul-Bloomington, MN-WI
- Population (ZIP)
- 22,749
- Household income
- $75,716
- Rent vs Own
- Severe rent burden
- 659.0
Population outlook (Hennepin County) Hauer SSP2
- Today (2025)
- 1,405,227 people
- By 2030
- 1,492,650 · +6.2%
- By 2040
- 1,660,157 · +18.1%
- By 2050
- 1,823,498 · +29.8%
- By 2075
- 2,221,283 · +58.1%
- By 2100
- 2,509,976 · +78.6%
Race, ethnicity, and origin ACS 2023
- Neighborhood character
- Highly diverse neighborhood (Simpson 0.75)
- Race & ethnicity
- White 33% Black 29% Asian 16% Hispanic / Latino 15% Two or more races 8%
- Hispanic origin (detail)
- Mexican 9%
- Common ancestry
- Portuguese 6% Swiss 3% Romanian 2%
- Foreign-born
- 22% · Canada, Vietnam
- Languages at home
- 70% English-only · Spanish 13% Other Asian/Pacific 10% Vietnamese 2%
Political lean MEDSL · Hennepin
- 2024 margin
- Solid D (+42.6) · D 70.2% · R 27.5% · Other 2.3%
- 2008→2024 swing
- +14.0pp toward D · 2008: 28.6pp · 2024: 42.6pp
- All cycles
- 2024: D+42.6 2020: D+43.2 2016: D+35.3 2012: D+27.1 2008: D+28.6
Not yet ingested
- Civics
- —
Market trends
- HPI YoY
- ▼ -163.41%
- Current HPI
- 280.4391
- Rent YoY
- —
- Metro
- Minneapolis-St. Paul-Bloomington, MN-WI
- State GDP YoY
- ▲ 2.41%
- F500 in state
- 34
Industry mix (Fortune 500 HQ in MN)
| Industry | F500 HQs | Revenue |
|---|---|---|
| Healthcare | 2 | $407B |
|
||
| Retail | 2 | $150B |
|
||
| Consumer Goods | 2 | $32B |
|
||
| Industrial Machinery | 2 | $6B |
|
||
| Agriculture | 1 | $40B |
|
||
| Healthcare / Medical Devices | 1 | $32B |
|
||
Price history
1 event — show timeline
- 2026-05-20 Listed $275,000 NORTHSTARMLS as Distributed by MLS Grid
Property tax history
+4.3%/yrLatest (2025): $3,210 · +0.4% YoY. Source: county tax records.
Cash-flow waterfall
monthlySold comps — $/sqft
last 12 mo · ≤1 miLoading sold comps…