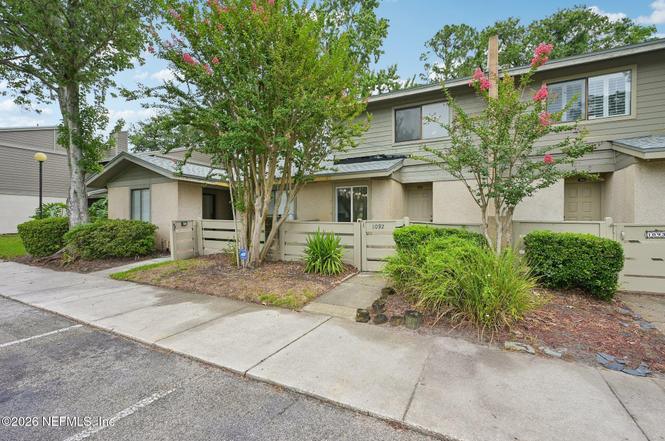
7701 Baymeadows Cir W #1092 · Jacksonville, FL
Flood risk 4/10 · Minor
- FEMA flood zone
- X (unshaded)
- Chance of flooding over 30 yrs
- 0.22%
- Est. flood insurance / yr
- $507 – $1,088
Fire risk 4/10 · Minor
- Est. fire insurance / yr
- $947 – $1,759
Heat risk 9/10 · Severe
- Hot days now (above 107°F)
- 7 days/yr
- Hot days in 30 yrs
- 20 days/yr
Wind risk 10/10 · Severe
- Chance of severe wind over 30 yrs
- 99.0%
Air-quality risk 4/10 · Minor
- Unhealthy air days now
- 4 days/yr
- Unhealthy air days in 30 yrs
- 6 days/yr
Risk factors via First Street. Map © Google.
Why this score? — see what drove the D grade
The composite is a weighted blend of 9 inputs, each scored 0–100. Each bar is that input's sub-score; the figure is the points it added to the 100-point composite (weight × sub-score).
- ARV discount +7.5/15.0
- 1% rule +7.2/10.0
- Cash flow +7.0/30.0
- Appreciation +4.2/10.0
- Livability +4.2/5.0
- Schools +3.9/10.0
- Rent growth +2.6/5.0
- Condition / age +2.5/5.0
- DSCR +1.2/10.0
$139,900
🖨 Deal sheet 📄 Offer letter ✓ Due diligence
Listing remarks MLS
CASH OFFERS ONLY - CLOSING COST ASSISTANCE WITH ACCEPTABLE OFFER | This property offers a charming old Florida feel where you'll be greeted by a gated front porch and step inside to discover upgraded upstairs flooring, master bathroom shower, fresh paint throughout the interior of the home, a 2021 HVAC, water heater, microwave, and dishwasher. Homeowners will also reap the benefits of HOA living, which includes insurance, maintenance grounds, pest control, sewer, trash, water, pool, and tennis court. This home is updated and ready for its new home owner to come enjoy the convenient living that Village Green has to offer!
Key facts
- Brand new kitchen
- Updated condo
- Black countertops
Tags
Property features AI
Finance
- HOA & community: Homeowners association with monthly fee; Association amenities include car wash area, clubhouse, fitness center, maintenance of grounds, and tennis courts; Monthly association fee
Exterior
- Parking: Assigned parking
- Utilities: Public sewer; Electricity connected; Sewer connected; Water available
- Home design: Condominium; 2 stories; Attached property; Residential use
- Construction: Property on a 0.02-acre lot
- Exterior features: Patio; Screened porch; Community pool (not private)
Interior
- Kitchen: Dishwasher; Disposal; Electric cooktop; Electric oven; Microwave; Refrigerator
- Bedrooms: 2 bedrooms
- Flooring: Laminate
- Bathrooms: 2 full bathrooms; 1 half bathroom
- Heating & cooling: Central heating; Central air conditioning; Has heating and cooling
- Interior features: Ceiling fans; Open floor plan; Primary bathroom has a shower (no tub); Wood-burning fireplace
- Laundry & utility: In-unit washer and dryer; Electric water heater
Neighborhood map
What this means for you Summary
Snapshot
- This is a 2-bed/3.0-bath condo listed at $140k.
Deal economics
- At list price, monthly cash flow is $-203 ($-2k/yr) — negative.
- To cash-flow at today's rent, offer at most $104k (25.7% below list).
- Meets the 1% rule at list price ($2k rent vs $140k).
- Recommended offer: $104k (25.7% below list) — sets the bar for cash-flow.
Location & tenants
- Location reads 83/100 on livability (#50 in FL, #911 nationally) — a professional / high-income tenant draw. Strengths: amenities A+, commute A+, housing A+.
- Duval (urban): math 46% / reading 45% proficiency, ranked #48 of 73 in FL (top 66%) — families likely to look elsewhere, expect single-tenant / working-renter base with shorter leases.
- Market conditions: Rents flat; 513 active listings in the ZIP; 40 comparable units currently listed for rent nearby; rentals at typical pace (median 22d on market — plan ~3-4 weeks tenant-placement turnaround); 6,503 units permitted in Duval County in 2024 (1,131 in 5+ unit buildings).
Forward outlook
- Local home prices are declining (-1.6%/yr); year-one equity from $967 of loan paydown is wiped out by about $2k of value loss. Plan a longer hold.
- Duval County population projected at +19% by 2050 — long-run rental-demand tailwind backs the buy-and-hold thesis.
Negotiation context
- Only 1 days on market — expect competitive offers; lowballing is unlikely to land.
- 8 sale attempts since 25y ago with the ask held roughly flat each time — persistent listings suggest the price (not the market) is what's stuck; bring a comps-based counter.
Risks & watch-outs
- Watch-outs: HOA is 35% of rent.
- Climate carrying-cost: severe wind risk, 99% chance of damaging wind over 30y; extreme-heat days projected 7→20/yr by 2055 (HVAC capex compounding) — expect insurance premiums to compound above CPI over the hold.
Questions for the listing agent
- What do current leases actually rent for vs. the listed asking? Can we see a recent rent roll and the last 12 months of T-12 income?
- What does the HOA fee cover, when was the last increase, and are there any pending special assessments or reserve-fund shortfalls?
- Any open or pending special assessments — roof, HVAC, plumbing, elevator, façade? What's the per-unit balance and payoff schedule, and is the seller paying it off at close or rolling it to the buyer?
- Is there a deadline driving the sale (1031 exchange, divorce, estate, relocation)? That informs how much negotiation room exists.
- Schools are B-rated — typically a magnet for longer-tenancy family renters. What's the average tenant stay here, and is there a school-zone premium baked into asking?
- The area grade is low — what's the realistic commute time and amenity access for the typical tenant pool here? Any planned neighborhood developments (good or bad) we should know about?
- What's the average days-on-market for RENTAL listings here right now (not sales)? A rising rental-DOM trend means longer vacancies and softer asking-rent achievability than the comps imply.
- What's the recent tenant-quality profile in this submarket — average credit score on applications, eviction rate, late-payment / NSF rate, and stable-employment percentage? A property-management company in the area should have these aggregated.
- How much new apartment / multifamily construction is in the pipeline within 1–3 miles? Heavy new supply (>2% of stock underway) typically softens rents 12–24 months out; light construction supports rent growth.
Investment metrics
- 1% rule
- 1.22% ✓
- Cap rate
- 4.55%
- Cash-on-cash
- -6.23%
- DSCR
- 0.72
- GRM
- 6.9
CMA / ARV
No comps found within radius.
Projected returns pro-forma
-1.58% appreciation · 0.39% rent growth · sell at horizon
- IRR
- -20.4%
- Equity multiple
- 0.21×
- Total profit
- $-31,069
- Equity at exit
- $29,929
- IRR
- -19.6%
- Equity multiple
- -0.31×
- Total profit
- $-51,361
- Equity at exit
- $28,261
Cash invested: $39,172 (down + closing). Projections, not guarantees.
Landlord ↔ Tenant lean methodology
- Overall (STATE)
- 87 Strongly Landlord-Friendly
- State Florida
- 87 Strongly Landlord-Friendly · R+3
- County
- — inherits STATE
- City
- — inherits STATE
ZIP-level market 32256
- Home prices YoY
- -0.7%
- Rents YoY
- 0.4%
- Active inventory
- 513
- Price-to-rent
- 6.9×
Monthly cashflow live
- Estimated rent
- $1,700 high interval (Pro) →
- Mortgage (P&I)
- −$734
- Tax from tax record
- −$165 /mo · $1,975/yr
- Insurance
- −$58
- HOA
- −$590
- Vacancy / Maint / Mgmt
- −$357
- Net cashflow
- $-203
Break-even live
UW: 25.0% down · 7.5% · 30yr · 1.5% tax · 5.0% vac · 8.0% maint · 8.0% mgmt
Financing live
Cash to close
- Down payment
- $34,975
- Closing costs
- $4,197
- Reserves months
- —
- Total cash needed
- —
Loan-product check · same deal, 3 products live
Conventional
25% down · 7.5% · 30yr
- Down + closing
- —
- Monthly P&I
- —
- Monthly cashflow
- —
- DSCR
- —
- Eligible?
- —
Personal DTI + credit; lowest rate.
DSCR
20% down · 8.5% · 30yr
- Down + closing
- —
- Monthly P&I
- —
- Monthly cashflow
- —
- DSCR
- —
- Eligible?
- —
No personal income docs; deal must DSCR.
Hard money
10% down · 12.0% · 12mo
- Down + closing
- —
- Monthly P&I
- —
- Monthly cashflow
- —
- DSCR
- —
- Eligible?
- —
Short-term bridge; refi at stabilization.
Rent comps 40 comps
| Address | Beds | Baths | Sqft | Rent | $/sqft | DOM | Units | Dist |
|---|---|---|---|---|---|---|---|---|
| 7701 Baymeadows Cir W #1083 Jacksonville, FL | 2.0 | 2.5 | 1272 | $1,750 | $1.38 | 12d | 1 | 0.01mi |
| 9485 Star Dr Unit 1 Jacksonville, FL | 2.0 | 2.5 | 1450 | $1,725 | $1.19 | 24d | 1 | 0.19mi |
| 7616 Las Palmas Way #171 Jacksonville, FL | 3.0 | 2.0 | 1499 | $2,250 | $1.50 | 24d | 1 | 0.26mi |
| 7703 Las Palmas Way #176 Jacksonville, FL | 2.0 | 2.5 | 1389 | $1,450 | $1.04 | 24d | 1 | 0.29mi |
| 7766 Legacy Trl Jacksonville, FL | 3.0 | 2.5 | 1492 | $1,850 | $1.24 | 21d | 1 | 0.31mi |
| 9582 Star Dr Jacksonville, FL | 2.0 | 2.5 | 1202 | $1,725 | $1.44 | 20d | 1 | 0.33mi |
| 7670 Legacy Trl Jacksonville, FL | 3.0 | 2.5 | 1472 | $1,900 | $1.29 | 12d | 1 | 0.33mi |
| 7670 Legacy Trl Jacksonville, FL | 3.0 | 2.5 | 1492 | $1,900 | $1.27 | 24d | 1 | 0.33mi |
| 7700 Legacy Trl Jacksonville, FL | 2.0 | 2.5 | 1202 | $1,725 | $1.44 | 24d | 1 | 0.34mi |
| 7759 Legacy Trl Jacksonville, FL | 3.0 | 2.5 | 1492 | $1,895 | $1.27 | 17d | 1 | 0.34mi |
| 7745 Legacy Trl Jacksonville, FL | 3.0 | 2.5 | 1492 | $1,825 | $1.22 | 20d | 1 | 0.35mi |
| 9621 Baylin Ct Jacksonville, FL | 3.0 | 2.5 | 1492 | $1,795 | $1.20 | 14d | 1 | 0.38mi |
| 9621 Baylin Ct Jacksonville, FL | 3.0 | 2.5 | 1492 | $1,795 | $1.20 | 12d | 1 | 0.38mi |
| 7595 Baymeadows Cir W Jacksonville, FL | 1.0–3.0 | 1.0–2.0 | 1027 | $1,402 | $1.37 | 2d | 29 | 0.45mi |
| 7915 Baymeadows Cir E Jacksonville, FL | 1.0–3.0 | 1.0–2.5 | 1142 | $1,402 | $1.23 | 2d | 59 | 0.49mi |
| 9349 Arbolita Way Jacksonville, FL | 3.0 | 2.0 | 1281 | $1,700 | $1.33 | 24d | 1 | 0.53mi |
| 7740 Southside Blvd Jacksonville, FL | 1.0–3.0 | 1.0–2.0 | 1125 | $1,541 | $1.37 | 3d | 9 | 0.54mi |
| 7825 Echo Springs Rd Jacksonville, FL | 2.0 | 2.5 | 1202 | $1,700 | $1.41 | 7d | 1 | 0.58mi |
| 7846 Echo Springs Rd Jacksonville, FL | 2.0 | 2.5 | 1202 | $1,725 | $1.44 | 24d | 1 | 0.59mi |
| 9048 Alpine Aster Rd Jacksonville, FL | 3.0 | 2.5 | 1492 | $1,895 | $1.27 | 14d | 1 | 0.61mi |
| 9312 Kiskadee Ct Jacksonville, FL | 3.0 | 2.5 | 1492 | $1,945 | $1.30 | 14d | 1 | 0.63mi |
| 8025 Baymeadows Cir E Jacksonville, FL | 1.0–2.0 | 1.5–2.5 | 1115 | $1,699 | $1.52 | 3d | 7 | 0.67mi |
| 9803 Creekfront Rd Jacksonville, FL | 1.0–3.0 | 1.0–2.0 | 1084 | $1,534 | $1.41 | 3d | 79 | 0.68mi |
| 7929 Echo Springs Rd Jacksonville, FL | 2.0 | 2.5 | 1202 | $1,700 | $1.41 | 21d | 1 | 0.70mi |
| 8044 Echo Springs Rd Jacksonville, FL | 2.0 | 2.5 | 1327 | $1,725 | $1.30 | 24d | 1 | 0.71mi |
| 8068 Echo Springs Rd Jacksonville, FL | 2.0 | 2.5 | 1202 | $1,650 | $1.37 | 10d | 1 | 0.71mi |
| 7816 Southside Blvd Jacksonville, FL | 1.0–3.0 | 1.0–2.0 | 1115 | $2,182 | $1.96 | 2d | 1 | 0.73mi |
| 9191 Stony Brook Rd Jacksonville, FL | 2.0 | 2.5 | 1210 | $1,850 | $1.53 | 17d | 1 | 0.73mi |
| 8087 Echo Springs Rd Jacksonville, FL | 2.0 | 3.0 | 1300 | $1,700 | $1.31 | 24d | 1 | 0.75mi |
| 9139 Stony Brook Rd Jacksonville, FL | 3.0 | 2.5 | 1492 | $2,000 | $1.34 | 24d | 1 | 0.75mi |
| 7524 Southside Blvd Jacksonville, FL | 1.0–2.0 | 1.0–2.0 | 775 | $1,350 | $1.74 | 16d | 10 | 0.85mi |
| 9701 Old Baymeadows Rd Unit 26 Jacksonville, FL | 2.0 | 2.0 | 1200 | $1,350 | $1.12 | 24d | 1 | 0.87mi |
| 603 Clubhouse Ct #603 Jacksonville, FL | 2.0 | 1.5 | 1154 | $1,800 | $1.56 | 24d | 1 | 0.88mi |
| 8317 Asteroid St Jacksonville, FL | 2.0 | 2.5 | 1109 | $1,650 | $1.49 | 24d | 1 | 0.90mi |
| 4974 Key Lime Dr Jacksonville, FL | 2.0 | 2.0 | 927 | $1,650 | $1.78 | 24d | 1 | 0.90mi |
| 8409 Zenith Cir Jacksonville, FL | 2.0 | 2.5 | 1110 | $1,695 | $1.53 | 24d | 1 | 0.91mi |
| 4982 Key Lime Dr Jacksonville, FL | 3.0 | 2.0 | 1145 | $1,575 | $1.38 | 21d | 1 | 0.91mi |
| 4982 Key Lime Dr #107 Jacksonville, FL | 3.0 | 2.0 | 1145 | $1,600 | $1.40 | 3d | 1 | 0.91mi |
| 8330 Zenith Cir Jacksonville, FL | 2.0 | 3.0 | 1109 | $1,650 | $1.49 | 24d | 1 | 0.92mi |
| 8330 Zenith Cir Unit 1 Jacksonville, FL | 2.0 | 2.5 | 1109 | $1,650 | $1.49 | 24d | 1 | 0.92mi |
HOA detail condo
- Monthly dues
- $590 · $7,080/yr
- Likely covers
- watersewertrashlandscapingpoolsecurity
- Assessments
- None detected in remarks — confirm with the listing agent.
Listing history 2 events
-
2026-06-18remarks 699-char remark
-
2026-06-18$139,900 Active 1 DOM
ⓘ Source: listings_history table (triggers on properties + properties_extension) + one-shot
backfill from property_details.listing_events for pre-trigger history.
Tax reassessment forecast FL · Resets to sale price
- Current annual tax
- $1,975 · $165/mo
- Projected year-2 tax
- $1,975 · $165/mo
- Expected delta
- $0/yr ($0/mo · 0.0%)
ⓘ Screening estimate from a state-policy table — verify with the county assessor before closing.
Climate risk First Street
- Flood 4/10 Moderate FEMA zone X (unshaded) · 22% chance over 30 yrs
- Wildfire 4/10 Moderate
- Heat 9/10 Extreme 7 d/yr ≥107°F today · 20 d/yr by 30 yrs out
- Wind 10/10 Extreme 99% chance of damaging wind over 30 yrs
- Air quality 4/10 Moderate 4 unhealthy d/yr today · 6 by 30 yrs out
Nearby sold comps map
Loading sold comps map…
Walkable amenities ~0.75 mi
Loading nearby amenities…
Taxation est. · year 1
- Rental income
- $20,402
- − Mortgage interest
- −$7,837
- − Property taxes
- −$1,975
- − Insurance
- −$700
- − Repairs & maintenance
- −$1,632
- − Management
- −$1,632
- − HOA
- −$7,080
- − Depreciation
- −$4,070
- Taxable loss
- −$4,523
- Est. tax savings @ 24.0%
- +$1,086
- After-tax cash flow
- $-1,355/yr
For passive investors: Depreciation is non-cash, so a rental often shows a tax loss while cash-flowing — sheltering income. Rental losses are passive: they offset passive income freely, and up to $25,000/yr can offset ordinary (W-2) income if you actively participate and your MAGI is under $100k (phasing out to $0 by $150k); unused losses carry forward. On sale, claimed depreciation is recaptured at up to 25%, and gains may owe capital-gains tax (a 1031 exchange can defer both). Figures are a year-1 estimate at your 24.0% rate — not tax advice; consult a CPA.
Schools (NCES district)
- District
- Duval
- NCES district ID
- 1200480
- Math proficiency
- 46% ▼ -11.00%
- Reading proficiency
- 45% ▼ -4.00%
- Median HH income
- $48,987
- Composite
- 38.97/100
- National rank
- #4076
- State rank
- #48 of 73 in FL
Livability — Jacksonville
- Score
- 83/100
- State rank
- #50
- US rank
- #911
Category grades
Schools grade is shown separately in the Schools card above.
Census & demographics
- Census place
- Jacksonville, FL
- County
- Duval County · 1,015,274 people
- City population
- 979,034
- Metro
- Jacksonville, FL
- Population (ZIP)
- 58,192
- Household income
- $73,570
- Rent vs Own
- Severe rent burden
- 2706.0
Population outlook (Duval County) Hauer SSP2
- Today (2025)
- 1,013,010 people
- By 2030
- 1,059,228 · +4.6%
- By 2040
- 1,141,439 · +12.7%
- By 2050
- 1,205,258 · +19.0%
- By 2075
- 1,324,282 · +30.7%
- By 2100
- 1,319,620 · +30.3%
Race, ethnicity, and origin ACS 2023
- Neighborhood character
- Diverse neighborhood (Simpson 0.68)
- Race & ethnicity
- White 51% Black 18% Asian 13% Hispanic / Latino 11% Two or more races 10%
- Hispanic origin (detail)
- Puerto Rican 4% Cuban 1%
- Common ancestry
- Italian 4% Lithuanian 2% Romanian 2%
- Foreign-born
- 22% · Canada, Jamaica, China
- Languages at home
- 73% English-only · Spanish 9% Other Indo-European 6% Other Asian/Pacific 3%
Political lean MEDSL · Duval
- 2024 margin
- Toss-up / Even · D 48.7% · R 50.1% · Other 1.2%
- 2008→2024 swing
- +0.4pp no change · 2008: -1.9pp · 2024: -1.5pp
- All cycles
- 2024: R+1.5 2020: D+3.8 2016: R+1.5 2012: R+3.6 2008: R+1.9
Not yet ingested
- Civics
- —
Market trends
- HPI YoY
- ▼ -1.58%
- Current HPI
- 216.5115
- Rent YoY
- ▲ 0.39%
- Metro
- Jacksonville, FL
- State GDP YoY
- ▲ 3.28%
- F500 in state
- 36
Industry mix (Fortune 500 HQ in FL)
| Industry | F500 HQs | Revenue |
|---|---|---|
| Industrial Technology | 2 | $29B |
|
||
| Insurance | 2 | $17B |
|
||
| Retail | 1 | $60B |
|
||
| Technology Distribution | 1 | $58B |
|
||
| Homebuilding | 1 | $35B |
|
||
| Technology Manufacturing | 1 | $35B |
|
||
Price history
+97.0% since first listed34 events — show timeline
- 2026-06-17 Listed $139,900 realMLS
- 2025-02-13 Sold (MLS) $124,148 realMLS
- 2025-01-10 Pending — realMLS
- 2024-12-13 Price Changed $135,000 realMLS
- 2024-12-13 Relisted — realMLS
- 2024-12-12 Pending — realMLS
- 2024-11-22 Price Changed $150,000 realMLS
- 2024-11-04 Price Changed $155,000 realMLS
- 2024-10-21 Price Changed $160,000 realMLS
- 2024-09-20 Listed $165,000 realMLS
- 2020-08-21 Sold (Public Records) $45,000 Public Records
- 2020-05-05 Listing Removed — realMLS
- 2020-05-01 Price Changed $94,700 realMLS
- 2020-04-28 Price Changed $94,800 realMLS
- 2020-04-24 Price Changed $94,900 realMLS
- 2020-04-21 Price Changed $95,000 realMLS
- 2020-04-17 Price Changed $98,800 realMLS
- 2020-04-14 Price Changed $98,900 realMLS
- 2020-04-08 Listed $99,000 realMLS
- 2012-11-08 Sold (Public Records) $45,000 Public Records
- 2012-10-04 Sold (MLS) $45,000 realMLS
- 2012-06-22 Listed $45,000 realMLS
- 2005-12-22 Sold (Public Records) $125,000 Public Records
- 2005-12-16 Listing Removed — realMLS
- 2005-12-15 Sold (MLS) $125,000 realMLS
- 2005-09-21 Listed $128,500 realMLS
- 2003-08-26 Sold (Public Records) $101,428 Public Records
- 2003-08-12 Listing Removed — realMLS
- 2003-08-08 Sold (MLS) $101,500 realMLS
- 2003-06-05 Listed $105,000 realMLS
- 2002-03-18 Listing Removed — realMLS
- 2001-11-12 Listed $94,900 realMLS
- 1991-06-01 Sold (Public Records) $58,000 Public Records
- 1983-11-01 Sold (Public Records) $71,000 Public Records
Property tax history
+8.7%/yrLatest (2025): $1,975 · +3.1% YoY. Source: county tax records.
Cash-flow waterfall
monthlySold comps — $/sqft
last 12 mo · ≤1 miLoading sold comps…