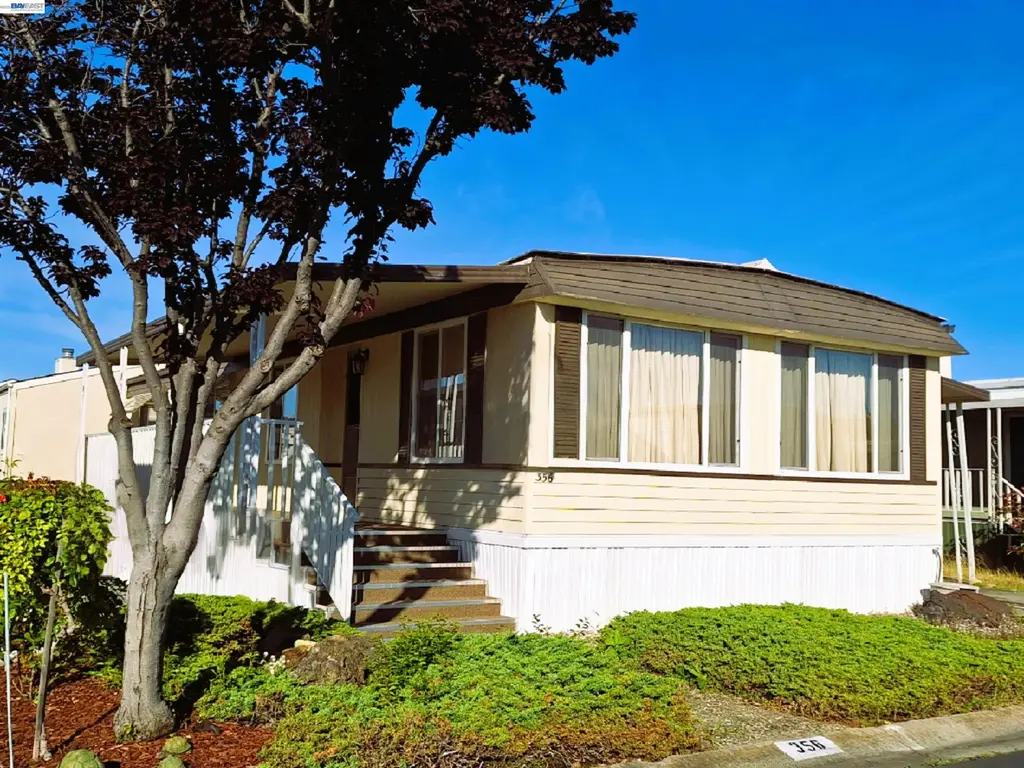
356 Santa Paula · San Leandro, CA
Flood risk 1/10 · Minimal
- FEMA flood zone
- X (shaded)
- Chance of flooding over 30 yrs
- 0.0%
- Est. flood insurance / yr
- $507 – $1,088
Fire risk 1/10 · Minimal
- Est. fire insurance / yr
- $659 – $1,223
Heat risk 3/10 · Minor
- Hot days now (above 85°F)
- 7 days/yr
- Hot days in 30 yrs
- 15 days/yr
Wind risk 1/10 · Minimal
- Chance of severe wind over 30 yrs
- —
Air-quality risk 8/10 · Major
- Unhealthy air days now
- 14 days/yr
- Unhealthy air days in 30 yrs
- 14 days/yr
Risk factors via First Street. Map © Google.
Why this score? — see what drove the B+ grade
The composite is a weighted blend of 9 inputs, each scored 0–100. Each bar is that input's sub-score; the figure is the points it added to the 100-point composite (weight × sub-score).
- Cash flow +30.0/30.0
- ARV discount +15.0/15.0
- 1% rule +10.0/10.0
- DSCR +10.0/10.0
- Livability +3.4/5.0
- Schools +2.9/10.0
- Rent growth +2.5/5.0
- Condition / age +2.5/5.0
- Appreciation +0.0/10.0
$135,000
🖨 Deal sheet (PDF) 📄 Offer letter ✓ Due diligence
Listing remarks MLS
ORIGINAL OWNER, WELL MAINTAINED, HAS EARTH- QUAKE BRACING, WATER FILTERING SYSTEM, LOW RENT AND IS LOCATED IN A FIRST CLASS PARK!
Key facts
- Hot tub
- Sauna
- Swimming pool
Tags
Neighborhood map
What this means for you Summary
Snapshot
- This is a 2-bed/2.0-bath manufactured listed at $135k.
Deal economics
- At list price, monthly cash flow is $1k ($16k/yr) — positive.
- The deal already cash-flows at list — no discount required.
- Meets the 1% rule at list price ($3k rent vs $135k).
- Cap rate 18.1% vs local median 2.0% in San Leandro — top-decile yield for the area; either an underpriced asset or a hidden risk that comps aren't pricing in. Stress-test before assuming the spread holds.
Location & tenants
- Location reads 68/100 on livability (#289 in CA) — a middle-class / working-renter tenant base. Strengths: commute A+, employment A+, health & safety A+; Watch: amenities C-, schools D, crime F.
- San Lorenzo Unified (suburban): math 23% / reading 33% proficiency, ranked #1,044 of 1,400 in CA (top 75%) — low school quality limits family demand, transient renter base, plan for 1-2y turnover.
- Market conditions: 33 active listings in the ZIP; 7 comparable units currently listed for rent nearby; rentals leasing fast (median 6d on market — plan ~1-2 weeks tenant-placement turnaround); 1,742 units permitted in Alameda County in 2024 (856 in 5+ unit buildings).
Forward outlook
- Local home prices are declining (-3.0%/yr); year-one equity from $933 of loan paydown is wiped out by about $4k of value loss. Plan a longer hold.
- Alameda County population projected at +34% by 2050 — long-run rental-demand tailwind backs the buy-and-hold thesis.
- At projected returns (-3.0% appreciation + 3.0% rent growth), your $38k cash investment doubles in ~3 years — after that, you're playing with house money.
Negotiation context
- Only 7 days on market — expect competitive offers; lowballing is unlikely to land.
- 3 sale attempts since 28y ago; this cycle's ask is 4% above the opening price — seller raised mid-cycle; expect resistance to lowballs.
- Current owner paid $52k; list at $135k implies a 162% gain — meaningful room to come down on a strong offer.
Questions for the listing agent
- Built in 1971 — when were the roof, HVAC, electrical panel, plumbing, and water heater last replaced?
- Is there a deadline driving the sale (1031 exchange, divorce, estate, relocation)? That informs how much negotiation room exists.
- Schools are D-rated, which usually means shorter tenancies and higher turnover. Who's the typical renter profile here, and what's been the actual vacancy rate?
- Crime grade is F in this area — have there been break-ins, vandalism, or insurance claims at this property in the last 3 years? What carrier currently insures it and at what premium?
- What's the average days-on-market for RENTAL listings here right now (not sales)? A rising rental-DOM trend means longer vacancies and softer asking-rent achievability than the comps imply.
- What's the recent tenant-quality profile in this submarket — average credit score on applications, eviction rate, late-payment / NSF rate, and stable-employment percentage? A property-management company in the area should have these aggregated.
- How much new for-sale + rental construction is in the pipeline within 1–3 miles? Heavy new supply typically softens prices + rents 12–24 months out; constrained supply supports both.
Investment metrics
- 1% rule
- 2.12% ✓
- Cap rate
- 18.09%
- Cash-on-cash
- 42.13%
- DSCR
- 2.87
- GRM
- 3.9
CMA / ARV
- ARV (on-the-fly)
- $184,800
- Comps found
- 12
Show comp detail 12 sales within ~0.75 mi
| Address | Dist | Beds/Ba | Sqft | Sold | Price | $/sf | Match |
|---|---|---|---|---|---|---|---|
| 191 Santa Teresa | 0.16mi | 2/2.0 | 1,152 (-4%) | 3mo | $128,000 | $111 | 83 |
| 264 Santa Susana | 0.05mi | 2/2.0 | 1,344 (+12%) | 4mo | $210,000 | $156 | 74 |
| 411 Santa Monica | 0.22mi | 2/2.0 | 1,156 (-4%) | 15mo | $205,000 | $177 | 71 |
| 455 Santa Monica | 0.04mi | 2/2.0 | 1,296 (+8%) | 21mo | $305,000 | $235 | 68 |
| 450 Santa Monica #450 | 0.05mi | 2/2.0 | 1,056 (-12%) | 12mo | $160,000 | $152 | 67 |
| 137 Santa Teresa | 0.14mi | 2/2.0 | 1,058 (-12%) | 12mo | $115,000 | $109 | 64 |
| 541 Santa Ynez | 0.09mi | 2/2.0 | 1,368 (+14%) | 13mo | $204,500 | $149 | 62 |
| 440 Santa Monica | 0.09mi | 3/2.0 (+1) | 1,368 (+14%) | 7mo | $211,000 | $154 | 62 |
| 109 Santa Teresa | 0.25mi | 2/2.0 | 1,080 (-10%) | 13mo | $195,000 | $181 | 61 |
| 112 Santa Teresa | 0.23mi | 2/2.0 | 1,368 (+14%) | 7mo | $159,900 | $117 | 60 |
| 105 Santa Teresa | 0.26mi | 2/2.0 | 1,368 (+14%) | 8mo | $182,000 | $133 | 57 |
| 201 Santa Susana | 0.27mi | 2/2.0 | 1,332 (+11%) | 19mo | $280,000 | $210 | 53 |
Match score weights: distance 35% · size 25% · config 20% · recency 20%. Top-matched comps best support the ARV.
Projected returns pro-forma
-3.0% appreciation · 3.0% rent growth · sell at horizon
- IRR
- 38.8%
- Equity multiple
- 2.66×
- Total profit
- $62,690
- Equity at exit
- $20,129
- IRR
- 45.3%
- Equity multiple
- 5.33×
- Total profit
- $163,601
- Equity at exit
- $11,672
Cash invested: $37,800 (down + closing). Projections, not guarantees.
Landlord ↔ Tenant lean methodology
- Overall (STATE)
- 18 Strongly Tenant-Friendly
- State California
- 18 Strongly Tenant-Friendly · D+13
- County
- — inherits STATE
- City
- — inherits STATE
ZIP-level market 94579
- Active inventory
- 33
- Price-to-rent
- 3.9×
Monthly cashflow live
- Estimated rent
- $2,861 high interval (Pro) →
- Mortgage (P&I)
- −$708
- Tax est. 1.5%
- −$169 /mo · $2,025/yr
- Insurance
- −$56
- HOA
- −$0
- Vacancy / Maint / Mgmt
- −$601
- Net cashflow
- $1,327
Break-even live
Sensitivity live
| Price | -10% $1,420 | -5% $1,374 | +0% $1,327 | +5% $1,280 | +10% $1,234 |
|---|---|---|---|---|---|
| Rent | -10% $1,101 | -5% $1,214 | +0% $1,327 | +5% $1,440 | +10% $1,553 |
| Rate | -1.0pp $1,395 | -0.5pp $1,361 | base $1,327 | +0.5pp $1,292 | +1.0pp $1,257 |
UW: 25.0% down · 7.5% · 30yr · 1.5% tax · 5.0% vac · 8.0% maint · 8.0% mgmt
Financing live
Cash to close
- Down payment
- $33,750
- Closing costs
- $4,050
- Reserves months
- —
- Total cash needed
- —
Loan-product check · same deal, 3 products live
Conventional
25% down · 7.5% · 30yr
- Down + closing
- —
- Monthly P&I
- —
- Monthly cashflow
- —
- DSCR
- —
- Eligible?
- —
Personal DTI + credit; lowest rate.
DSCR
20% down · 8.5% · 30yr
- Down + closing
- —
- Monthly P&I
- —
- Monthly cashflow
- —
- DSCR
- —
- Eligible?
- —
No personal income docs; deal must DSCR.
Hard money
10% down · 12.0% · 12mo
- Down + closing
- —
- Monthly P&I
- —
- Monthly cashflow
- —
- DSCR
- —
- Eligible?
- —
Short-term bridge; refi at stabilization.
Rent comps 7 comps
| Address | Beds | Baths | Sqft | Rent | $/sqft | DOM | Units | Dist |
|---|---|---|---|---|---|---|---|---|
| 2015 Quebec Ave Unit C San Leandro, CA | 2.0 | 1.0 | 750 | $2,450 | $3.27 | 25d | 1 | 0.30mi |
| 941 Lewelling Blvd San Leandro, CA | 2.0 | 1.0 | 925 | $2,525 | $2.73 | 44d | 1 | 0.91mi |
| 724 Lewelling Blvd San Leandro, CA | 1.0 | 1.0 | 950 | $2,338 | $2.46 | 25d | 1 | 1.05mi |
| Corvallis St San Leandro, CA | 3.0 | 1.0 | 1100 | $3,600 | $3.27 | 0d | 1 | 1.25mi |
| 13897 Doolittle Dr San Leandro, CA | 2.0 | 1.0–1.5 | 785 | $2,542 | $3.24 | 6d | 6 | 1.47mi |
| 13933 Santiago Rd San Leandro, CA | 3.0 | 2.0 | 1336 | $3,800 | $2.84 | 2d | 1 | 1.49mi |
| 13933 Santiago Rd San Leandro, CA | 3.0 | 2.0 | 1336 | $3,800 | $2.84 | 0d | 1 | 1.49mi |
Listing history 8 events
-
2026-06-07pricedays on market $135,000 Pending 7 DOM
-
2026-04-26status Pending
-
2026-04-20$130,000 Active
-
1998-11-30soldstatus $51,500 129-char remark
Show marketing remark (129 chars)
ORIGINAL OWNER, WELL MAINTAINED, HAS EARTH- QUAKE BRACING, WATER FILTERING SYSTEM, LOW RENT AND IS LOCATED IN A FIRST CLASS PARK!
-
1998-11-24soldstatus $51,500 129-char remark
Show marketing remark (129 chars)
ORIGINAL OWNER, WELL MAINTAINED, HAS EARTH- QUAKE BRACING, WATER FILTERING SYSTEM, LOW RENT AND IS LOCATED IN A FIRST CLASS PARK!
-
1998-11-01historical 129-char remark
Show marketing remark (129 chars)
ORIGINAL OWNER, WELL MAINTAINED, HAS EARTH- QUAKE BRACING, WATER FILTERING SYSTEM, LOW RENT AND IS LOCATED IN A FIRST CLASS PARK!
-
1998-10-23$54,950 129-char remark
Show marketing remark (129 chars)
ORIGINAL OWNER, WELL MAINTAINED, HAS EARTH- QUAKE BRACING, WATER FILTERING SYSTEM, LOW RENT AND IS LOCATED IN A FIRST CLASS PARK!
-
1998-10-21$54,950 129-char remark
Show marketing remark (129 chars)
ORIGINAL OWNER, WELL MAINTAINED, HAS EARTH- QUAKE BRACING, WATER FILTERING SYSTEM, LOW RENT AND IS LOCATED IN A FIRST CLASS PARK!
ⓘ Source: listings_history table (triggers on properties + properties_extension) + one-shot
backfill from property_details.listing_events for pre-trigger history.
Climate risk First Street
- Flood 1/10 Low FEMA zone X (shaded) · 0% chance over 30 yrs
- Wildfire 1/10 Low
- Heat 3/10 Moderate 7 d/yr ≥85°F today · 15 d/yr by 30 yrs out
- Wind 1/10 Low
- Air quality 8/10 Severe 14 unhealthy d/yr today · 14 by 30 yrs out
Nearby sold comps map
Loading sold comps map…
Walkable amenities ~0.75 mi
Loading nearby amenities…
Taxation est. · year 1
- Rental income
- $34,330
- − Mortgage interest
- −$7,562
- − Property taxes
- −$2,025
- − Insurance
- −$675
- − Repairs & maintenance
- −$2,746
- − Management
- −$2,746
- − Depreciation
- −$3,927
- Taxable income
- $14,648
- Est. tax owed @ 24.0%
- −$3,515
- After-tax cash flow
- $12,410/yr
For passive investors: Depreciation is non-cash, so a rental often shows a tax loss while cash-flowing — sheltering income. Rental losses are passive: they offset passive income freely, and up to $25,000/yr can offset ordinary (W-2) income if you actively participate and your MAGI is under $100k (phasing out to $0 by $150k); unused losses carry forward. On sale, claimed depreciation is recaptured at up to 25%, and gains may owe capital-gains tax (a 1031 exchange can defer both). Figures are a year-1 estimate at your 24.0% rate — not tax advice; consult a CPA.
Schools (NCES district)
- District
- San Lorenzo Unified
- NCES district ID
- 0634710
- Math proficiency
- 23% ▬ 0.00%
- Reading proficiency
- 33% ▼ -1.00%
- Median HH income
- $61,114
- Composite
- 28.5/100
- National rank
- #12087
- State rank
- #1044 of 1400 in CA
Livability — San Leandro
- Score
- 68/100
- State rank
- #289
- US rank
- #9768
Category grades
Schools grade is shown separately in the Schools card above.
Census & demographics
- Census place
- San Leandro, CA
- City population
- 88,086
- Population (ZIP)
- 19,955
Population outlook (Alameda County) Hauer SSP2
- Today (2025)
- 1,928,884 people
- By 2030
- 2,069,146 · +7.3%
- By 2040
- 2,338,405 · +21.2%
- By 2050
- 2,586,608 · +34.1%
- By 2075
- 3,061,911 · +58.7%
- By 2100
- 3,234,133 · +67.7%
Race, ethnicity, and origin ACS 2023
- Neighborhood character
- Diverse neighborhood (Simpson 0.64)
- Race & ethnicity
- Asian 54% White 20% Hispanic / Latino 17% Two or more races 9% Black 3% Pacific Islander 1%
- Hispanic origin (detail)
- Mexican 11% Puerto Rican 2%
- Common ancestry
- Russian 7% American 1% Slovak 1%
- Foreign-born
- 44% · China, Canada, Vietnam
- Languages at home
- 42% English-only · Chinese 34% Spanish 9% Tagalog/Filipino 5%
Political lean MEDSL · Alameda
- 2024 margin
- Solid D (+53.6) · D 74.6% · R 21.0% · Other 4.4%
- 2008→2024 swing
- -5.9pp toward R · 2008: 59.5pp · 2024: 53.6pp
- All cycles
- 2024: D+53.6 2020: D+62.5 2016: D+64.4 2012: D+59.8 2008: D+59.5
Not yet ingested
- Civics
- —
Market trends
- HPI YoY
- ▼ -797.47%
- Current HPI
- 272.3821
- Rent YoY
- —
- Metro
- —
- State GDP YoY
- ▲ 3.21%
- F500 in state
- 116
Industry mix (Fortune 500 HQ in CA)
| Industry | F500 HQs | Revenue |
|---|---|---|
| Technology | 27 | $1,492B |
|
||
| Financial Services | 3 | $174B |
|
||
| Retail | 3 | $44B |
|
||
| Insurance | 3 | $26B |
|
||
| Media / Entertainment | 2 | $115B |
|
||
| Pharmaceuticals / Biotech | 2 | $62B |
|
||
Price history
+136.6% since first listed7 events — show timeline
- 2026-04-26 Pending — bridgeMLS, Bay East AOR, or Contra Costa AOR
- 2026-04-20 Listed $130,000 bridgeMLS, Bay East AOR, or Contra Costa AOR
- 1998-11-30 Sold (MLS) $51,500 bridgeMLS, Bay East AOR, or Contra Costa AOR
- 1998-11-24 Sold (MLS) $51,500 bridgeMLS, Bay East AOR, or Contra Costa AOR
- 1998-11-01 Listing Removed — bridgeMLS, Bay East AOR, or Contra Costa AOR
- 1998-10-23 Listed $54,950 bridgeMLS, Bay East AOR, or Contra Costa AOR
- 1998-10-21 Listed $54,950 bridgeMLS, Bay East AOR, or Contra Costa AOR
Cash-flow waterfall
monthlySold comps — $/sqft
last 12 mo · ≤1 miLoading sold comps…