 🏗️ New Construction
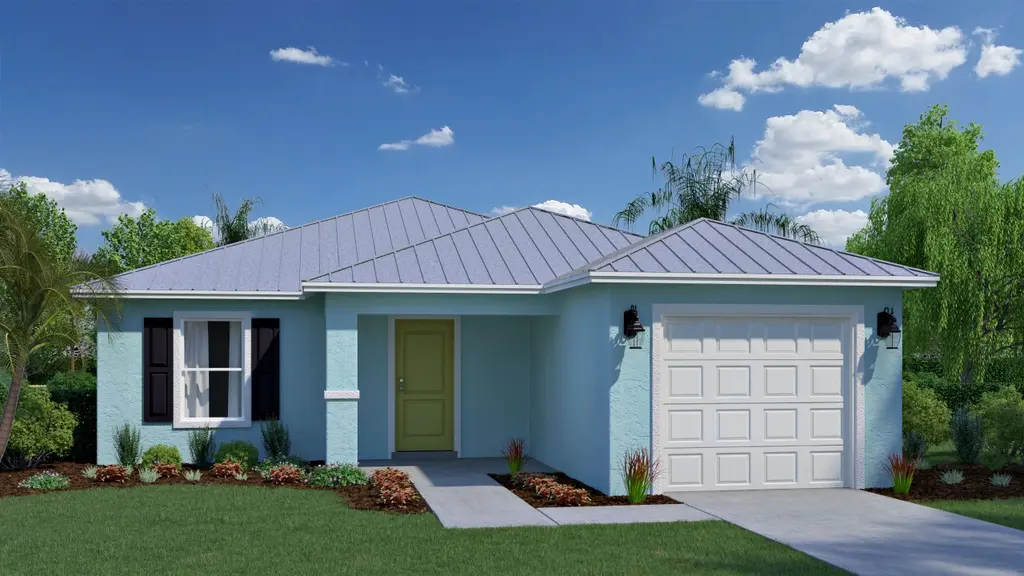
Horizon Plan · Lakewood Park, FL
Flood risk 3/10 · Minor
- FEMA flood zone
- X (unshaded)
- Chance of flooding over 30 yrs
- 0.2%
- Est. flood insurance / yr
- $507 – $1,088
Fire risk 4/10 · Minor
- Est. fire insurance / yr
- $947 – $1,759
Heat risk 10/10 · Severe
- Hot days now (above 107°F)
- 7 days/yr
- Hot days in 30 yrs
- 25 days/yr
Wind risk 10/10 · Severe
- Chance of severe wind over 30 yrs
- 99.0%
Air-quality risk 1/10 · Minimal
- Unhealthy air days now
- 0 days/yr
- Unhealthy air days in 30 yrs
- 0 days/yr
Risk factors via First Street. Map © Google.
Why this score? — see what drove the D grade
The composite is a weighted blend of 9 inputs, each scored 0–100. Each bar is that input's sub-score; the figure is the points it added to the 100-point composite (weight × sub-score).
- Cash flow +14.0/30.0
- ARV discount +7.5/15.0
- DSCR +4.2/10.0
- Condition / age +4.0/5.0
- 1% rule +3.9/10.0
- Schools +3.7/10.0
- Livability +3.2/5.0
- Rent growth +2.5/5.0
- Appreciation +0.0/10.0
$238,990
🖨 Deal sheet (PDF) 📄 Offer letter ✓ Due diligence
Listing remarks
The Horizon is a bright and inviting home designed for comfort, simplicity, and effortless Florida living. With 1,135 square feet of well-planned space, this two-bedroom layout is ideal for those who want a cozy low-maintenance home while still enjoying the amenities and lifestyle of Spanish Lakes. A covered entry leads you into a welcoming foyer that opens directly into the spacious great room. This open living area is the heart of the home, offering plenty of room for relaxing, hosting friends, or enjoying a quiet morning with the sun coming through the windows. The great room flows into a thoughtfully designed kitchen that features an island, generous counter space, a pantry, and a comfo
Key facts
- Spacious great room
- Walk-in closet
- Welcoming foyer
Tags
Property features AI
Finance
- Financial info: List price $227,990
Exterior
- Parking: 1-car garage (1 total parking space)
- Home design: Single-family plan home located in Fort Pierce
- Exterior features: Living area approximately 1,135
Interior
- Bedrooms: 2 bedrooms
- Bathrooms: 2 full bathrooms
- Interior features: Plan home (Horizon)
Neighborhood map
What this means for you Summary
Snapshot
- This is a 2-bed/2.0-bath single-family listed at $239k. Condition is rated good.
Deal economics
- At list price, monthly cash flow is $29 ($348/yr) — positive.
- The deal already cash-flows at list — no discount required.
- To meet the 1% rule (rent ≥ 1% of price), the offer needs to be $215k (10.0% below list).
- Recommended offer: $215k (10.0% below list) — sets the bar for 1% rule.
Location & tenants
- Location reads 63/100 on livability (#719 in FL) — a middle-class / working-renter tenant base. Strengths: cost of living A+, housing A+; Watch: amenities F, commute F, health & safety D-.
- St. Lucie (urban): math 40% / reading 48% proficiency, ranked #51 of 73 in FL (top 70%) — families likely to look elsewhere, expect single-tenant / working-renter base with shorter leases.
- Zoned schools: Manatee Academy K-8 (math 53% / reading 51%, grade C-, #990 of 2,144 statewide, top 48%, 1,664 students, 65% FRL); Southern Oaks Middle School (math 39% / reading 43%, grade F, #353 of 571 statewide, top 63%, 894 students, 76% FRL); Fort Pierce Central High School (math 15% / reading 45%, grade F, #441 of 667 statewide, top 67%, 3,091 students, 62% FRL).
- Market conditions: 296 active listings in the ZIP; 8 comparable units currently listed for rent nearby; rentals at typical pace (median 23d on market — plan ~3-4 weeks tenant-placement turnaround); 4,868 units permitted in St. Lucie County in 2024 (268 in 5+ unit buildings).
- This rent runs 41% of the median local income ($63k/yr) — at the standard rent-burdened threshold; future hikes will face affordability resistance.
Forward outlook
- Local home prices are declining (-3.0%/yr); year-one equity from $2k of loan paydown is wiped out by about $7k of value loss. Plan a longer hold.
- St. Lucie County population projected at +20% by 2050 — long-run rental-demand tailwind backs the buy-and-hold thesis.
Negotiation context
- It's been on market 68 days — a 6% lower offer ($225k) is reasonable based on typical stale-listing flexibility.
Risks & watch-outs
- Climate carrying-cost: severe wind risk, 99% chance of damaging wind over 30y; extreme-heat days projected 7→25/yr by 2055 (HVAC capex compounding) — expect insurance premiums to compound above CPI over the hold.
Questions for the listing agent
- It's been on market 68 days. Have you received any prior offers? Is the seller open to a 10% concession, seller financing, or rate buy-down credit?
- Why hasn't it sold? Are there any deal-killer items the seller is aware of (foundation, flood, title, zoning, code violations)?
- Is there a deadline driving the sale (1031 exchange, divorce, estate, relocation)? That informs how much negotiation room exists.
- Schools are F-rated, which usually means shorter tenancies and higher turnover. Who's the typical renter profile here, and what's been the actual vacancy rate?
- The area grade is low — what's the realistic commute time and amenity access for the typical tenant pool here? Any planned neighborhood developments (good or bad) we should know about?
- What's the average days-on-market for RENTAL listings here right now (not sales)? A rising rental-DOM trend means longer vacancies and softer asking-rent achievability than the comps imply.
- What's the recent tenant-quality profile in this submarket — average credit score on applications, eviction rate, late-payment / NSF rate, and stable-employment percentage? A property-management company in the area should have these aggregated.
- How much new for-sale + rental construction is in the pipeline within 1–3 miles? Heavy new supply typically softens prices + rents 12–24 months out; constrained supply supports both.
Investment metrics
- 1% rule
- 0.89% ✗
- Cap rate
- 6.44%
- Cash-on-cash
- 0.51%
- DSCR
- 1.02
- GRM
- 9.4
CMA / ARV
- ARV (on-the-fly)
- $241,755
- Comps found
- 12
Show comp detail 12 sales within ~0.75 mi
| Address | Dist | Beds/Ba | Sqft | Sold | Price | $/sf | Match |
|---|---|---|---|---|---|---|---|
| 5809 Killarney Ave | 0.70mi | 2/2.0 | 1,125 (-1%) | 4mo | $240,000 | $213 | 63 |
| 5711 Killarney Ave | 0.74mi | 2/2.0 | 1,112 (-2%) | 11mo | $200,000 | $180 | 53 |
| 3 Quito | 0.31mi | 1/1.5 (-1) | 1,305 (+15%) | 2mo | $249,000 | $191 | 52 |
| 11 Villa Blanca | 0.22mi | 1/1.5 (-1) | 1,305 (+15%) | 8mo | $249,000 | $191 | 51 |
| 674 25th St SW | 0.74mi | 3/2.0 (+1) | 1,176 (+4%) | 5mo | $215,000 | $183 | 50 |
| 6905 Bayard Rd | 0.69mi | 2/2.0 | 1,075 (-5%) | 11mo | $305,000 | $284 | 50 |
| 6506 Deland Ave | 0.43mi | 2/2.0 | 1,008 (-11%) | 15mo | $250,000 | $248 | 48 |
| 6806 Pensacola Rd | 0.61mi | 3/2.0 (+1) | 1,244 (+10%) | 5mo | $305,000 | $245 | 47 |
| 5 Villa Maria | 0.36mi | 1/1.5 (-1) | 1,305 (+15%) | 8mo | $249,000 | $191 | 44 |
| 6806 Lakeland Blvd | 0.64mi | 3/2.0 (+1) | 1,263 (+11%) | 10mo | $313,000 | $248 | 38 |
| 6604 Donlon | 0.55mi | 3/2.0 (+1) | 1,273 (+12%) | 15mo | $294,990 | $232 | 36 |
| 11 Villa Del Norte | 0.67mi | 1/1.5 (-1) | 1,305 (+15%) | 7mo | $249,000 | $191 | 31 |
Match score weights: distance 35% · size 25% · config 20% · recency 20%. Top-matched comps best support the ARV.
Projected returns pro-forma
-3.0% appreciation · 3.0% rent growth · sell at horizon
- IRR
- -15.5%
- Equity multiple
- 0.45×
- Total profit
- $-37,296
- Equity at exit
- $36,046
- IRR
- -6.9%
- Equity multiple
- 0.56×
- Total profit
- $-29,968
- Equity at exit
- $20,903
Cash invested: $67,691 (down + closing). Projections, not guarantees.
Landlord ↔ Tenant lean methodology
- Overall (STATE)
- 87 Strongly Landlord-Friendly
- State Florida
- 87 Strongly Landlord-Friendly · R+3
- County
- — inherits STATE
- City
- — inherits STATE
ZIP-level market 34951
- Home prices YoY
- -23.6%
- Active inventory
- 296
- Price-to-rent
- 9.3×
Monthly cashflow live
- Estimated rent
- $2,152 high interval (Pro) →
- Mortgage (P&I)
- −$1,268
- Tax est. 1.5%
- −$302 /mo · $3,626/yr
- Insurance
- −$101
- HOA
- −$0
- Vacancy / Maint / Mgmt
- −$452
- Net cashflow
- $29
Break-even live
Sensitivity live
| Price | -10% $196 | -5% $113 | +0% $29 | +5% $-55 | +10% $-138 |
|---|---|---|---|---|---|
| Rent | -10% $-141 | -5% $-56 | +0% $29 | +5% $114 | +10% $199 |
| Rate | -1.0pp $151 | -0.5pp $90 | base $29 | +0.5pp $-34 | +1.0pp $-97 |
UW: 25.0% down · 7.5% · 30yr · 1.5% tax · 5.0% vac · 8.0% maint · 8.0% mgmt
Financing live
Cash to close
- Down payment
- $60,439
- Closing costs
- $7,253
- Reserves months
- —
- Total cash needed
- —
Loan-product check · same deal, 3 products live
Conventional
25% down · 7.5% · 30yr
- Down + closing
- —
- Monthly P&I
- —
- Monthly cashflow
- —
- DSCR
- —
- Eligible?
- —
Personal DTI + credit; lowest rate.
DSCR
20% down · 8.5% · 30yr
- Down + closing
- —
- Monthly P&I
- —
- Monthly cashflow
- —
- DSCR
- —
- Eligible?
- —
No personal income docs; deal must DSCR.
Hard money
10% down · 12.0% · 12mo
- Down + closing
- —
- Monthly P&I
- —
- Monthly cashflow
- —
- DSCR
- —
- Eligible?
- —
Short-term bridge; refi at stabilization.
Rent comps 8 comps
| Address | Beds | Baths | Sqft | Rent | $/sqft | DOM | Units | Dist |
|---|---|---|---|---|---|---|---|---|
| 5642 Sunberry Cir Fort Pierce, FL | 3.0 | 2.0 | 1377 | $1,950 | $1.42 | 25d | 1 | 0.50mi |
| 6906 Ocala Ave Fort Pierce, FL | 3.0 | 2.0 | 1175 | $1,955 | $1.66 | 15d | 1 | 0.70mi |
| 2450 8th Ave SW Vero Beach, FL | 3.0 | 2.0 | 1388 | $2,100 | $1.51 | 23d | 1 | 0.83mi |
| 7500 Pensacola Rd Fort Pierce, FL | 3.0 | 2.0 | 1125 | $2,150 | $1.91 | 15d | 1 | 0.99mi |
| 985 23rd Pl SW Vero Beach, FL | 3.0 | 2.0 | 1176 | $2,200 | $1.87 | 23d | 1 | 1.04mi |
| 7403 Winter Garden Pkwy Fort Pierce, FL | 3.0 | 2.0 | 1372 | $2,200 | $1.60 | 23d | 1 | 1.04mi |
| 7503 Paso Robles Blvd Fort Pierce, FL | 3.0 | 2.0 | 1260 | $2,000 | $1.59 | 25d | 1 | 1.06mi |
| 3766 Harborside Ave Fort Pierce, FL | 2.0 | 2.0 | 1308 | $2,160 | $1.65 | 15d | 1 | 1.26mi |
Listing history 17 events
-
2026-06-21days on market $238,990 Active 68 DOM
-
2026-06-18days on market $238,990 Active 65 DOM
-
2026-06-17days on market $238,990 Active 64 DOM
-
2026-06-16days on market $238,990 Active 63 DOM
-
2026-06-15days on market $238,990 Active 62 DOM
-
2026-06-14days on market $238,990 Active 60 DOM
-
2026-06-13days on market $238,990 Active 59 DOM
-
2026-06-10days on market $238,990 Active 57 DOM
-
2026-06-09days on market $238,990 Active 56 DOM
-
2026-06-08days on market $238,990 Active 55 DOM
-
2026-06-07days on market $238,990 Active 54 DOM
-
2026-06-05days on market $238,990 Active 51 DOM
-
2026-06-03pricedays on market $238,990 Active 50 DOM
-
2026-06-02days on market $227,990 Active 49 DOM
-
2026-06-01days on market $227,990 Active 48 DOM
-
2026-05-31days on market $227,990 Active 47 DOM
-
2026-05-30days on market $227,990 Active 46 DOM
ⓘ Source: listings_history table (triggers on properties + properties_extension) + one-shot
backfill from property_details.listing_events for pre-trigger history.
Climate risk First Street
- Flood 3/10 Moderate FEMA zone X (unshaded) · 20% chance over 30 yrs
- Wildfire 4/10 Moderate
- Heat 10/10 Extreme 7 d/yr ≥107°F today · 25 d/yr by 30 yrs out
- Wind 10/10 Extreme 99% chance of damaging wind over 30 yrs
- Air quality 1/10 Low 0 unhealthy d/yr today · 0 by 30 yrs out
Nearby sold comps map
Loading sold comps map…
Walkable amenities ~0.75 mi
Loading nearby amenities…
Taxation est. · year 1
- Rental income
- $25,818
- − Mortgage interest
- −$13,542
- − Property taxes
- −$3,626
- − Insurance
- −$1,209
- − Repairs & maintenance
- −$2,065
- − Management
- −$2,065
- − Depreciation
- −$7,033
- Taxable loss
- −$3,723
- Est. tax savings @ 24.0%
- +$893
- After-tax cash flow
- $1,241/yr
For passive investors: Depreciation is non-cash, so a rental often shows a tax loss while cash-flowing — sheltering income. Rental losses are passive: they offset passive income freely, and up to $25,000/yr can offset ordinary (W-2) income if you actively participate and your MAGI is under $100k (phasing out to $0 by $150k); unused losses carry forward. On sale, claimed depreciation is recaptured at up to 25%, and gains may owe capital-gains tax (a 1031 exchange can defer both). Figures are a year-1 estimate at your 24.0% rate — not tax advice; consult a CPA.
Condition & rehab AI · 3 photos
The Horizon is a well-maintained, move-in-ready home with a good condition score. It offers a bright and inviting living space with minimal repairs needed.
Value-add opportunities
- Both Paint exterior — Enhances curb appeal and value
- Both Landscaping improvements — Enhances curb appeal and value
- Both Replace light fixtures — Modernizes and improves curb appeal
Renovation cost estimate screening
Value-add ROI direction
- Both Paint exterior — Enhances curb appeal and value ↑
- Both Landscaping improvements — Enhances curb appeal and value ↑
- Both Replace light fixtures — Modernizes and improves curb appeal ↑
ⓘ Cost ranges are severity-bucket heuristics (US national rule-of-thumb). Get contractor quotes + a written scope before underwriting a rehab budget.
Schools (NCES district)
- District
- St. Lucie
- NCES district ID
- 1201770
- Math proficiency
- 40% ▼ -11.00%
- Reading proficiency
- 48% ▼ -4.00%
- Median HH income
- $44,737
- Composite
- 37.28/100
- National rank
- #4449
- State rank
- #51 of 73 in FL
Livability — Lakewood Park
- Score
- 63/100
- State rank
- #719
- US rank
- #15407
Category grades
Schools grade is shown separately in the Schools card above.
Census & demographics
- Census place
- Lakewood Park, FL
- County
- Saint Lucie County · 337,150 people
- Metro
- Port St. Lucie, FL
- Population (ZIP)
- 17,148
- Household income
- $63,122
- Rent vs Own
- Severe rent burden
- 140.0
Population outlook (St. Lucie County) Hauer SSP2
- Today (2025)
- 338,016 people
- By 2030
- 355,687 · +5.2%
- By 2040
- 385,521 · +14.1%
- By 2050
- 406,106 · +20.1%
- By 2075
- 441,054 · +30.5%
- By 2100
- 436,885 · +29.2%
Race, ethnicity, and origin ACS 2023
- Neighborhood character
- Predominantly White (74%)
- Race & ethnicity
- White 74% Black 13% Hispanic / Latino 8% Two or more races 7% Asian 2%
- Hispanic origin (detail)
- Mexican 2% Puerto Rican 2% Cuban 2%
- Common ancestry
- Romanian 3% Italian 2% Lithuanian 2%
- Foreign-born
- 10% · Canada, Jamaica, Vietnam
- Languages at home
- 88% English-only · Spanish 7% French/Haitian/Cajun 3% Vietnamese 1%
Political lean MEDSL · St. Lucie
- 2024 margin
- Lean R (+9.1) · D 45.1% · R 54.2%
- 2008→2024 swing
- -21.2pp toward R · 2008: 12.1pp · 2024: -9.1pp
- All cycles
- 2024: R+9.1 2020: R+1.6 2016: R+2.5 2012: D+7.9 2008: D+12.1
Not yet ingested
- Civics
- —
Market trends
- HPI YoY
- ▼ -106.06%
- Current HPI
- 343.1376
- Rent YoY
- —
- Metro
- Port St. Lucie, FL
- State GDP YoY
- ▲ 3.28%
- F500 in state
- 36
Industry mix (Fortune 500 HQ in FL)
| Industry | F500 HQs | Revenue |
|---|---|---|
| Industrial Technology | 2 | $29B |
|
||
| Insurance | 2 | $17B |
|
||
| Retail | 1 | $60B |
|
||
| Technology Distribution | 1 | $58B |
|
||
| Homebuilding | 1 | $35B |
|
||
| Technology Manufacturing | 1 | $35B |
|
||
Cash-flow waterfall
monthlySold comps — $/sqft
last 12 mo · ≤1 miLoading sold comps…