59 Wildwood Ter · The Hideout, PA
Flood risk 1/10 · Minimal
- FEMA flood zone
- X (unshaded)
- Chance of flooding over 30 yrs
- 0.0%
- Est. flood insurance / yr
- $507 – $1,088
Fire risk 1/10 · Minimal
- Est. fire insurance / yr
- $511 – $949
Heat risk 2/10 · Minimal
- Hot days now (above 91°F)
- 7 days/yr
- Hot days in 30 yrs
- 16 days/yr
Wind risk 2/10 · Minimal
- Chance of severe wind over 30 yrs
- 3.0%
Air-quality risk 2/10 · Minimal
- Unhealthy air days now
- 1 days/yr
- Unhealthy air days in 30 yrs
- 2 days/yr
Risk factors via First Street. Map © Google.
Why this score? — see what drove the B- grade
The composite is a weighted blend of 9 inputs, each scored 0–100. Each bar is that input's sub-score; the figure is the points it added to the 100-point composite (weight × sub-score).
- Cash flow +21.9/30.0
- Appreciation +10.0/10.0
- ARV discount +7.6/15.0
- DSCR +7.0/10.0
- 1% rule +6.2/10.0
- Schools +4.4/10.0
- Livability +3.6/5.0
- Rent growth +2.5/5.0
- Condition / age +2.5/5.0
$259,500
🖨 Deal sheet 📄 Offer letter ✓ Due diligence
Listing remarks MLS
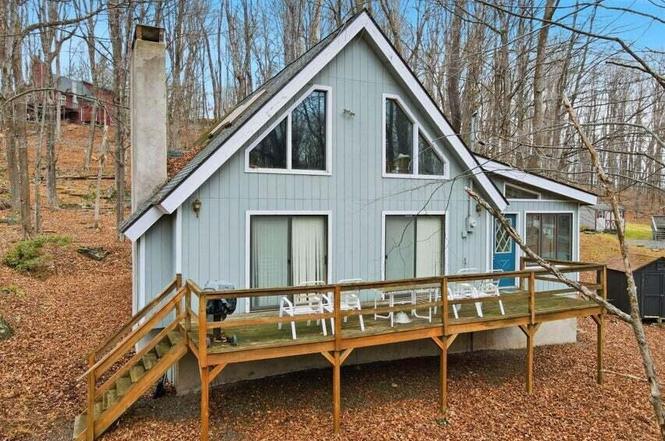
Chalet, Let the sunshine into this glass front chalet home. Featuring 2 finished levels with 3 Large bedrooms, 2 baths, loft. Offering so much potential, brick fireplace, large deck. Located within walking distance to the ski hill, art center, pool, beach, tennis & lodge.
Key facts
- Large deck
- Tennis
- Brick fireplace
Tags
Neighborhood map
What this means for you Summary
Snapshot
- This is a 3-bed/1.5-bath single-family listed at $260k.
Deal economics
- At list price, monthly cash flow is $409 ($5k/yr) — positive.
- The deal already cash-flows at list — no discount required.
- Meets the 1% rule at list price ($3k rent vs $260k).
- Recommended offer: $228k (12.0% below list) — sets the bar for market timing.
- Cap rate 8.2% vs local median 5.0% in The Hideout — top-decile yield for the area; either an underpriced asset or a hidden risk that comps aren't pricing in. Stress-test before assuming the spread holds.
Location & tenants
- Location reads 72/100 on livability (#668 in PA) — a middle-class / working-renter tenant base. Strengths: crime A+, employment A+, cost of living A+; Watch: schools D, amenities F, commute F.
- Western Wayne SD (rural): math 39% / reading 63% proficiency, ranked #165 of 539 in PA (top 31%) — acceptable for families but not a draw, mixed tenant base, ~2y average lease.
- Market conditions: 337 active listings in the ZIP; 1 comparable units currently listed for rent nearby; 177 units permitted in Wayne County in 2024 (0 in 5+ unit buildings).
Forward outlook
- In year one you build about $28k of equity ($2k loan paydown + $26k appreciation (10.0% local appreciation)).
- Wayne County population projected at -17% by 2050 — secular population decline; favor cash flow + early exit over multi-decade hold.
- At projected returns (10.0% appreciation + 3.0% rent growth), your $73k cash investment doubles in ~3 years — after that, you're playing with house money.
- By year 2, paydown + projected appreciation supports a ~$45k cash-out refi (75% LTV) — recoverable capital for the next deal without selling this one.
Negotiation context
- It's been on market 128 days — a 12% lower offer ($228k) is reasonable based on typical stale-listing flexibility.
- 2 sale attempts with the ask held roughly flat each time — persistent listings suggest the price (not the market) is what's stuck; bring a comps-based counter.
Questions for the listing agent
- It's been on market 128 days. Have you received any prior offers? Is the seller open to a 12% concession, seller financing, or rate buy-down credit?
- What does the HOA fee cover, when was the last increase, and are there any pending special assessments or reserve-fund shortfalls?
- Why hasn't it sold? Are there any deal-killer items the seller is aware of (foundation, flood, title, zoning, code violations)?
- Is there a deadline driving the sale (1031 exchange, divorce, estate, relocation)? That informs how much negotiation room exists.
- Schools are D-rated, which usually means shorter tenancies and higher turnover. Who's the typical renter profile here, and what's been the actual vacancy rate?
- What's the average days-on-market for RENTAL listings here right now (not sales)? A rising rental-DOM trend means longer vacancies and softer asking-rent achievability than the comps imply.
- What's the recent tenant-quality profile in this submarket — average credit score on applications, eviction rate, late-payment / NSF rate, and stable-employment percentage? A property-management company in the area should have these aggregated.
- How much new for-sale + rental construction is in the pipeline within 1–3 miles? Heavy new supply typically softens prices + rents 12–24 months out; constrained supply supports both.
Investment metrics
- 1% rule
- 1.12% ✓
- Cap rate
- 8.18%
- Cash-on-cash
- 6.75%
- DSCR
- 1.30
- GRM
- 7.5
CMA / ARV
- ARV (on-the-fly)
- $260,268
- Comps found
- 12
Show comp detail 12 sales within ~0.75 mi
| Address | Dist | Beds/Ba | Sqft | Sold | Price | $/sf | Match |
|---|---|---|---|---|---|---|---|
| 59 Wildwood Ter | 0.00mi | 3/2.0 | 1,587 (0%) | 1mo | $245,000 | $154 | 97 |
| 134 Deerfield Rd | 0.25mi | 4/2.0 (+1) | 1,536 (-3%) | 3mo | $292,000 | $190 | 74 |
| 16 Wildwood Ter | 0.19mi | 2/2.0 (-1) | 1,692 (+7%) | 4mo | $268,650 | $159 | 70 |
| 83 Oak Cir | 0.66mi | 3/1.5 | 1,570 (-1%) | 4mo | $258,000 | $164 | 64 |
| 894 Deerfield Rd | 0.40mi | 3/2.0 | 1,460 (-8%) | 3mo | $560,000 | $384 | 63 |
| 267 Lakeview Dr W | 0.27mi | 4/2.0 (+1) | 1,756 (+11%) | 2mo | $349,000 | $199 | 61 |
| 199 Lakeview Dr W | 0.46mi | 2/2.0 (-1) | 1,533 (-3%) | 6mo | $250,000 | $163 | 61 |
| 1379 Woodview Ter | 0.61mi | 3/2.0 | 1,483 (-7%) | 3mo | $164,500 | $111 | 56 |
| 139 Ridgeview Dr | 0.64mi | 2/1.0 (-1) | 1,526 (-4%) | 5mo | $185,000 | $121 | 53 |
| 470 Oakwood Ct | 0.74mi | 4/2.0 (+1) | 1,536 (-3%) | 8mo | $290,000 | $189 | 47 |
| 582 Lakeview Dr W | 0.64mi | 3/3.0 | 1,692 (+7%) | 9mo | $275,000 | $163 | 46 |
| 145 Lakeview Dr W | 0.67mi | 3/2.0 | 1,806 (+14%) | 4mo | $310,000 | $172 | 40 |
Match score weights: distance 35% · size 25% · config 20% · recency 20%. Top-matched comps best support the ARV.
Projected returns pro-forma
10.0% appreciation · 3.0% rent growth · sell at horizon
- IRR
- 29.2%
- Equity multiple
- 3.30×
- Total profit
- $167,462
- Equity at exit
- $233,778
- IRR
- 25.4%
- Equity multiple
- 7.51×
- Total profit
- $472,872
- Equity at exit
- $504,151
Cash invested: $72,660 (down + closing). Projections, not guarantees.
Landlord ↔ Tenant lean methodology
- Overall (STATE)
- 62 Landlord-Friendly
- State Pennsylvania
- 62 Landlord-Friendly · EVEN
- County
- — inherits STATE
- City
- — inherits STATE
ZIP-level market 18436
- Home prices YoY
- 16.9%
- Active inventory
- 337
- Price-to-rent
- 7.5×
Monthly cashflow live
- Estimated rent
- $2,900 medium interval (Pro) →
- Mortgage (P&I)
- −$1,361
- Tax from tax record
- −$219 /mo · $2,631/yr
- Insurance
- −$108
- HOA
- −$194
- Vacancy / Maint / Mgmt
- −$609
- Net cashflow
- $409
Break-even live
UW: 25.0% down · 7.5% · 30yr · 1.5% tax · 5.0% vac · 8.0% maint · 8.0% mgmt
Financing live
Cash to close
- Down payment
- $64,875
- Closing costs
- $7,785
- Reserves months
- —
- Total cash needed
- —
Loan-product check · same deal, 3 products live
Conventional
25% down · 7.5% · 30yr
- Down + closing
- —
- Monthly P&I
- —
- Monthly cashflow
- —
- DSCR
- —
- Eligible?
- —
Personal DTI + credit; lowest rate.
DSCR
20% down · 8.5% · 30yr
- Down + closing
- —
- Monthly P&I
- —
- Monthly cashflow
- —
- DSCR
- —
- Eligible?
- —
No personal income docs; deal must DSCR.
Hard money
10% down · 12.0% · 12mo
- Down + closing
- —
- Monthly P&I
- —
- Monthly cashflow
- —
- DSCR
- —
- Eligible?
- —
Short-term bridge; refi at stabilization.
Rent comps 1 comps
| Address | Beds | Baths | Sqft | Rent | $/sqft | DOM | Units | Dist |
|---|---|---|---|---|---|---|---|---|
| 1148 Golf Park Dr Lake Ariel, PA | 3.0 | 1.0 | 1210 | $2,900 | $2.40 | 24d | 1 | 0.78mi |
HOA detail
- Monthly dues
- $194 · $2,328/yr
- Likely covers
- pool
Listing history 6 events
-
2026-04-06status Pending 278-char remark
Show marketing remark (278 chars)
Chalet, Let the sunshine into this glass front chalet home. Featuring 2 finished levels with 3 Large bedrooms, 2 baths, loft. Offering so much potential, brick fireplace, large deck. Located within walking distance to the ski hill, art center, pool, beach, tennis & lodge.
-
2026-04-06status Pending
Show marketing remark (278 chars)
Chalet, Let the sunshine into this glass front chalet home. Featuring 2 finished levels with 3 Large bedrooms, 2 baths, loft. Offering so much potential, brick fireplace, large deck. Located within walking distance to the ski hill, art center, pool, beach, tennis & lodge.
-
2026-02-05price $259,500 278-char remark
Show marketing remark (278 chars)
Chalet, Let the sunshine into this glass front chalet home. Featuring 2 finished levels with 3 Large bedrooms, 2 baths, loft. Offering so much potential, brick fireplace, large deck. Located within walking distance to the ski hill, art center, pool, beach, tennis & lodge.
-
2026-02-05price $259,500
Show marketing remark (278 chars)
Chalet, Let the sunshine into this glass front chalet home. Featuring 2 finished levels with 3 Large bedrooms, 2 baths, loft. Offering so much potential, brick fireplace, large deck. Located within walking distance to the ski hill, art center, pool, beach, tennis & lodge.
-
2025-11-27$259,900 Active
-
2025-11-22$259,900 Active 278-char remark
Show marketing remark (278 chars)
Chalet, Let the sunshine into this glass front chalet home. Featuring 2 finished levels with 3 Large bedrooms, 2 baths, loft. Offering so much potential, brick fireplace, large deck. Located within walking distance to the ski hill, art center, pool, beach, tennis & lodge.
ⓘ Source: listings_history table (triggers on properties + properties_extension) + one-shot
backfill from property_details.listing_events for pre-trigger history.
Tax reassessment forecast PA · Partial reset (capped growth)
- Current annual tax
- $2,631 · $219/mo
- Projected year-2 tax
- $3,366 · $280/mo
- Expected delta
- +$734/yr (+$61/mo · 27.9%)
ⓘ Screening estimate from a state-policy table — verify with the county assessor before closing.
Climate risk First Street
- Flood 1/10 Low FEMA zone X (unshaded) · 0% chance over 30 yrs
- Wildfire 1/10 Low
- Heat 2/10 Low 7 d/yr ≥91°F today · 16 d/yr by 30 yrs out
- Wind 2/10 Low 3% chance of damaging wind over 30 yrs
- Air quality 2/10 Low 1 unhealthy d/yr today · 2 by 30 yrs out
Nearby sold comps map
Loading sold comps map…
Walkable amenities ~0.75 mi
Loading nearby amenities…
Taxation est. · year 1
- Rental income
- $34,800
- − Mortgage interest
- −$14,536
- − Property taxes
- −$2,631
- − Insurance
- −$1,298
- − Repairs & maintenance
- −$2,784
- − Management
- −$2,784
- − HOA
- −$2,328
- − Depreciation
- −$7,549
- Taxable income
- $890
- Est. tax owed @ 24.0%
- −$214
- After-tax cash flow
- $4,691/yr
For passive investors: Depreciation is non-cash, so a rental often shows a tax loss while cash-flowing — sheltering income. Rental losses are passive: they offset passive income freely, and up to $25,000/yr can offset ordinary (W-2) income if you actively participate and your MAGI is under $100k (phasing out to $0 by $150k); unused losses carry forward. On sale, claimed depreciation is recaptured at up to 25%, and gains may owe capital-gains tax (a 1031 exchange can defer both). Figures are a year-1 estimate at your 24.0% rate — not tax advice; consult a CPA.
Schools (NCES district)
- District
- Western Wayne SD
- NCES district ID
- 4226070
- Math proficiency
- 39% ▼ -12.00%
- Reading proficiency
- 63% ▼ -6.00%
- Median HH income
- $51,358
- Composite
- 43.65/100
- National rank
- #2964
- State rank
- #165 of 539 in PA
Livability — The Hideout
- Score
- 72/100
- State rank
- #668
- US rank
- #6516
Category grades
Schools grade is shown separately in the Schools card above.
Census & demographics
- Census place
- The Hideout, PA
- Population (ZIP)
- 13,225
Population outlook (Wayne County) Hauer SSP2
- Today (2025)
- 47,924 people
- By 2030
- 46,191 · -3.6%
- By 2040
- 42,815 · -10.7%
- By 2050
- 39,873 · -16.8%
- By 2075
- 34,556 · -27.9%
- By 2100
- 28,358 · -40.8%
Race, ethnicity, and origin ACS 2023
- Neighborhood character
- Predominantly White (95%)
- Race & ethnicity
- White 95% Two or more races 3% Hispanic / Latino 2%
- Common ancestry
- Romanian 9% Scotch-Irish 2% Iranian 2%
- Foreign-born
- 4%
- Languages at home
- 95% English-only · French/Haitian/Cajun 2% Russian/Polish/Slavic 1% Spanish 1%
Political lean MEDSL · Wayne
- 2024 margin
- Solid R (+37.1) · D 31.1% · R 68.2%
- 2008→2024 swing
- -24.8pp toward R · 2008: -12.3pp · 2024: -37.1pp
- All cycles
- 2024: R+37.1 2020: R+33.6 2016: R+39.7 2012: R+20.9 2008: R+12.3
Not yet ingested
- Civics
- —
Market trends
- HPI YoY
- ▲ 47.95%
- Current HPI
- 331.9645
- Rent YoY
- —
- Metro
- —
- State GDP YoY
- ▲ 1.68%
- F500 in state
- 34
Industry mix (Fortune 500 HQ in PA)
| Industry | F500 HQs | Revenue |
|---|---|---|
| Healthcare | 2 | $309B |
|
||
| Insurance | 2 | $27B |
|
||
| Telecommunications / Media | 1 | $124B |
|
||
| Industrial Distribution | 1 | $22B |
|
||
| Financial Services | 1 | $20B |
|
||
| Chemicals / Materials | 1 | $18B |
|
||
Price history
-0.2% since first listed6 events — show timeline
- 2026-04-06 Pending — PWMLS
- 2026-04-06 Pending — GSBR as distributed by MLS GRID
- 2026-02-05 Price Changed $259,500 PWMLS
- 2026-02-05 Price Changed $259,500 GSBR as distributed by MLS GRID
- 2025-11-27 Listed $259,900 GSBR as distributed by MLS GRID
- 2025-11-22 Listed $259,900 PWMLS
Property tax history
+2.5%/yrLatest (2026): $2,631 · +3.0% YoY. Source: county tax records.
Cash-flow waterfall
monthlySold comps — $/sqft
last 12 mo · ≤1 miLoading sold comps…