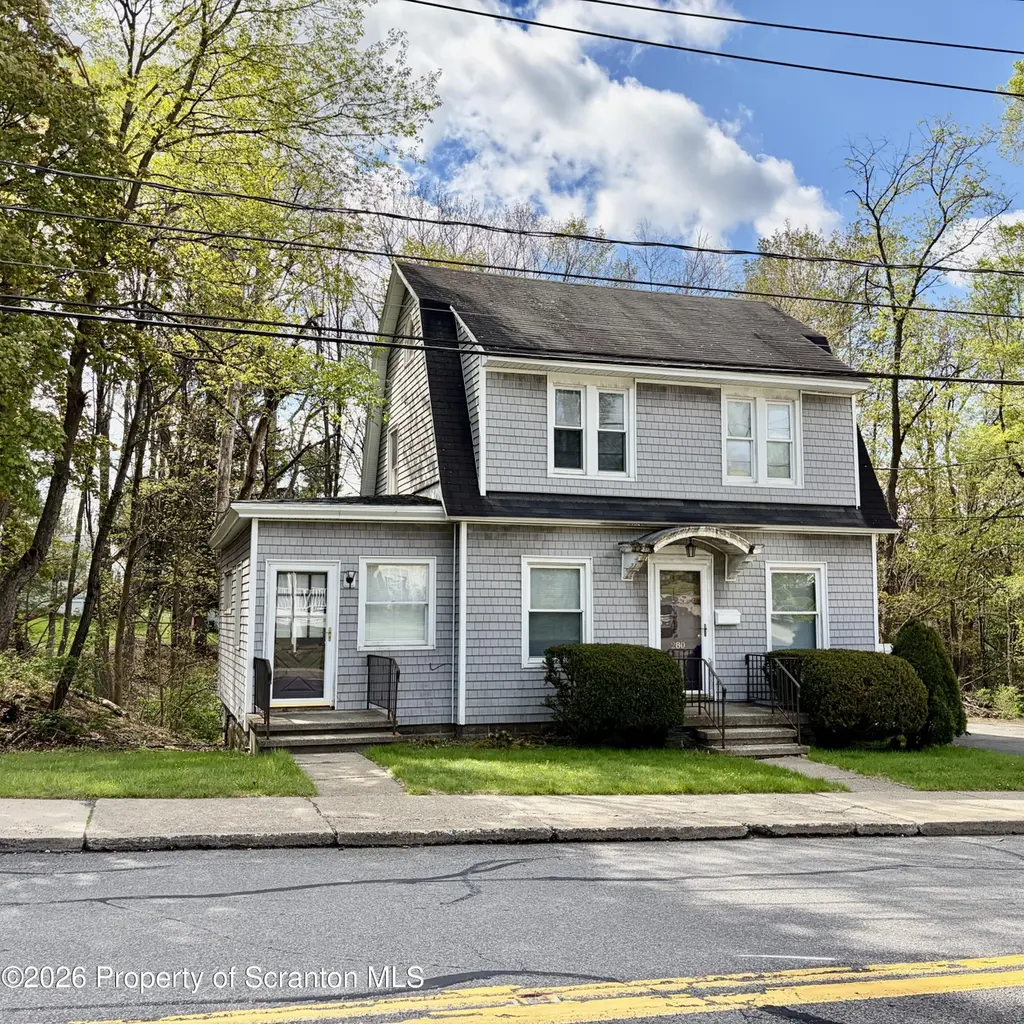
280 E Grove St · Clarks Green, PA
Flood risk 6/10 · Moderate
- FEMA flood zone
- X (unshaded)
- Chance of flooding over 30 yrs
- 0.68%
- Est. flood insurance / yr
- $473 – $860
Fire risk 1/10 · Minimal
- Est. fire insurance / yr
- $511 – $949
Heat risk 3/10 · Minor
- Hot days now (above 92°F)
- 7 days/yr
- Hot days in 30 yrs
- 17 days/yr
Wind risk 2/10 · Minimal
- Chance of severe wind over 30 yrs
- 4.0%
Air-quality risk 2/10 · Minimal
- Unhealthy air days now
- 0 days/yr
- Unhealthy air days in 30 yrs
- 1 days/yr
Risk factors via First Street. Map © Google.
Why this score? — see what drove the C grade
The composite is a weighted blend of 9 inputs, each scored 0–100. Each bar is that input's sub-score; the figure is the points it added to the 100-point composite (weight × sub-score).
- Cash flow +17.0/30.0
- ARV discount +15.0/15.0
- Schools +5.4/10.0
- DSCR +5.3/10.0
- 1% rule +4.6/10.0
- Livability +3.8/5.0
- Rent growth +2.5/5.0
- Condition / age +2.5/5.0
- Appreciation +0.0/10.0
$199,000
🖨 Deal sheet 📄 Offer letter ✓ Due diligence
Listing remarks
Unique opportunity that is not often found in this location - a property that offers multiple uses for the right buyer! Bring your ideas and your sweat equity and make this property shine! This property has been a single-family home, a multi-family property, and a commercial space. The bones of the home are great! Space for a kitchen, living room, and dining room on the main floor, a bonus area with a separate entrance and half bathroom are all on the primary level. Upstairs you have a great full bathroom, and 3 bedrooms with plenty of storage in each one. The basement has great ceiling height which opens up the option to create additional usable space! Most recently used as a single family
Key facts
- Separate entrance
- Living room
- Dining room
Tags
Property features AI
Finance
- Other: Lot not in development; Public maintained paved city street frontage; Lot dimensions approximate (listed as 86X15X88X90X92)
Exterior
- Parking: Off-street parking on asphalt
- Utilities: Public water; Public sewer; Electric service 200 amps or less; Electricity available; Water connected
- Home design: Single-family residence; Residential property; Shingle roof
- Construction: Wood siding exterior; Block foundation; Built around 1930 (year built estimated)
- Exterior features: Side porch; Other exterior features
Interior
- Kitchen: Kitchen (12 x 9) — no appliances included
- Bedrooms: 3 bedrooms (one bedroom ~13 x 14, one ~10 x 9, one listed as Bedroom 3)
- Flooring: Wood flooring; Linoleum flooring
- Bathrooms: 2 bathrooms total — 1 full bathroom with tub, 1 half bath
- Heating & cooling: No heating; No cooling
- Interior features: Track lighting; Blank canvas kitchen (room described as blank canvas); Large open living space; Double-door entrance to dining room; Office/bonus space with separate entry; Walk-out basement access
- Laundry & utility: No appliances listed
Neighborhood map
What this means for you Summary
Snapshot
- This is a 3-bed/1.5-bath single-family listed at $199k.
Deal economics
- At list price, monthly cash flow is $136 ($2k/yr) — positive.
- The deal already cash-flows at list — no discount required.
- To meet the 1% rule (rent ≥ 1% of price), the offer needs to be $191k (3.9% below list).
- Recommended offer: $191k (3.9% below list) — sets the bar for 1% rule.
Location & tenants
- Location reads 76/100 on livability (#404 in PA, #3,668 nationally) — a middle-class / working-renter tenant base. Strengths: schools A+, crime A+, employment A+; Watch: amenities F, commute F, health & safety F.
- Abington Heights SD (rural): math 50% / reading 73% proficiency, ranked #56 of 539 in PA (top 10%) — acceptable for families but not a draw, mixed tenant base, ~2y average lease; only 13% free/reduced lunch — higher-income household profile.
- Market conditions: 126 active listings in the ZIP; 4 comparable units currently listed for rent nearby; rentals lingering (median 44d on market — plan ~5-8 weeks vacancy on turnover, expect pricing pressure); 50% of comp listings sitting > 30 days — soft ceiling on asking rent; solid renter incomes; 251 units permitted in Lackawanna County in 2024 (0 in 5+ unit buildings).
Forward outlook
- Local home prices are declining (-3.0%/yr); year-one equity from $1k of loan paydown is wiped out by about $6k of value loss. Plan a longer hold.
- Lackawanna County population projected to shrink 4% by 2050 — rents likely to lag national; underwrite the cash flow, not the appreciation.
Negotiation context
- It's been on market 36 days — a 3% lower offer ($193k) is reasonable based on typical stale-listing flexibility.
Risks & watch-outs
- Watch-outs: built in 1930 — expect roof / HVAC / electrical / plumbing capex.
- Climate carrying-cost: major flood risk — expect insurance premiums to compound above CPI over the hold.
Questions for the listing agent
- It's been on market 36 days. Have you received any prior offers? Is the seller open to a 4% concession, seller financing, or rate buy-down credit?
- Built in 1930 — when were the roof, HVAC, electrical panel, plumbing, and water heater last replaced?
- Is there a deadline driving the sale (1031 exchange, divorce, estate, relocation)? That informs how much negotiation room exists.
- Schools are A-rated — typically a magnet for longer-tenancy family renters. What's the average tenant stay here, and is there a school-zone premium baked into asking?
- What's the average days-on-market for RENTAL listings here right now (not sales)? A rising rental-DOM trend means longer vacancies and softer asking-rent achievability than the comps imply.
- What's the recent tenant-quality profile in this submarket — average credit score on applications, eviction rate, late-payment / NSF rate, and stable-employment percentage? A property-management company in the area should have these aggregated.
- How much new for-sale + rental construction is in the pipeline within 1–3 miles? Heavy new supply typically softens prices + rents 12–24 months out; constrained supply supports both.
Investment metrics
- 1% rule
- 0.96% ✗
- Cap rate
- 7.11%
- Cash-on-cash
- 2.92%
- DSCR
- 1.13
- GRM
- 8.7
CMA / ARV
- ARV (median comp)
- $304,739
- List price
- $199,000
- Delta
- -34.70%
- Verdict
- UNDERPRICED
- Comps
- 20 within 1.0 mi
Show comp detail 12 sales within ~0.75 mi
| Address | Dist | Beds/Ba | Sqft | Sold | Price | $/sf | Match |
|---|---|---|---|---|---|---|---|
| 113 Fairview Ave | 0.49mi | 3/2.0 | 1,700 (0%) | 4mo | $283,500 | $167 | 72 |
| 216 N Abington Rd | 0.28mi | 3/2.5 | 1,608 (-5%) | 3mo | $250,000 | $155 | 72 |
| 802 Poplar St | 0.41mi | 3/2.0 | 1,764 (+4%) | 2mo | $322,000 | $183 | 71 |
| 210 Hall Ave | 0.18mi | 4/1.0 (+1) | 1,624 (-4%) | 8mo | $285,000 | $175 | 70 |
| 302 Thurston St | 0.49mi | 3/1.5 | 1,700 (0%) | 12mo | $230,000 | $135 | 67 |
| 15 Hall Ave | 0.06mi | 4/2.5 (+1) | 1,860 (+9%) | 11mo | $320,000 | $172 | 64 |
| 201 Ridge St | 0.51mi | 4/2.0 (+1) | 1,688 (-1%) | 11mo | $340,000 | $201 | 59 |
| 205 Bissell St | 0.55mi | 3/1.5 | 1,850 (+9%) | 3mo | $300,000 | $162 | 57 |
| 213 Colburn Ave | 0.36mi | 3/2.0 | 1,916 (+13%) | 10mo | $265,000 | $138 | 52 |
| 336 Grand Ave | 0.69mi | 3/2.0 | 1,539 (-10%) | 1mo | $240,000 | $156 | 49 |
| 100 Carteret Dr Unit L 7 | 0.73mi | 3/2.0 | 1,862 (+10%) | 2mo | $255,100 | $137 | 46 |
| 909 Walnut St | 0.52mi | 4/1.5 (+1) | 1,881 (+11%) | 14mo | $359,200 | $191 | 41 |
Match score weights: distance 35% · size 25% · config 20% · recency 20%. Top-matched comps best support the ARV.
Projected returns pro-forma
-3.0% appreciation · 3.0% rent growth · sell at horizon
- IRR
- -11.7%
- Equity multiple
- 0.58×
- Total profit
- $-23,579
- Equity at exit
- $29,672
- IRR
- -2.5%
- Equity multiple
- 0.83×
- Total profit
- $-9,291
- Equity at exit
- $17,206
Cash invested: $55,720 (down + closing). Projections, not guarantees.
Landlord ↔ Tenant lean methodology
- Overall (STATE)
- 62 Landlord-Friendly
- State Pennsylvania
- 62 Landlord-Friendly · EVEN
- County
- — inherits STATE
- City
- — inherits STATE
ZIP-level market 18411
- Active inventory
- 126
- Price-to-rent
- 8.7×
Monthly cashflow live
- Estimated rent
- $1,913 medium interval (Pro) →
- Mortgage (P&I)
- −$1,044
- Tax est. 1.5%
- −$249 /mo · $2,985/yr
- Insurance
- −$83
- HOA
- −$0
- Vacancy / Maint / Mgmt
- −$402
- Net cashflow
- $136
Break-even live
UW: 25.0% down · 7.5% · 30yr · 1.5% tax · 5.0% vac · 8.0% maint · 8.0% mgmt
Financing live
Cash to close
- Down payment
- $49,750
- Closing costs
- $5,970
- Reserves months
- —
- Total cash needed
- —
Loan-product check · same deal, 3 products live
Conventional
25% down · 7.5% · 30yr
- Down + closing
- —
- Monthly P&I
- —
- Monthly cashflow
- —
- DSCR
- —
- Eligible?
- —
Personal DTI + credit; lowest rate.
DSCR
20% down · 8.5% · 30yr
- Down + closing
- —
- Monthly P&I
- —
- Monthly cashflow
- —
- DSCR
- —
- Eligible?
- —
No personal income docs; deal must DSCR.
Hard money
10% down · 12.0% · 12mo
- Down + closing
- —
- Monthly P&I
- —
- Monthly cashflow
- —
- DSCR
- —
- Eligible?
- —
Short-term bridge; refi at stabilization.
Rent comps 4 comps
| Address | Beds | Baths | Sqft | Rent | $/sqft | DOM | Units | Dist |
|---|---|---|---|---|---|---|---|---|
| 519 School St Clarks Summit, PA | 3.0 | 1.5 | 1500 | $1,900 | $1.27 | 13d | 1 | 0.27mi |
| 213 Colburn Ave Clarks Summit, PA | 3.0 | 2.0 | 1500 | $1,950 | $1.30 | 43d | 1 | 0.35mi |
| 517 Highland Ave Clarks Summit, PA | 2.0 | 1.0 | 1123 | $1,350 | $1.20 | 21d | 1 | 0.36mi |
| 312 Nichols St Clarks Summit, PA | 2.0 | 1.5 | 1408 | $1,450 | $1.03 | 43d | 1 | 0.67mi |
Listing history 12 events
-
2026-06-10status $199,000 Pending 36 DOM
-
2026-06-09days on market $199,000 Active 36 DOM
-
2026-06-08days on market $199,000 Active 35 DOM
-
2026-06-07days on market $199,000 Active 34 DOM
-
2026-06-03days on market $199,000 Active 30 DOM
-
2026-06-02days on market $199,000 Active 29 DOM
-
2026-06-01days on market $199,000 Active 28 DOM
-
2026-05-31days on market $199,000 Active 27 DOM
-
2026-05-30days on market $199,000 Active 26 DOM
-
2026-05-04$199,000 Active 917-char remark
-
2008-03-31soldstatus $185,000
-
2006-09-29soldstatus $150,000
ⓘ Source: listings_history table (triggers on properties + properties_extension) + one-shot
backfill from property_details.listing_events for pre-trigger history.
Climate risk First Street
- Flood 6/10 Major FEMA zone X (unshaded) · 68% chance over 30 yrs
- Wildfire 1/10 Low
- Heat 3/10 Moderate 7 d/yr ≥92°F today · 17 d/yr by 30 yrs out
- Wind 2/10 Low 4% chance of damaging wind over 30 yrs
- Air quality 2/10 Low 0 unhealthy d/yr today · 1 by 30 yrs out
Nearby sold comps map
Loading sold comps map…
Walkable amenities ~0.75 mi
Loading nearby amenities…
Taxation est. · year 1
- Rental income
- $22,950
- − Mortgage interest
- −$11,147
- − Property taxes
- −$2,985
- − Insurance
- −$995
- − Repairs & maintenance
- −$1,836
- − Management
- −$1,836
- − Depreciation
- −$5,789
- Taxable loss
- −$1,638
- Est. tax savings @ 24.0%
- +$393
- After-tax cash flow
- $2,021/yr
For passive investors: Depreciation is non-cash, so a rental often shows a tax loss while cash-flowing — sheltering income. Rental losses are passive: they offset passive income freely, and up to $25,000/yr can offset ordinary (W-2) income if you actively participate and your MAGI is under $100k (phasing out to $0 by $150k); unused losses carry forward. On sale, claimed depreciation is recaptured at up to 25%, and gains may owe capital-gains tax (a 1031 exchange can defer both). Figures are a year-1 estimate at your 24.0% rate — not tax advice; consult a CPA.
Schools (NCES district)
- District
- Abington Heights SD
- NCES district ID
- 4202010
- Math proficiency
- 50% ▼ -11.00%
- Reading proficiency
- 73% ▼ -6.00%
- Median HH income
- $72,490
- Composite
- 54.38/100
- National rank
- #1358
- State rank
- #56 of 539 in PA
Livability — Clarks Green
- Score
- 76/100
- State rank
- #404
- US rank
- #3668
Category grades
Schools grade is shown separately in the Schools card above.
Census & demographics
- Census place
- Clarks Green, PA
- County
- Lackawanna County · 134,448 people
- Metro
- Scranton--Wilkes-Barre, PA
- Population (ZIP)
- 22,820
- Household income
- $98,824
- Rent vs Own
- Severe rent burden
- 409.0
Population outlook (Lackawanna County) Hauer SSP2
- Today (2025)
- 210,652 people
- By 2030
- 208,623 · -1.0%
- By 2040
- 203,980 · -3.2%
- By 2050
- 201,069 · -4.5%
- By 2075
- 205,026 · -2.7%
- By 2100
- 210,851 · +0.1%
Race, ethnicity, and origin ACS 2023
- Neighborhood character
- Predominantly White (88%)
- Race & ethnicity
- White 88% Asian 4% Two or more races 4% Hispanic / Latino 3%
- Common ancestry
- Romanian 11% Scotch-Irish 3% Lithuanian 2%
- Foreign-born
- 7% · Canada, South Korea
- Languages at home
- 92% English-only · Other Indo-European 3% Other Asian/Pacific 1% Spanish 1%
Political lean MEDSL · Lackawanna
- 2024 margin
- Toss-up / Even · D 51.0% · R 48.3%
- 2008→2024 swing
- -23.2pp toward R · 2008: 26.0pp · 2024: 2.8pp
- All cycles
- 2024: D+2.8 2020: D+8.4 2016: D+3.4 2012: D+27.4 2008: D+26.0
Not yet ingested
- Civics
- —
Market trends
- HPI YoY
- ▼ -117.03%
- Current HPI
- 189.2345
- Rent YoY
- —
- Metro
- Scranton--Wilkes-Barre, PA
- State GDP YoY
- ▲ 1.68%
- F500 in state
- 34
Industry mix (Fortune 500 HQ in PA)
| Industry | F500 HQs | Revenue |
|---|---|---|
| Healthcare | 2 | $309B |
|
||
| Insurance | 2 | $27B |
|
||
| Telecommunications / Media | 1 | $124B |
|
||
| Industrial Distribution | 1 | $22B |
|
||
| Financial Services | 1 | $20B |
|
||
| Chemicals / Materials | 1 | $18B |
|
||
Price history
+32.7% since first listed4 events — show timeline
- 2026-06-09 Pending — GSBR as distributed by MLS GRID
- 2026-05-04 Listed $199,000 GSBR as distributed by MLS GRID
- 2008-03-31 Sold (Public Records) $185,000 Public Records
- 2006-09-29 Sold (Public Records) $150,000 Public Records
Property tax history
+32.5%/yrLatest (2026): $48,367 · +1776.6% YoY. Source: county tax records.
Cash-flow waterfall
monthlySold comps — $/sqft
last 12 mo · ≤1 miLoading sold comps…