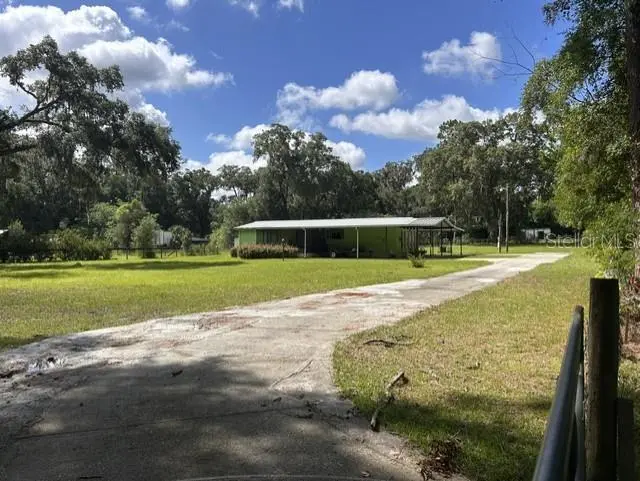
8545 S Magnolia Ave · Ocala, FL
Flood risk 1/10 · Minimal
- FEMA flood zone
- X (unshaded)
- Chance of flooding over 30 yrs
- 0.0%
- Est. flood insurance / yr
- $507 – $1,088
Fire risk 6/10 · Moderate
- Est. fire insurance / yr
- $947 – $1,759
Heat risk 8/10 · Major
- Hot days now (above 108°F)
- 7 days/yr
- Hot days in 30 yrs
- 20 days/yr
Wind risk 9/10 · Severe
- Chance of severe wind over 30 yrs
- 99.0%
Air-quality risk 3/10 · Minor
- Unhealthy air days now
- 3 days/yr
- Unhealthy air days in 30 yrs
- 4 days/yr
Risk factors via First Street. Map © Google.
Why this score? — see what drove the F grade
The composite is a weighted blend of 9 inputs, each scored 0–100. Each bar is that input's sub-score; the figure is the points it added to the 100-point composite (weight × sub-score).
- Cash flow +9.4/30.0
- ARV discount +7.5/15.0
- Schools +3.6/10.0
- Livability +3.5/5.0
- DSCR +2.6/10.0
- Condition / age +2.5/5.0
- 1% rule +2.1/10.0
- Rent growth +1.9/5.0
- Appreciation +0.0/10.0
$239,000
🖨 Deal sheet 📄 Offer letter ✓ Due diligence
Listing remarks MLS
2 bedroom / 2 bathroom, 1300 sqft mobile home on an acre of land. Close to Santos, Green way, Florida Horse Park, or town. Home has paved private driveway and perimeter fenced just off desirable Magnolia Ave / 475. This is well maintained older mobile home with new floors and fresh paint. Home has wrap around carport with screened porch, plus also features detached enclosed addition with window unit A/C (could be office space or guest bedroom). Newer A/C. Washer and dryer included as well as fridge and dishwasher. Property is adjacent to a church, walking distance to convenience store and near Redeemer Christian school.
Key facts
- New dishwasher
- New backsplash
- New roof
Tags
Property features AI
Finance
- Other: Furnished; Zoning: A1
- Financial info: No lease restrictions indicated
- HOA & community: No HOA/association indicated
Exterior
- Parking: Carport with 2 spaces
- Utilities: Well water; Septic tank; Cable available; Electricity connected; Sewer connected; Water connected
- Home design: Manufactured double-wide home; Single-story; Faces north
- Construction: Vinyl siding; Metal roof; Pillar/post/pier foundation; Built area about 1,301 (public records)
- Exterior features: Concrete road access; Approximately 1.19-acre lot
Interior
- Kitchen: Dishwasher; Range; Refrigerator
- Bedrooms: 2 bedrooms
- Flooring: Laminate
- Bathrooms: 3 full bathrooms
- Heating & cooling: Electric heating; Central air conditioning
- Interior features: Ceiling fans
- Laundry & utility: Washer hookup; Electric dryer hookup; Dryer; Washer
Neighborhood map
What this means for you Summary
Snapshot
- This is a 2-bed/2.0-bath manufactured listed at $239k.
Deal economics
- At list price, monthly cash flow is $-171 ($-2k/yr) — negative.
- To cash-flow at today's rent, offer at most $209k (12.6% below list).
- To meet the 1% rule (rent ≥ 1% of price), the offer needs to be $171k (28.6% below list).
- Recommended offer: $171k (28.6% below list) — sets the bar for 1% rule.
- Cap rate 5.4% vs local median 4.2% in Ocala — meaningfully above typical; check what's discounted (condition, days-on-market, listing class) to confirm the premium yield is real.
Location & tenants
- Location reads 69/100 on livability (#476 in FL) — a middle-class / working-renter tenant base. Strengths: cost of living A+, housing A+, health & safety A+; Watch: crime F, amenities F, commute F.
- Marion (rural): math 42% / reading 43% proficiency, ranked #61 of 73 in FL (top 84%) — families likely to look elsewhere, expect single-tenant / working-renter base with shorter leases; 61% free/reduced lunch — lower-income household profile, screen leases tightly.
- Zoned schools: Shady Hill Elementary School (math 69% / reading 53%, grade B, #653 of 2,144 statewide, top 31%, 643 students, 56% FRL); Belleview High School (math 31% / reading 46%, grade F, #321 of 667 statewide, top 49%, 1,783 students, 56% FRL) — zoned schools at 56% FRL track the district average.
- Market conditions: Rents soft (-2.6%/yr); 852 active listings in the ZIP; 7,071 units permitted in Marion County in 2024 (534 in 5+ unit buildings).
- This rent runs 31% of the median local income ($66k/yr) — at the standard rent-burdened threshold; future hikes will face affordability resistance.
Forward outlook
- Local home prices are declining (-3.0%/yr); year-one equity from $2k of loan paydown is wiped out by about $7k of value loss. Plan a longer hold.
- Marion County population projected at +13% by 2050 — modest demand growth; plan on rents tracking national, not racing it.
Negotiation context
- Only 5 days on market — expect competitive offers; lowballing is unlikely to land.
- 5 sale attempts since 12y ago with the ask held roughly flat each time — persistent listings suggest the price (not the market) is what's stuck; bring a comps-based counter.
- Current owner paid $170k; 41% above their basis — modest negotiation headroom, anchor on the comps not their cost.
Risks & watch-outs
- Climate carrying-cost: severe wind risk, 99% chance of damaging wind over 30y; major wildfire risk; extreme-heat days projected 7→20/yr by 2055 (HVAC capex compounding) — expect insurance premiums to compound above CPI over the hold.
Questions for the listing agent
- What do current leases actually rent for vs. the listed asking? Can we see a recent rent roll and the last 12 months of T-12 income?
- Is there a deadline driving the sale (1031 exchange, divorce, estate, relocation)? That informs how much negotiation room exists.
- Crime grade is F in this area — have there been break-ins, vandalism, or insurance claims at this property in the last 3 years? What carrier currently insures it and at what premium?
- The area grade is low — what's the realistic commute time and amenity access for the typical tenant pool here? Any planned neighborhood developments (good or bad) we should know about?
- What's the average days-on-market for RENTAL listings here right now (not sales)? A rising rental-DOM trend means longer vacancies and softer asking-rent achievability than the comps imply.
- What's the recent tenant-quality profile in this submarket — average credit score on applications, eviction rate, late-payment / NSF rate, and stable-employment percentage? A property-management company in the area should have these aggregated.
- How much new for-sale + rental construction is in the pipeline within 1–3 miles? Heavy new supply typically softens prices + rents 12–24 months out; constrained supply supports both.
Investment metrics
- 1% rule
- 0.71% ✗
- Cap rate
- 5.43%
- Cash-on-cash
- -3.06%
- DSCR
- 0.86
- GRM
- 11.7
CMA / ARV
No comps found within radius.
Projected returns pro-forma
-3.0% appreciation · 0.0% rent growth · sell at horizon
- IRR
- -24.5%
- Equity multiple
- 0.18×
- Total profit
- $-54,669
- Equity at exit
- $35,636
- IRR
- -30.8%
- Equity multiple
- -0.21×
- Total profit
- $-81,172
- Equity at exit
- $20,664
Cash invested: $66,920 (down + closing). Projections, not guarantees.
Landlord ↔ Tenant lean methodology
- Overall (STATE)
- 87 Strongly Landlord-Friendly
- State Florida
- 87 Strongly Landlord-Friendly · R+3
- County
- — inherits STATE
- City
- — inherits STATE
ZIP-level market 34476
- Rents YoY
- -2.6%
- Active inventory
- 852
- Price-to-rent
- 11.7×
Monthly cashflow live
- Estimated rent
- $1,706 medium interval (Pro) →
- Mortgage (P&I)
- −$1,253
- Tax from tax record
- −$166 /mo · $1,993/yr
- Insurance
- −$100
- HOA
- −$0
- Vacancy / Maint / Mgmt
- −$358
- Net cashflow
- $-171
Break-even live
UW: 25.0% down · 7.5% · 30yr · 1.5% tax · 5.0% vac · 8.0% maint · 8.0% mgmt
Financing live
Cash to close
- Down payment
- $59,750
- Closing costs
- $7,170
- Reserves months
- —
- Total cash needed
- —
Loan-product check · same deal, 3 products live
Conventional
25% down · 7.5% · 30yr
- Down + closing
- —
- Monthly P&I
- —
- Monthly cashflow
- —
- DSCR
- —
- Eligible?
- —
Personal DTI + credit; lowest rate.
DSCR
20% down · 8.5% · 30yr
- Down + closing
- —
- Monthly P&I
- —
- Monthly cashflow
- —
- DSCR
- —
- Eligible?
- —
No personal income docs; deal must DSCR.
Hard money
10% down · 12.0% · 12mo
- Down + closing
- —
- Monthly P&I
- —
- Monthly cashflow
- —
- DSCR
- —
- Eligible?
- —
Short-term bridge; refi at stabilization.
Listing history 6 events
-
2026-06-18days on market $239,000 Active 5 DOM
-
2026-06-17days on market $239,000 Active 4 DOM
-
2026-06-16days on market $239,000 Active 3 DOM
-
2026-06-15days on market $239,000 Active 2 DOM
-
2026-06-14remarks 699-char remark
-
2026-06-14$239,000 Active 1 DOM
ⓘ Source: listings_history table (triggers on properties + properties_extension) + one-shot
backfill from property_details.listing_events for pre-trigger history.
Tax reassessment forecast FL · Resets to sale price
- Current annual tax
- $1,993 · $166/mo
- Projected year-2 tax
- $1,993 · $166/mo
- Expected delta
- $0/yr ($0/mo · 0.0%)
ⓘ Screening estimate from a state-policy table — verify with the county assessor before closing.
Climate risk First Street
- Flood 1/10 Low FEMA zone X (unshaded) · 0% chance over 30 yrs
- Wildfire 6/10 Major
- Heat 8/10 Severe 7 d/yr ≥108°F today · 20 d/yr by 30 yrs out
- Wind 9/10 Extreme 99% chance of damaging wind over 30 yrs
- Air quality 3/10 Moderate 3 unhealthy d/yr today · 4 by 30 yrs out
Nearby sold comps map
Loading sold comps map…
Walkable amenities ~0.75 mi
Loading nearby amenities…
Taxation est. · year 1
- Rental income
- $20,477
- − Mortgage interest
- −$13,388
- − Property taxes
- −$1,993
- − Insurance
- −$1,195
- − Repairs & maintenance
- −$1,638
- − Management
- −$1,638
- − Depreciation
- −$6,953
- Taxable loss
- −$6,327
- Est. tax savings @ 24.0%
- +$1,518
- After-tax cash flow
- $-532/yr
For passive investors: Depreciation is non-cash, so a rental often shows a tax loss while cash-flowing — sheltering income. Rental losses are passive: they offset passive income freely, and up to $25,000/yr can offset ordinary (W-2) income if you actively participate and your MAGI is under $100k (phasing out to $0 by $150k); unused losses carry forward. On sale, claimed depreciation is recaptured at up to 25%, and gains may owe capital-gains tax (a 1031 exchange can defer both). Figures are a year-1 estimate at your 24.0% rate — not tax advice; consult a CPA.
Schools (NCES district)
- District
- Marion
- NCES district ID
- 1201260
- Math proficiency
- 42% ▼ -7.00%
- Reading proficiency
- 43% ▼ -4.00%
- Median HH income
- $40,015
- Composite
- 35.61/100
- National rank
- #4890
- State rank
- #61 of 73 in FL
Livability — Ocala
- Score
- 69/100
- State rank
- #476
- US rank
- #8461
Category grades
Schools grade is shown separately in the Schools card above.
Census & demographics
- County
- Marion County · 315,796 people
- City population
- 263,375
- Metro
- Ocala, FL
- Population (ZIP)
- 28,997
- Household income
- $65,860
- Rent vs Own
- Severe rent burden
- 204.0
Population outlook (Marion County) Hauer SSP2
- Today (2025)
- 365,905 people
- By 2030
- 376,768 · +3.0%
- By 2040
- 396,555 · +8.4%
- By 2050
- 412,723 · +12.8%
- By 2075
- 446,090 · +21.9%
- By 2100
- 436,193 · +19.2%
Race, ethnicity, and origin ACS 2023
- Neighborhood character
- Diverse neighborhood (Simpson 0.55)
- Race & ethnicity
- White 63% Hispanic / Latino 18% Black 13% Two or more races 10% Asian 1%
- Hispanic origin (detail)
- Mexican 3% Puerto Rican 8% Cuban 3%
- Common ancestry
- Romanian 3% Slovak 3% Lithuanian 3%
- Foreign-born
- 15% · Canada, Jamaica, Dominican Republic
- Languages at home
- 83% English-only · Spanish 14% Other Indo-European 1% German/W. Germanic 1%
Political lean MEDSL · Marion
- 2024 margin
- Solid R (+31.6) · D 33.8% · R 65.5%
- 2008→2024 swing
- -20.0pp toward R · 2008: -11.6pp · 2024: -31.6pp
- All cycles
- 2024: R+31.6 2020: R+25.9 2016: R+26.2 2012: R+16.2 2008: R+11.6
Not yet ingested
- Civics
- —
Market trends
- HPI YoY
- ▼ -105.22%
- Current HPI
- 189.0869
- Rent YoY
- ▼ -2.57%
- Metro
- Ocala, FL
- State GDP YoY
- ▲ 3.28%
- F500 in state
- 36
Industry mix (Fortune 500 HQ in FL)
| Industry | F500 HQs | Revenue |
|---|---|---|
| Industrial Technology | 2 | $29B |
|
||
| Insurance | 2 | $17B |
|
||
| Retail | 1 | $60B |
|
||
| Technology Distribution | 1 | $58B |
|
||
| Homebuilding | 1 | $35B |
|
||
| Technology Manufacturing | 1 | $35B |
|
||
Price history
+2176.2% since first listed15 events — show timeline
- 2026-06-13 Listed $239,000 Stellar MLS as Distributed by MLS Grid
- 2023-06-05 Sold (Public Records) $170,000 Public Records
- 2023-05-30 Sold (MLS) $170,000 Stellar MLS as Distributed by MLS Grid
- 2023-05-20 Pending — Stellar MLS as Distributed by MLS Grid
- 2023-05-15 Listed $179,000 Stellar MLS as Distributed by MLS Grid
- 2022-06-15 Sold (Public Records) $160,000 Public Records
- 2022-06-13 Sold (MLS) $160,000 Stellar MLS as Distributed by MLS Grid
- 2022-04-26 Pending — Stellar MLS as Distributed by MLS Grid
- 2022-04-19 Listed $160,000 Stellar MLS as Distributed by MLS Grid
- 2015-06-30 Listing Removed — Stellar MLS as Distributed by MLS Grid
- 2015-03-19 Listed $87,000 Stellar MLS as Distributed by MLS Grid
- 2015-02-16 Listing Removed — Stellar MLS as Distributed by MLS Grid
- 2014-11-01 Listed $99,900 Stellar MLS as Distributed by MLS Grid
- 1984-01-01 Sold (Public Records) $24,000 Public Records
- 1979-12-01 Sold (Public Records) $10,500 Public Records
Property tax history
+10.2%/yrLatest (2025): $1,993 · +15.3% YoY. Source: county tax records.
Cash-flow waterfall
monthlySold comps — $/sqft
last 12 mo · ≤1 miLoading sold comps…