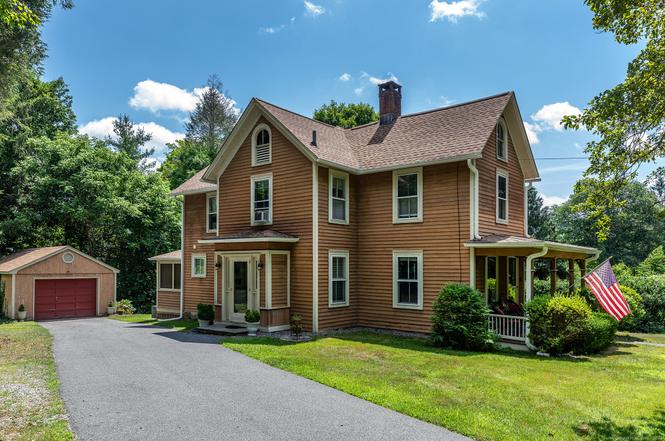
14 Cook St · New Preston, CT
Flood risk 7/10 · Major
- FEMA flood zone
- X
- Chance of flooding over 30 yrs
- 0.98%
- Est. flood insurance / yr
- $473 – $860
Fire risk 3/10 · Minor
- Est. fire insurance / yr
- $829 – $1,539
Heat risk 4/10 · Minor
- Hot days now (above 95°F)
- 7 days/yr
- Hot days in 30 yrs
- 17 days/yr
Wind risk 4/10 · Minor
- Chance of severe wind over 30 yrs
- 22.0%
Air-quality risk 3/10 · Minor
- Unhealthy air days now
- 2 days/yr
- Unhealthy air days in 30 yrs
- 3 days/yr
Risk factors via First Street. Map © Google.
Why this score? — see what drove the B grade
The composite is a weighted blend of 9 inputs, each scored 0–100. Each bar is that input's sub-score; the figure is the points it added to the 100-point composite (weight × sub-score).
- Cash flow +30.0/30.0
- 1% rule +10.0/10.0
- DSCR +10.0/10.0
- Schools +6.3/10.0
- Appreciation +5.1/10.0
- Livability +3.5/5.0
- ARV discount +3.3/15.0
- Rent growth +2.5/5.0
- Condition / age +2.5/5.0
$749,000
🖨 Deal sheet 📄 Offer letter ✓ Due diligence
Listing remarks
Welcome to 14 Cook Street, a charming circa-1900 Victorian located in the heart of Washington Depot. Rich in history, this home was once known as "Cook's Boarding House, " a local inn that helped shape the character of this picturesque New England village. Offering approximately 1,800 square feet of living space, this 4-bedroom, 2-bath home features a traditional layout with a living room, dining room, den, and kitchen with pantry. Period details blend seamlessly with comfortable living, providing both character and functionality. Set on 1.3+ acres, the property offers a rare combination of in-town convenience and private outdoor space. The level lot is enhanced by mature landscap
Key facts
- 1.32 acre lot
- Garage
- Pool
Neighborhood map
What this means for you Summary
Snapshot
- This is a 4-bed/2.0-bath single-family listed at $749k.
Deal economics
- At list price, monthly cash flow is $17k ($207k/yr) — positive.
- The deal already cash-flows at list — no discount required.
- Meets the 1% rule at list price ($28k rent vs $749k).
- Recommended offer: $659k (12.0% below list) — sets the bar for market timing.
- Cap rate 34.0% vs local median 4.0% in New Preston — top-decile yield for the area; either an underpriced asset or a hidden risk that comps aren't pricing in. Stress-test before assuming the spread holds.
Location & tenants
- Location reads 69/100 on livability (#105 in CT) — a middle-class / working-renter tenant base. Strengths: crime A+, employment A+, housing A+; Watch: amenities F, commute F, cost of living F.
- Regional School District 12 (rural): math 64% / reading 77% proficiency, ranked #20 of 153 in CT (top 13%) — strong family-tenant draw, lease renewals of 3-5y typical; only 8% free/reduced lunch — higher-income household profile.
- Zoned schools: Washington Primary School (math 64% / reading 84%, grade A, #44 of 553 statewide, top 10%, 162 students, 25% FRL); Shepaug Valley School (math 61% / reading 76%, grade B, #23 of 194 statewide, top 12%, 494 students, 21% FRL) — zoned schools average 23% FRL vs 8% district-wide (15 pts higher); higher-poverty schools than district average — tighter screening recommended.
- Market conditions: 15 active listings in the ZIP; 4 comparable units currently listed for rent nearby; rentals lingering (median 44d on market — plan ~5-8 weeks vacancy on turnover, expect pricing pressure); 100% of comp listings sitting > 30 days — soft ceiling on asking rent; 154 units permitted in Northwest Hills Planning Region in 2024 (6 in 5+ unit buildings).
Forward outlook
- In year one you build about $6k of equity ($5k loan paydown + $1k appreciation (0.2% local appreciation)).
- At projected returns (0.2% appreciation + 3.0% rent growth), your $210k cash investment doubles in ~1 year — after that, you're playing with house money.
- By year 6, paydown + projected appreciation supports a ~$44k cash-out refi (75% LTV) — recoverable capital for the next deal without selling this one.
Negotiation context
- It's been on market 153 days — a 12% lower offer ($659k) is reasonable based on typical stale-listing flexibility.
- 2 sale attempts with the ask held roughly flat each time — persistent listings suggest the price (not the market) is what's stuck; bring a comps-based counter.
Risks & watch-outs
- Watch-outs: flood insurance adds $56/mo; built in 1900 — expect roof / HVAC / electrical / plumbing capex.
- Climate carrying-cost: major flood risk — expect insurance premiums to compound above CPI over the hold.
Questions for the listing agent
- It's been on market 153 days. Have you received any prior offers? Is the seller open to a 12% concession, seller financing, or rate buy-down credit?
- Built in 1900 — when were the roof, HVAC, electrical panel, plumbing, and water heater last replaced?
- What's the actual annual flood-insurance premium (NFIP or private), and is the property in a SFHA with mandatory coverage?
- Why hasn't it sold? Are there any deal-killer items the seller is aware of (foundation, flood, title, zoning, code violations)?
- Is there a deadline driving the sale (1031 exchange, divorce, estate, relocation)? That informs how much negotiation room exists.
- What's the average days-on-market for RENTAL listings here right now (not sales)? A rising rental-DOM trend means longer vacancies and softer asking-rent achievability than the comps imply.
- What's the recent tenant-quality profile in this submarket — average credit score on applications, eviction rate, late-payment / NSF rate, and stable-employment percentage? A property-management company in the area should have these aggregated.
- How much new for-sale + rental construction is in the pipeline within 1–3 miles? Heavy new supply typically softens prices + rents 12–24 months out; constrained supply supports both.
Investment metrics
- 1% rule
- 3.69% ✓
- Cap rate
- 33.96%
- Cash-on-cash
- 98.80%
- DSCR
- 5.40
- GRM
- 2.3
CMA / ARV
- ARV (on-the-fly)
- $684,544
- Comps found
- 3
Show comp detail 3 sales within ~0.75 mi
| Address | Dist | Beds/Ba | Sqft | Sold | Price | $/sf | Match |
|---|---|---|---|---|---|---|---|
| 43 Cook St | 0.28mi | 3/1.5 (-1) | 1,864 (+4%) | 13mo | $595,000 | $319 | 63 |
| 30 Cook St | 0.15mi | 3/1.5 (-1) | 1,672 (-7%) | 17mo | $695,000 | $416 | 61 |
| 25 Moody Bridge Rd W | 0.45mi | 3/2.0 (-1) | 1,899 (+6%) | 12mo | $725,000 | $382 | 54 |
Match score weights: distance 35% · size 25% · config 20% · recency 20%. Top-matched comps best support the ARV.
Projected returns pro-forma
0.17% appreciation · 3.0% rent growth · sell at horizon
- IRR
- —
- Equity multiple
- 6.15×
- Total profit
- $1,080,322
- Equity at exit
- $223,863
- IRR
- —
- Equity multiple
- 12.72×
- Total profit
- $2,457,565
- Equity at exit
- $274,237
Cash invested: $209,720 (down + closing). Projections, not guarantees.
Landlord ↔ Tenant lean methodology
- Overall (STATE)
- 27 Tenant-Leaning
- State Connecticut
- 27 Tenant-Leaning · D+7
- County
- — inherits STATE
- City
- — inherits STATE
ZIP-level market 06794
- Home prices YoY
- 0.1%
- Active inventory
- 15
- Price-to-rent
- 2.3×
Monthly cashflow live
- Estimated rent
- $27,611 medium interval (Pro) →
- Mortgage (P&I)
- −$3,928
- Tax from tax record
- −$306 /mo · $3,671/yr
- Insurance
- −$312
- Flood insurance flood zone
- −$56 /mo · $666/yr
- HOA
- −$0
- Vacancy / Maint / Mgmt
- −$5,798
- Net cashflow
- $17,211
Break-even live
UW: 25.0% down · 7.5% · 30yr · 1.5% tax · 5.0% vac · 8.0% maint · 8.0% mgmt
Financing live
Cash to close
- Down payment
- $187,250
- Closing costs
- $22,470
- Reserves months
- —
- Total cash needed
- —
Loan-product check · same deal, 3 products live
Conventional
25% down · 7.5% · 30yr
- Down + closing
- —
- Monthly P&I
- —
- Monthly cashflow
- —
- DSCR
- —
- Eligible?
- —
Personal DTI + credit; lowest rate.
DSCR
20% down · 8.5% · 30yr
- Down + closing
- —
- Monthly P&I
- —
- Monthly cashflow
- —
- DSCR
- —
- Eligible?
- —
No personal income docs; deal must DSCR.
Hard money
10% down · 12.0% · 12mo
- Down + closing
- —
- Monthly P&I
- —
- Monthly cashflow
- —
- DSCR
- —
- Eligible?
- —
Short-term bridge; refi at stabilization.
Rent comps 4 comps
| Address | Beds | Baths | Sqft | Rent | $/sqft | DOM | Units | Dist |
|---|---|---|---|---|---|---|---|---|
| 47 Calhoun St Washington Depot, CT | 4.0 | 2.0 | 1720 | $26,900 | $15.64 | 43d | 1 | 0.55mi |
| 115 River Rd Washington Depot, CT | 4.0 | 3.5 | 2538 | $8,500 | $3.35 | 43d | 1 | 1.04mi |
| 114 Bee Brook Rd Washington Depot, CT | 3.0 | 1.0 | 1450 | $3,950 | $2.72 | 43d | 1 | 1.04mi |
| 126 River Rd Washington Depot, CT | 4.0 | 2.5 | 2360 | $29,500 | $12.50 | 43d | 1 | 1.16mi |
Listing history 22 events
-
2026-06-19days on market $749,000 Active 153 DOM
-
2026-06-18days on market $749,000 Active 152 DOM
-
2026-06-17days on market $749,000 Active 151 DOM
-
2026-06-16days on market $749,000 Active 150 DOM
-
2026-06-15days on market $749,000 Active 149 DOM
-
2026-06-14days on market $749,000 Active 147 DOM
-
2026-06-13days on market $749,000 Active 146 DOM
-
2026-06-10days on market $749,000 Active 144 DOM
-
2026-06-09days on market $749,000 Active 143 DOM
-
2026-06-08days on market $749,000 Active 142 DOM
-
2026-06-07days on market $749,000 Active 141 DOM
-
2026-06-05days on market $749,000 Active 138 DOM
-
2026-06-03days on market $749,000 Active 137 DOM
-
2026-06-02days on market $749,000 Active 136 DOM
-
2026-06-01days on market $749,000 Active 135 DOM
-
2026-05-31status $749,000 Active 134 DOM
-
2026-04-12status Under Contract
-
2026-03-24historical Under Contract - Continue to Show
-
2026-03-19status Active
-
2025-10-29historical
-
2025-07-12$749,000 Active
-
2025-06-29historical $749,000
ⓘ Source: listings_history table (triggers on properties + properties_extension) + one-shot
backfill from property_details.listing_events for pre-trigger history.
Tax reassessment forecast CT · Partial reset (capped growth)
- Current annual tax
- $3,671 · $306/mo
- Projected year-2 tax
- $9,850 · $821/mo
- Expected delta
- +$6,179/yr (+$515/mo · 168.3%)
ⓘ Screening estimate from a state-policy table — verify with the county assessor before closing.
Climate risk First Street
- Flood 7/10 Severe FEMA zone X · 98% chance over 30 yrs
- Wildfire 3/10 Moderate
- Heat 4/10 Moderate 7 d/yr ≥95°F today · 17 d/yr by 30 yrs out
- Wind 4/10 Moderate 22% chance of damaging wind over 30 yrs
- Air quality 3/10 Moderate 2 unhealthy d/yr today · 3 by 30 yrs out
Nearby sold comps map
Loading sold comps map…
Walkable amenities ~0.75 mi
Loading nearby amenities…
Taxation est. · year 1
- Rental income
- $331,327
- − Mortgage interest
- −$41,956
- − Property taxes
- −$3,671
- − Insurance
- −$4,412
- − Repairs & maintenance
- −$26,506
- − Management
- −$26,506
- − Depreciation
- −$21,789
- Taxable income
- $206,487
- Est. tax owed @ 24.0%
- −$49,557
- After-tax cash flow
- $156,975/yr
For passive investors: Depreciation is non-cash, so a rental often shows a tax loss while cash-flowing — sheltering income. Rental losses are passive: they offset passive income freely, and up to $25,000/yr can offset ordinary (W-2) income if you actively participate and your MAGI is under $100k (phasing out to $0 by $150k); unused losses carry forward. On sale, claimed depreciation is recaptured at up to 25%, and gains may owe capital-gains tax (a 1031 exchange can defer both). Figures are a year-1 estimate at your 24.0% rate — not tax advice; consult a CPA.
Schools (NCES district)
- District
- Regional School District 12
- NCES district ID
- 0903530
- Math proficiency
- 64% ▼ -9.00%
- Reading proficiency
- 77% ▬ 0.00%
- Median HH income
- $86,065
- Composite
- 63.18/100
- National rank
- #638
- State rank
- #20 of 153 in CT
Livability — New Preston
- Score
- 69/100
- State rank
- #105
- US rank
- #9031
Category grades
Schools grade is shown separately in the Schools card above.
Census & demographics
- City population
- 1,802
- Population (ZIP)
- 953
Population outlook (Northwest Hills County) Hauer SSP2
- By 2040
- 118,998
Race, ethnicity, and origin ACS 2023
- Neighborhood character
- Predominantly White (75%)
- Race & ethnicity
- White 75% Hispanic / Latino 23% Two or more races 14%
- Hispanic origin (detail)
- Dominican 10%
- Common ancestry
- Lithuanian 7% Romanian 6% Iranian 3%
- Foreign-born
- 20% · Canada
- Languages at home
- 69% English-only · Spanish 26% French/Haitian/Cajun 2% German/W. Germanic 2%
Political lean MEDSL · Northwest Hills
- 2024 margin
- Toss-up / Even · D 48.6% · R 49.9% · Other 1.6%
- All cycles
- 2024: R+1.3
Not yet ingested
- Civics
- —
Market trends
- HPI YoY
- ▲ 0.17%
- Current HPI
- 215.191
- Rent YoY
- —
- Metro
- —
- State GDP YoY
- ▲ 1.06%
- F500 in state
- 38
Industry mix (Fortune 500 HQ in CT)
| Industry | F500 HQs | Revenue |
|---|---|---|
| Industrial Machinery | 4 | $38B |
|
||
| Insurance | 3 | $71B |
|
||
| Financial Services | 2 | $25B |
|
||
| Transportation / Logistics | 2 | $18B |
|
||
| Healthcare | 1 | $247B |
|
||
| Telecommunications | 1 | $55B |
|
||
Price history
+0.0% since first listed6 events — show timeline
- 2026-04-12 Pending — Smart MLS
- 2026-03-24 Contingent — Smart MLS
- 2026-03-19 Relisted — Smart MLS
- 2025-10-29 Listing Removed — Smart MLS
- 2025-07-12 Listed $749,000 Smart MLS
- 2025-06-29 Coming Soon $749,000 Smart MLS
Property tax history
+0.1%/yrLatest (2023): $3,671 · +0.0% YoY. Source: county tax records.
Cash-flow waterfall
monthlySold comps — $/sqft
last 12 mo · ≤1 miLoading sold comps…