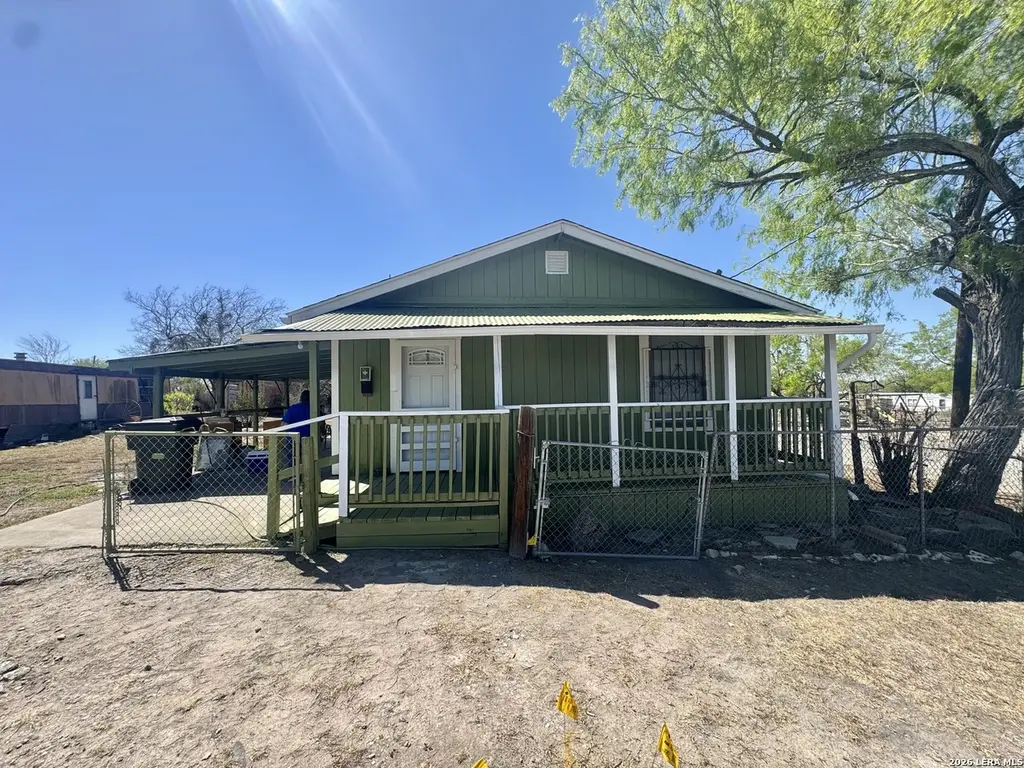
217 N Park Ave · Karnes City, TX
Flood risk 1/10 · Minimal
- FEMA flood zone
- X (unshaded)
- Chance of flooding over 30 yrs
- 0.0%
- Est. flood insurance / yr
- $507 – $1,088
Fire risk 5/10 · Moderate
- Est. fire insurance / yr
- $1,222 – $2,270
Heat risk 8/10 · Major
- Hot days now (above 110°F)
- 7 days/yr
- Hot days in 30 yrs
- 21 days/yr
Wind risk 8/10 · Major
- Chance of severe wind over 30 yrs
- 98.0%
Air-quality risk 1/10 · Minimal
- Unhealthy air days now
- 0 days/yr
- Unhealthy air days in 30 yrs
- 0 days/yr
Risk factors via First Street. Map © Google.
Why this score? — see what drove the B- grade
The composite is a weighted blend of 9 inputs, each scored 0–100. Each bar is that input's sub-score; the figure is the points it added to the 100-point composite (weight × sub-score).
- Cash flow +24.4/30.0
- ARV discount +15.0/15.0
- DSCR +7.9/10.0
- Appreciation +6.9/10.0
- 1% rule +5.0/10.0
- Livability +3.3/5.0
- Rent growth +2.5/5.0
- Condition / age +2.5/5.0
- Schools +2.4/10.0
$85,000
🖨 Deal sheet 📄 Offer letter ✓ Due diligence
Listing remarks MLS
**UPDATED AND READY** 3 LOTS INCLUDED IN THIS SALE - LOTS 5, 6, AND 7 - OFFERING INCREDIBLE OPPORTUNITY AND FLEXIBILITY. THIS PROPERTY FEATURES A 2-BEDROOM LAYOUT OR CAN BE UTILIZED AS AN EFFICIENCY, DEPENDING ON YOUR NEEDS. THERE IS ONE FULL BATHROOM, MAKING THE HOME COMFORTABLE AND LIVABLE FOR BOTH OWNER-OCCUPANTS AND TENANTS. RECENT UPDATES INCLUDE NEW FLOORING, UPDATED BASEBOARDS, RENOVATED BATHROOM AND STORAGE ROOM, FRESH INTERIOR AND EXTERIOR PAINT, AND UPDATED HARDWARE THROUGHOUT THE HOME - ADDING A CLEAN, MODERN TOUCH. SIGNIFICANT POTENTIAL TO EXPAND THE EXISTING STRUCTURE OR BUILD AN ADDITIONAL HOME ON THE EXTRA LOTS. BUYER TO OBTAIN SURVEY TO VERIFY LOT DIMENSIONS AND BOUNDARIES. DON'T MISS THIS UNIQUE OPPORTUNITY TO OWN A CORNER LOT INVESTMENT PROPERTY WITH MULTIPLE POSSIBILITIES.
Key facts
- Recent updates
- Renovated bathroom
- 3 lots included
Tags
Neighborhood map
What this means for you Summary
Snapshot
- This is a 2-bed/1.0-bath manufactured listed at $85k.
Deal economics
- At list price, monthly cash flow is $173 ($2k/yr) — positive.
- The deal already cash-flows at list — no discount required.
- Meets the 1% rule at list price ($852 rent vs $85k).
- Recommended offer: $80k (6.0% below list) — sets the bar for market timing.
Location & tenants
- Location reads 66/100 on livability (#627 in TX) — a middle-class / working-renter tenant base. Strengths: cost of living A+, crime A, housing A; Watch: schools D, amenities F, commute F.
- Karnes City ISD (town): math 24% / reading 32% proficiency, ranked #665 of 826 in TX (top 80%) — low school quality limits family demand, transient renter base, plan for 1-2y turnover; 62% free/reduced lunch — lower-income household profile, screen leases tightly.
- Market conditions: 16 active listings in the ZIP; 78 units permitted in Karnes County in 2024 (0 in 5+ unit buildings).
Forward outlook
- In year one you build about $4k of equity ($588 loan paydown + $3k appreciation (3.8% local appreciation)).
- Karnes County population projected at +42% by 2050 — long-run rental-demand tailwind backs the buy-and-hold thesis.
- At projected returns (3.8% appreciation + 3.0% rent growth), your $24k cash investment doubles in ~4 years — after that, you're playing with house money.
- By year 9, paydown + projected appreciation supports a ~$32k cash-out refi (75% LTV) — recoverable capital for the next deal without selling this one.
Negotiation context
- It's been on market 86 days — a 6% lower offer ($80k) is reasonable based on typical stale-listing flexibility.
- 3 sale attempts with the ask held roughly flat each time — persistent listings suggest the price (not the market) is what's stuck; bring a comps-based counter.
Risks & watch-outs
- Watch-outs: built in 1940 — expect roof / HVAC / electrical / plumbing capex.
- Climate carrying-cost: severe wind risk, 98% chance of damaging wind over 30y; moderate wildfire risk; extreme-heat days projected 7→21/yr by 2055 (HVAC capex compounding) — expect insurance premiums to compound above CPI over the hold.
Questions for the listing agent
- It's been on market 86 days. Have you received any prior offers? Is the seller open to a 6% concession, seller financing, or rate buy-down credit?
- Built in 1940 — when were the roof, HVAC, electrical panel, plumbing, and water heater last replaced?
- Why hasn't it sold? Are there any deal-killer items the seller is aware of (foundation, flood, title, zoning, code violations)?
- Is there a deadline driving the sale (1031 exchange, divorce, estate, relocation)? That informs how much negotiation room exists.
- Schools are D-rated, which usually means shorter tenancies and higher turnover. Who's the typical renter profile here, and what's been the actual vacancy rate?
- What's the average days-on-market for RENTAL listings here right now (not sales)? A rising rental-DOM trend means longer vacancies and softer asking-rent achievability than the comps imply.
- What's the recent tenant-quality profile in this submarket — average credit score on applications, eviction rate, late-payment / NSF rate, and stable-employment percentage? A property-management company in the area should have these aggregated.
- How much new for-sale + rental construction is in the pipeline within 1–3 miles? Heavy new supply typically softens prices + rents 12–24 months out; constrained supply supports both.
Investment metrics
- 1% rule
- 1.00% ✓
- Cap rate
- 8.74%
- Cash-on-cash
- 8.73%
- DSCR
- 1.39
- GRM
- 8.3
CMA / ARV
- ARV (median comp)
- $127,757
- List price
- $85,000
- Delta
- -33.47%
- Verdict
- UNDERPRICED
- Comps
- 5 within 1.0 mi
Projected returns pro-forma
3.75% appreciation · 3.0% rent growth · sell at horizon
- IRR
- 17.5%
- Equity multiple
- 2.04×
- Total profit
- $24,654
- Equity at exit
- $41,861
- IRR
- 18.3%
- Equity multiple
- 3.86×
- Total profit
- $68,158
- Equity at exit
- $67,499
Cash invested: $23,800 (down + closing). Projections, not guarantees.
Landlord ↔ Tenant lean methodology
- Overall (STATE)
- 87 Strongly Landlord-Friendly
- State Texas
- 87 Strongly Landlord-Friendly · R+5
- County
- — inherits STATE
- City
- — inherits STATE
ZIP-level market 78118
- Home prices YoY
- 4.5%
- Active inventory
- 16
- Price-to-rent
- 8.3×
Monthly cashflow live
- Estimated rent
- $852 medium interval (Pro) →
- Mortgage (P&I)
- −$446
- Tax from tax record
- −$19 /mo · $224/yr
- Insurance
- −$35
- HOA
- −$0
- Vacancy / Maint / Mgmt
- −$179
- Net cashflow
- $173
Break-even live
UW: 25.0% down · 7.5% · 30yr · 1.5% tax · 5.0% vac · 8.0% maint · 8.0% mgmt
Financing live
Cash to close
- Down payment
- $21,250
- Closing costs
- $2,550
- Reserves months
- —
- Total cash needed
- —
Loan-product check · same deal, 3 products live
Conventional
25% down · 7.5% · 30yr
- Down + closing
- —
- Monthly P&I
- —
- Monthly cashflow
- —
- DSCR
- —
- Eligible?
- —
Personal DTI + credit; lowest rate.
DSCR
20% down · 8.5% · 30yr
- Down + closing
- —
- Monthly P&I
- —
- Monthly cashflow
- —
- DSCR
- —
- Eligible?
- —
No personal income docs; deal must DSCR.
Hard money
10% down · 12.0% · 12mo
- Down + closing
- —
- Monthly P&I
- —
- Monthly cashflow
- —
- DSCR
- —
- Eligible?
- —
Short-term bridge; refi at stabilization.
Listing history 21 events
-
2026-06-18days on market $85,000 Active 86 DOM
-
2026-06-17days on market $85,000 Active 85 DOM
-
2026-06-16days on market $85,000 Active 84 DOM
-
2026-06-15days on market $85,000 Active 83 DOM
-
2026-06-13days on market $85,000 Active 81 DOM
-
2026-06-12days on market $85,000 Active 80 DOM
-
2026-06-10days on market $85,000 Active 77 DOM
-
2026-06-08days on market $85,000 Active 76 DOM
-
2026-06-08days on market $85,000 Active 75 DOM
-
2026-06-05days on market $85,000 Active 73 DOM
-
2026-06-03days on market $85,000 Active 71 DOM
-
2026-06-02days on market $85,000 Active 70 DOM
-
2026-06-01days on market $85,000 Active 69 DOM
-
2026-05-31days on market $85,000 Active 68 DOM
-
2026-03-25$85,000 New 802-char remark
Show marketing remark (802 chars)
**UPDATED AND READY** 3 LOTS INCLUDED IN THIS SALE - LOTS 5, 6, AND 7 - OFFERING INCREDIBLE OPPORTUNITY AND FLEXIBILITY. THIS PROPERTY FEATURES A 2-BEDROOM LAYOUT OR CAN BE UTILIZED AS AN EFFICIENCY, DEPENDING ON YOUR NEEDS. THERE IS ONE FULL BATHROOM, MAKING THE HOME COMFORTABLE AND LIVABLE FOR BOTH OWNER-OCCUPANTS AND TENANTS. RECENT UPDATES INCLUDE NEW FLOORING, UPDATED BASEBOARDS, RENOVATED BATHROOM AND STORAGE ROOM, FRESH INTERIOR AND EXTERIOR PAINT, AND UPDATED HARDWARE THROUGHOUT THE HOME - ADDING A CLEAN, MODERN TOUCH. SIGNIFICANT POTENTIAL TO EXPAND THE EXISTING STRUCTURE OR BUILD AN ADDITIONAL HOME ON THE EXTRA LOTS. BUYER TO OBTAIN SURVEY TO VERIFY LOT DIMENSIONS AND BOUNDARIES. DON'T MISS THIS UNIQUE OPPORTUNITY TO OWN A CORNER LOT INVESTMENT PROPERTY WITH MULTIPLE POSSIBILITIES.
-
2026-03-23historical
-
2025-12-18status Back on Market
-
2025-10-15status Pending
-
2025-05-26price $85,000
-
2025-01-24price $95,000
-
2025-01-04$110,000 New
ⓘ Source: listings_history table (triggers on properties + properties_extension) + one-shot
backfill from property_details.listing_events for pre-trigger history.
Tax reassessment forecast TX · Resets to sale price
- Current annual tax
- $224 · $19/mo
- Projected year-2 tax
- $1,556 · $130/mo
- Expected delta
- +$1,332/yr (+$111/mo · 594.7%)
ⓘ Screening estimate from a state-policy table — verify with the county assessor before closing.
Climate risk First Street
- Flood 1/10 Low FEMA zone X (unshaded) · 0% chance over 30 yrs
- Wildfire 5/10 Major
- Heat 8/10 Severe 7 d/yr ≥110°F today · 21 d/yr by 30 yrs out
- Wind 8/10 Severe 98% chance of damaging wind over 30 yrs
- Air quality 1/10 Low 0 unhealthy d/yr today · 0 by 30 yrs out
Nearby sold comps map
Loading sold comps map…
Walkable amenities ~0.75 mi
Loading nearby amenities…
Taxation est. · year 1
- Rental income
- $10,224
- − Mortgage interest
- −$4,761
- − Property taxes
- −$224
- − Insurance
- −$425
- − Repairs & maintenance
- −$818
- − Management
- −$818
- − Depreciation
- −$2,473
- Taxable income
- $705
- Est. tax owed @ 24.0%
- −$169
- After-tax cash flow
- $1,910/yr
For passive investors: Depreciation is non-cash, so a rental often shows a tax loss while cash-flowing — sheltering income. Rental losses are passive: they offset passive income freely, and up to $25,000/yr can offset ordinary (W-2) income if you actively participate and your MAGI is under $100k (phasing out to $0 by $150k); unused losses carry forward. On sale, claimed depreciation is recaptured at up to 25%, and gains may owe capital-gains tax (a 1031 exchange can defer both). Figures are a year-1 estimate at your 24.0% rate — not tax advice; consult a CPA.
Schools (NCES district)
- District
- Karnes City ISD
- NCES district ID
- 4825140
- Math proficiency
- 24% ▼ -19.00%
- Reading proficiency
- 32% ▼ -7.00%
- Median HH income
- $45,808
- Composite
- 24.12/100
- National rank
- #7752
- State rank
- #665 of 826 in TX
Livability — Karnes City
- Score
- 66/100
- State rank
- #627
- US rank
- #11963
Category grades
Schools grade is shown separately in the Schools card above.
Census & demographics
- Census place
- Karnes City, TX
- Population (ZIP)
- 4,097
Population outlook (Karnes County) Hauer SSP2
- Today (2025)
- 16,734 people
- By 2030
- 18,027 · +7.7%
- By 2040
- 20,893 · +24.9%
- By 2050
- 23,689 · +41.6%
- By 2075
- 31,064 · +85.6%
- By 2100
- 34,752 · +107.7%
Race, ethnicity, and origin ACS 2023
- Neighborhood character
- Diverse neighborhood (Simpson 0.55)
- Race & ethnicity
- Hispanic / Latino 60% White 30% Two or more races 25% Black 5%
- Hispanic origin (detail)
- Mexican 46% Cuban 2%
- Common ancestry
- Romanian 3% Portuguese 1% Scotch-Irish 1%
- Foreign-born
- 14% · Canada, China
- Languages at home
- 71% English-only · Spanish 28%
Political lean MEDSL · Karnes
- 2024 margin
- Solid R (+58.1) · D 20.7% · R 78.8%
- 2008→2024 swing
- -36.6pp toward R · 2008: -21.6pp · 2024: -58.1pp
- All cycles
- 2024: R+58.1 2020: R+52.1 2016: R+43.4 2012: R+35.9 2008: R+21.6
Not yet ingested
- Civics
- —
Market trends
- HPI YoY
- ▲ 3.75%
- Current HPI
- 87.2904
- Rent YoY
- —
- Metro
- —
- State GDP YoY
- ▲ 3.95%
- F500 in state
- 110
Industry mix (Fortune 500 HQ in TX)
| Industry | F500 HQs | Revenue |
|---|---|---|
| Energy | 16 | $1,198B |
|
||
| Technology | 5 | $198B |
|
||
| Engineering / Construction | 4 | $72B |
|
||
| Energy Services | 3 | $60B |
|
||
| Utilities | 3 | $41B |
|
||
| Healthcare | 2 | $330B |
|
||
Price history
-22.7% since first listed7 events — show timeline
- 2026-03-25 Listed $85,000 LERA
- 2026-03-23 Listing Removed — LERA
- 2025-12-18 Relisted — LERA
- 2025-10-15 Pending — LERA
- 2025-05-26 Price Changed $85,000 LERA
- 2025-01-24 Price Changed $95,000 LERA
- 2025-01-04 Listed $110,000 LERA
Property tax history
+8.0%/yrLatest (2025): $224 · +8.2% YoY. Source: county tax records.
Cash-flow waterfall
monthlySold comps — $/sqft
last 12 mo · ≤1 miLoading sold comps…