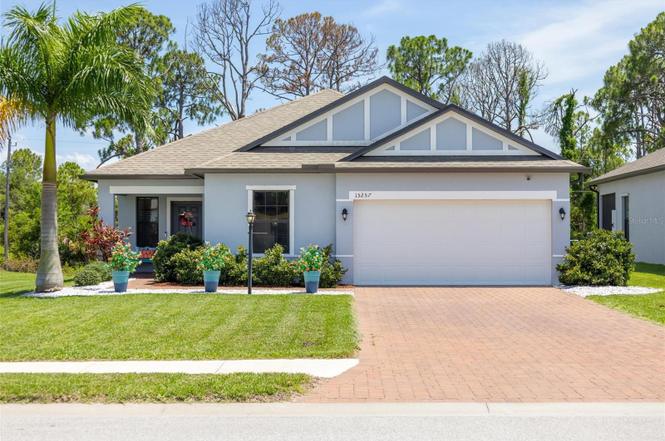
15257 Mille Fiore Blvd · Port Charlotte, FL
Flood risk 9/10 · Severe
- FEMA flood zone
- AE
- Chance of flooding over 30 yrs
- 0.99%
- Est. flood insurance / yr
- $1,737 – $8,500
Fire risk 3/10 · Minor
- Est. fire insurance / yr
- $947 – $1,759
Heat risk 10/10 · Severe
- Hot days now (above 107°F)
- 7 days/yr
- Hot days in 30 yrs
- 28 days/yr
Wind risk 10/10 · Severe
- Chance of severe wind over 30 yrs
- 99.0%
Air-quality risk 3/10 · Minor
- Unhealthy air days now
- 2 days/yr
- Unhealthy air days in 30 yrs
- 3 days/yr
Risk factors via First Street. Map © Google.
Why this score? — see what drove the C grade
The composite is a weighted blend of 9 inputs, each scored 0–100. Each bar is that input's sub-score; the figure is the points it added to the 100-point composite (weight × sub-score).
- Cash flow +20.2/30.0
- ARV discount +15.0/15.0
- DSCR +6.4/10.0
- 1% rule +5.5/10.0
- Schools +4.6/10.0
- Livability +3.2/5.0
- Condition / age +2.5/5.0
- Rent growth +0.6/5.0
- Appreciation +0.0/10.0
$295,000
🖨 Deal sheet (PDF) 📄 Offer letter ✓ Due diligence
Listing remarks
Under contract-accepting backup offers. Seller requesting backup contracts! Nearly New!! Meticulously maintained!! Friendly small community! MOTIVATED SELLER! 3-bedroom, 2-bath Ashton model is located in the desirable gated community of Villa Milano in West Port Charlotte. Built in 2020, this home offers comfort, functionality, and privacy on a quiet lot backing to a peaceful greenbelt. The thoughtfully designed floor plan includes a versatile flex room, ideal for a formal dining space, home office, or additional living area. The light-filled, south-facing backyard provides serene views and abundant natural light, while the covered lanai offers year-round outdoor enjoyment and excellent w
Key facts
- Gated community
- Covered lanai
- Flex room
Tags
Neighborhood map
What this means for you Summary
Snapshot
- This is a 3-bed/2.0-bath single-family listed at $295k.
Deal economics
- At list price, monthly cash flow is $-56 ($-670/yr) — negative.
- To cash-flow at today's rent, offer at most $285k (3.3% below list).
- Meets the 1% rule at list price ($3k rent vs $295k).
- Recommended offer: $268k (9.0% below list) — sets the bar for market timing.
- Cap rate 7.8% vs local median 4.2% in Port Charlotte — top-decile yield for the area; either an underpriced asset or a hidden risk that comps aren't pricing in. Stress-test before assuming the spread holds.
Location & tenants
- Location reads 65/100 on livability (#655 in FL) — a middle-class / working-renter tenant base. Strengths: cost of living A+, housing A+; Watch: employment D, amenities F, commute F.
- Charlotte (suburban): math 54% / reading 54% proficiency, ranked #22 of 73 in FL (top 30%) — acceptable for families but not a draw, mixed tenant base, ~2y average lease.
- Zoned schools: Liberty Elementary School (math 56% / reading 56%, grade C+, #832 of 2,144 statewide, top 40%, 622 students, 56% FRL); Murdock Middle School (math 50% / reading 45%, grade C-, #288 of 571 statewide, top 51%, 577 students, 56% FRL); Port Charlotte High School (math 23% / reading 38%, grade F, #434 of 667 statewide, top 66%, 1,649 students, 43% FRL) — zoned schools at 52% FRL track the district average.
- Market conditions: Rents falling (-7.5%/yr); 1354 active listings in the ZIP; 15 comparable units currently listed for rent nearby; rentals at typical pace (median 23d on market — plan ~3-4 weeks tenant-placement turnaround); solid renter incomes; 4,585 units permitted in Charlotte County in 2024 (703 in 5+ unit buildings).
- This rent runs 45% of the median local income ($83k/yr) — at the standard rent-burdened threshold; future hikes will face affordability resistance.
Forward outlook
- Local home prices are declining (-3.0%/yr); year-one equity from $2k of loan paydown is wiped out by about $9k of value loss. Plan a longer hold.
- Charlotte County population projected at +24% by 2050 — long-run rental-demand tailwind backs the buy-and-hold thesis.
Negotiation context
- It's been on market 104 days — a 9% lower offer ($268k) is reasonable based on typical stale-listing flexibility.
- 9 sale attempts since 2y ago; this cycle's ask has dropped $20k (6%) from the opening price — seller is motivated, your offer sets the floor, not the list.
- Current owner paid $15k; list at $295k implies a 1867% gain — meaningful room to come down on a strong offer.
Risks & watch-outs
- Watch-outs: flood insurance adds $427/mo.
- Climate carrying-cost: in FEMA flood zone AE (mandatory federal flood insurance); severe wind risk, 99% chance of damaging wind over 30y; extreme-heat days projected 7→28/yr by 2055 (HVAC capex compounding) — expect insurance premiums to compound above CPI over the hold.
Questions for the listing agent
- What do current leases actually rent for vs. the listed asking? Can we see a recent rent roll and the last 12 months of T-12 income?
- It's been on market 104 days. Have you received any prior offers? Is the seller open to a 9% concession, seller financing, or rate buy-down credit?
- What's the actual annual flood-insurance premium (NFIP or private), and is the property in a SFHA with mandatory coverage?
- What does the HOA fee cover, when was the last increase, and are there any pending special assessments or reserve-fund shortfalls?
- Why hasn't it sold? Are there any deal-killer items the seller is aware of (foundation, flood, title, zoning, code violations)?
- Is there a deadline driving the sale (1031 exchange, divorce, estate, relocation)? That informs how much negotiation room exists.
- Schools are D-rated, which usually means shorter tenancies and higher turnover. Who's the typical renter profile here, and what's been the actual vacancy rate?
- What's the average days-on-market for RENTAL listings here right now (not sales)? A rising rental-DOM trend means longer vacancies and softer asking-rent achievability than the comps imply.
- What's the recent tenant-quality profile in this submarket — average credit score on applications, eviction rate, late-payment / NSF rate, and stable-employment percentage? A property-management company in the area should have these aggregated.
- How much new for-sale + rental construction is in the pipeline within 1–3 miles? Heavy new supply typically softens prices + rents 12–24 months out; constrained supply supports both.
Investment metrics
- 1% rule
- 1.05% ✓
- Cap rate
- 7.80%
- Cash-on-cash
- 5.39%
- DSCR
- 1.24
- GRM
- 7.9
CMA / ARV
- ARV (on-the-fly)
- $392,277
- Comps found
- 3
Show comp detail 3 sales within ~0.75 mi
| Address | Dist | Beds/Ba | Sqft | Sold | Price | $/sf | Match |
|---|---|---|---|---|---|---|---|
| 2170 Doolittle Ln | 0.39mi | 3/2.0 | 1,770 (+3%) | 10mo | $465,000 | $263 | 68 |
| 2137 Adirondack Ln | 0.27mi | 3/2.0 | 1,929 (+13%) | 16mo | $442,000 | $229 | 53 |
| 2000 Gardenia Ave | 0.71mi | 3/3.0 | 1,862 (+9%) | 1mo | $354,000 | $190 | 48 |
Match score weights: distance 35% · size 25% · config 20% · recency 20%. Top-matched comps best support the ARV.
Projected returns pro-forma
-3.0% appreciation · 0.0% rent growth · sell at horizon
- IRR
- -21.7%
- Equity multiple
- 0.27×
- Total profit
- $-60,105
- Equity at exit
- $43,985
- IRR
- -28.4%
- Equity multiple
- -0.10×
- Total profit
- $-90,653
- Equity at exit
- $25,506
Cash invested: $82,600 (down + closing). Projections, not guarantees.
Landlord ↔ Tenant lean methodology
- Overall (STATE)
- 87 Strongly Landlord-Friendly
- State Florida
- 87 Strongly Landlord-Friendly · R+3
- County
- — inherits STATE
- City
- — inherits STATE
ZIP-level market 33953
- Home prices YoY
- -12.3%
- Rents YoY
- -7.5%
- Active inventory
- 1354
- Price-to-rent
- 7.9×
Monthly cashflow live
- Estimated rent
- $3,098 high interval (Pro) →
- Mortgage (P&I)
- −$1,547
- Tax from tax record
- −$294 /mo · $3,524/yr
- Insurance
- −$123
- Flood insurance flood zone
- −$427 /mo · $5,118/yr
- HOA
- −$113
- Vacancy / Maint / Mgmt
- −$651
- Net cashflow
- $-56
Break-even live
Sensitivity live
| Price | -10% $111 | -5% $28 | +0% $-56 | +5% $-139 | +10% $-223 |
|---|---|---|---|---|---|
| Rent | -10% $-301 | -5% $-178 | +0% $-56 | +5% $67 | +10% $189 |
| Rate | -1.0pp $93 | -0.5pp $19 | base $-56 | +0.5pp $-132 | +1.0pp $-210 |
UW: 25.0% down · 7.5% · 30yr · 1.5% tax · 5.0% vac · 8.0% maint · 8.0% mgmt
Financing live
Cash to close
- Down payment
- $73,750
- Closing costs
- $8,850
- Reserves months
- —
- Total cash needed
- —
Loan-product check · same deal, 3 products live
Conventional
25% down · 7.5% · 30yr
- Down + closing
- —
- Monthly P&I
- —
- Monthly cashflow
- —
- DSCR
- —
- Eligible?
- —
Personal DTI + credit; lowest rate.
DSCR
20% down · 8.5% · 30yr
- Down + closing
- —
- Monthly P&I
- —
- Monthly cashflow
- —
- DSCR
- —
- Eligible?
- —
No personal income docs; deal must DSCR.
Hard money
10% down · 12.0% · 12mo
- Down + closing
- —
- Monthly P&I
- —
- Monthly cashflow
- —
- DSCR
- —
- Eligible?
- —
Short-term bridge; refi at stabilization.
Rent comps 15 comps
| Address | Beds | Baths | Sqft | Rent | $/sqft | DOM | Units | Dist |
|---|---|---|---|---|---|---|---|---|
| 15321 Mille Fiore Blvd Port Charlotte, FL | 3.0 | 2.0 | 1713 | $4,500 | $2.63 | 23d | 1 | 0.14mi |
| 2129 Lorraine Dr Port Charlotte, FL | 3.0 | 2.0 | 1854 | $3,850 | $2.08 | 15d | 1 | 0.41mi |
| 15936 Honey Suckle St Port Charlotte, FL | 4.0 | 3.0 | 2027 | $3,500 | $1.73 | 23d | 1 | 0.53mi |
| 2040 Mackerel St Port Charlotte, FL | 2.0 | 2.0 | 1564 | $1,900 | $1.21 | 23d | 1 | 0.79mi |
| 1638 Saddlewood Cir Port Charlotte, FL | 4.0 | 3.0 | 2027 | $2,450 | $1.21 | 23d | 1 | 0.84mi |
| 2049 Bonito Way Port Charlotte, FL | 2.0 | 2.0 | 1581 | $5,040 | $3.19 | 23d | 1 | 0.85mi |
| 1505 Saddlewood Cir Port Charlotte, FL | 3.0 | 3.0 | 2201 | $2,900 | $1.32 | 23d | 1 | 0.90mi |
| 1464 Saddlewood Cir Port Charlotte, FL | 3.0 | 3.0 | 2198 | $2,800 | $1.27 | 23d | 1 | 0.90mi |
| 16380 S Port Harbor Blvd Port Charlotte, FL | 4.0 | 2.0 | 2038 | $1,950 | $0.96 | 23d | 1 | 1.12mi |
| 14203 Brisk Ave Port Charlotte, FL | 4.0 | 2.0 | 1833 | $1,995 | $1.09 | 15d | 1 | 1.24mi |
| 2227 E Landings Way Port Charlotte, FL | 2.0–3.0 | 2.5 | 1382 | $2,109 | $1.53 | 15d | 1 | 1.24mi |
| 1873 E Isles Rd Port Charlotte, FL | 4.0 | 3.0 | 2032 | $2,800 | $1.38 | 15d | 1 | 1.30mi |
| 1383 Eppinger Dr Port Charlotte, FL | 3.0 | 2.0 | 1438 | $1,800 | $1.25 | 23d | 1 | 1.36mi |
| 15476 Chamberlain Blvd Port Charlotte, FL | 3.0 | 2.0 | 1521 | $2,159 | $1.42 | 15d | 1 | 1.39mi |
| 2172 Peasley St Port Charlotte, FL | 3.0 | 2.0 | 1287 | $2,100 | $1.63 | 23d | 1 | 1.41mi |
HOA detail
- Monthly dues
- $113 · $1,356/yr
- Likely covers
- security
Listing history 36 events
-
2026-04-28status Pending
-
2026-03-30price $295,000
-
2026-02-16price $299,000
-
2026-01-14$315,000 Active
-
2026-01-09historical $2,095
-
2026-01-01$2,095
-
2025-12-21historical $2,095
-
2025-12-18$2,095
-
2025-11-28historical $2,095
-
2025-11-26price $2,095
-
2025-11-08$2,345
-
2025-11-08historical $2,245
-
2025-11-04price $2,245
-
2025-11-01$2,295
-
2025-11-01historical $2,295
-
2025-10-28price $2,295
-
2025-10-22price $2,345
-
2025-10-14price $2,395
-
2025-10-07price $2,445
-
2025-09-30price $2,495
-
2025-09-25$2,545
-
2025-09-18historical
-
2025-09-15historical
-
2025-04-29price $340,000
-
2025-04-29price $340,000
-
2025-03-06price $350,000
-
2025-03-06price $350,000
-
2025-01-17price $369,000
-
2025-01-17price $369,900
-
2024-11-12$375,000 Active
-
2024-11-11$375,000 Active
-
2024-09-25historical
-
2024-08-01price $375,000
-
2024-07-12price $399,999
-
2024-06-21$415,000 Active
-
2019-04-19soldstatus $15,000
ⓘ Source: listings_history table (triggers on properties + properties_extension) + one-shot
backfill from property_details.listing_events for pre-trigger history.
Tax reassessment forecast FL · Resets to sale price
- Current annual tax
- $3,524 · $294/mo
- Projected year-2 tax
- $3,524 · $294/mo
- Expected delta
- $0/yr ($0/mo · 0.0%)
ⓘ Screening estimate from a state-policy table — verify with the county assessor before closing.
Climate risk First Street
- Flood 9/10 Extreme FEMA zone AE · 99% chance over 30 yrs
- Wildfire 3/10 Moderate
- Heat 10/10 Extreme 7 d/yr ≥107°F today · 28 d/yr by 30 yrs out
- Wind 10/10 Extreme 99% chance of damaging wind over 30 yrs
- Air quality 3/10 Moderate 2 unhealthy d/yr today · 3 by 30 yrs out
Nearby sold comps map
Loading sold comps map…
Walkable amenities ~0.75 mi
Loading nearby amenities…
Taxation est. · year 1
- Rental income
- $37,175
- − Mortgage interest
- −$16,525
- − Property taxes
- −$3,524
- − Insurance
- −$6,594
- − Repairs & maintenance
- −$2,974
- − Management
- −$2,974
- − HOA
- −$1,356
- − Depreciation
- −$8,582
- Taxable loss
- −$5,353
- Est. tax savings @ 24.0%
- +$1,285
- After-tax cash flow
- $615/yr
For passive investors: Depreciation is non-cash, so a rental often shows a tax loss while cash-flowing — sheltering income. Rental losses are passive: they offset passive income freely, and up to $25,000/yr can offset ordinary (W-2) income if you actively participate and your MAGI is under $100k (phasing out to $0 by $150k); unused losses carry forward. On sale, claimed depreciation is recaptured at up to 25%, and gains may owe capital-gains tax (a 1031 exchange can defer both). Figures are a year-1 estimate at your 24.0% rate — not tax advice; consult a CPA.
Schools (NCES district)
- District
- Charlotte
- NCES district ID
- 1200240
- Math proficiency
- 54% ▼ -6.00%
- Reading proficiency
- 54% ▼ -1.00%
- Median HH income
- $44,864
- Composite
- 45.62/100
- National rank
- #2586
- State rank
- #22 of 73 in FL
Livability — Port Charlotte
- Score
- 65/100
- State rank
- #655
- US rank
- #13081
Category grades
Schools grade is shown separately in the Schools card above.
Census & demographics
- County
- Charlotte County · 196,994 people
- City population
- 102,180
- Metro
- Punta Gorda, FL
- Population (ZIP)
- 8,318
- Household income
- $83,070
- Rent vs Own
- Severe rent burden
- 36.0
Population outlook (Charlotte County) Hauer SSP2
- Today (2025)
- 198,646 people
- By 2030
- 210,507 · +6.0%
- By 2040
- 230,857 · +16.2%
- By 2050
- 247,148 · +24.4%
- By 2075
- 281,777 · +41.8%
- By 2100
- 293,609 · +47.8%
Race, ethnicity, and origin ACS 2023
- Neighborhood character
- Predominantly White (85%)
- Race & ethnicity
- White 85% Hispanic / Latino 12% Two or more races 5% Black 1%
- Hispanic origin (detail)
- Mexican 2% Puerto Rican 3% Cuban 5%
- Common ancestry
- Romanian 6% Slovak 2% Lithuanian 2%
- Foreign-born
- 8% · Canada, Jamaica, South Korea
- Languages at home
- 90% English-only · Spanish 8% French/Haitian/Cajun 1%
Political lean MEDSL · Charlotte
- 2024 margin
- Solid R (+34.0) · D 32.7% · R 66.7%
- 2008→2024 swing
- -26.7pp toward R · 2008: -7.2pp · 2024: -34.0pp
- All cycles
- 2024: R+34.0 2020: R+26.6 2016: R+27.8 2012: R+14.3 2008: R+7.2
Not yet ingested
- Civics
- —
Market trends
- HPI YoY
- ▼ -37.99%
- Current HPI
- 269.7718
- Rent YoY
- ▼ -7.46%
- Metro
- Punta Gorda, FL
- State GDP YoY
- ▲ 3.28%
- F500 in state
- 36
Industry mix (Fortune 500 HQ in FL)
| Industry | F500 HQs | Revenue |
|---|---|---|
| Industrial Technology | 2 | $29B |
|
||
| Insurance | 2 | $17B |
|
||
| Retail | 1 | $60B |
|
||
| Technology Distribution | 1 | $58B |
|
||
| Homebuilding | 1 | $35B |
|
||
| Technology Manufacturing | 1 | $35B |
|
||
Price history
+1866.7% since first listed36 events — show timeline
- 2026-04-28 Pending — Stellar MLS as Distributed by MLS Grid
- 2026-03-30 Price Changed $295,000 Stellar MLS as Distributed by MLS Grid
- 2026-02-16 Price Changed $299,000 Stellar MLS as Distributed by MLS Grid
- 2026-01-14 Listed $315,000 Stellar MLS as Distributed by MLS Grid
- 2026-01-09 Rental Removed $2,095 STELLARMLS
- 2026-01-01 Listed for Rent $2,095 STELLARMLS
- 2025-12-21 Rental Removed $2,095 STELLARMLS
- 2025-12-18 Listed for Rent $2,095 STELLARMLS
- 2025-11-28 Rental Removed $2,095 STELLARMLS
- 2025-11-26 Price Changed $2,095 STELLARMLS
- 2025-11-08 Listed for Rent $2,345 STELLARMLS
- 2025-11-08 Rental Removed $2,245 BUILDIUM
- 2025-11-04 Price Changed $2,245 BUILDIUM
- 2025-11-01 Listed for Rent $2,295 BUILDIUM
- 2025-11-01 Rental Removed $2,295 TENANTTURNER2
- 2025-10-28 Price Changed $2,295 TENANTTURNER2
- 2025-10-22 Price Changed $2,345 TENANTTURNER2
- 2025-10-14 Price Changed $2,395 TENANTTURNER2
- 2025-10-07 Price Changed $2,445 TENANTTURNER2
- 2025-09-30 Price Changed $2,495 TENANTTURNER2
- 2025-09-25 Listed for Rent $2,545 TENANTTURNER2
- 2025-09-18 Listing Removed — Stellar MLS as Distributed by MLS Grid
- 2025-09-15 Listing Removed — FORTMLS
- 2025-04-29 Price Changed $340,000 FORTMLS
- 2025-04-29 Price Changed $340,000 Stellar MLS as Distributed by MLS Grid
- 2025-03-06 Price Changed $350,000 Stellar MLS as Distributed by MLS Grid
- 2025-03-06 Price Changed $350,000 FORTMLS
- 2025-01-17 Price Changed $369,000 FORTMLS
- 2025-01-17 Price Changed $369,900 Stellar MLS as Distributed by MLS Grid
- 2024-11-12 Listed $375,000 FORTMLS
- 2024-11-11 Listed $375,000 Stellar MLS as Distributed by MLS Grid
- 2024-09-25 Listing Removed — Stellar MLS as Distributed by MLS Grid
- 2024-08-01 Price Changed $375,000 Stellar MLS as Distributed by MLS Grid
- 2024-07-12 Price Changed $399,999 Stellar MLS as Distributed by MLS Grid
- 2024-06-21 Listed $415,000 Stellar MLS as Distributed by MLS Grid
- 2019-04-19 Sold (Public Records) $15,000 Public Records
Property tax history
+38.5%/yrLatest (2025): $3,524 · +2.8% YoY. Source: county tax records.
Cash-flow waterfall
monthlySold comps — $/sqft
last 12 mo · ≤1 miLoading sold comps…