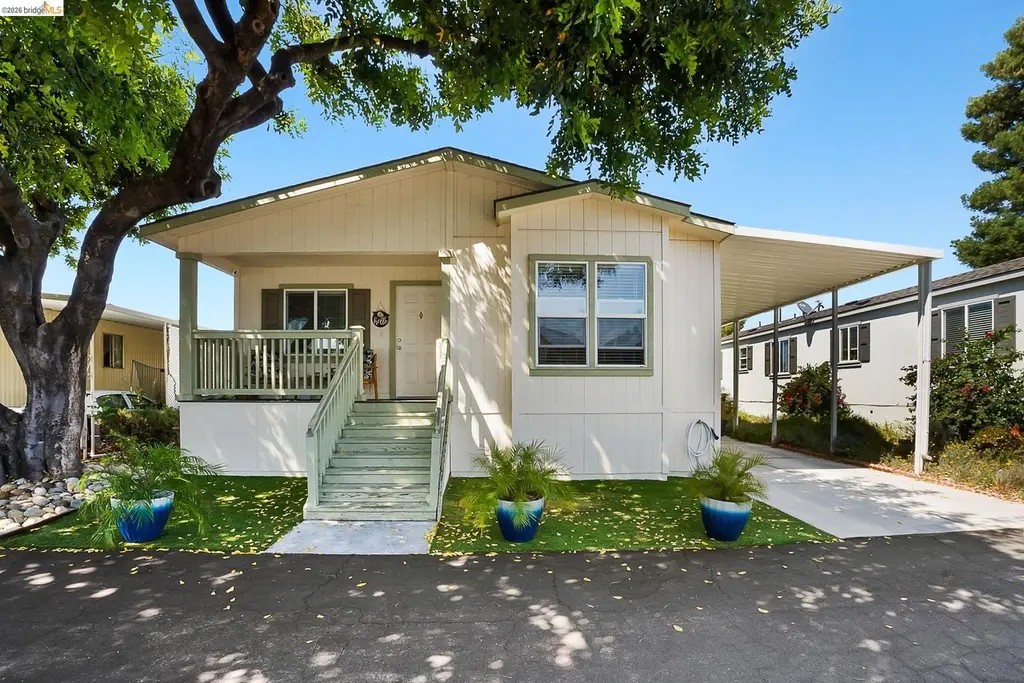
156 Tiki Ln · Pittsburg, CA
Flood risk 1/10 · Minimal
- FEMA flood zone
- X (unshaded)
- Chance of flooding over 30 yrs
- 0.0%
- Est. flood insurance / yr
- $507 – $1,088
Fire risk 6/10 · Moderate
- Est. fire insurance / yr
- $659 – $1,223
Heat risk 5/10 · Moderate
- Hot days now (above 99°F)
- 7 days/yr
- Hot days in 30 yrs
- 14 days/yr
Wind risk 1/10 · Minimal
- Chance of severe wind over 30 yrs
- —
Air-quality risk 8/10 · Major
- Unhealthy air days now
- 14 days/yr
- Unhealthy air days in 30 yrs
- 14 days/yr
Risk factors via First Street. Map © Google.
Why this score? — see what drove the B- grade
The composite is a weighted blend of 9 inputs, each scored 0–100. Each bar is that input's sub-score; the figure is the points it added to the 100-point composite (weight × sub-score).
- Cash flow +30.0/30.0
- DSCR +10.0/10.0
- 1% rule +8.5/10.0
- ARV discount +7.5/15.0
- Livability +2.9/5.0
- Rent growth +2.8/5.0
- Schools +2.8/10.0
- Condition / age +2.5/5.0
- Appreciation +0.0/10.0
$225,000
🖨 Deal sheet 📄 Offer letter ✓ Due diligence
Listing remarks MLS
Well maintained home in the Delta Hawaii 55+ community with an open floor plan with no wasted space. Cute porch area to enjoy with neighbors and friends as well as a BBQ area for outdoor entertaining. Spacious Kitchen/Living Room combo for entertaining. Kitchen has ample storage space and Stainless Steel appliances. The home features wider hallways and doorways, recessed lighting and updated finishes throughout. Bedrooms are spacious, Primary bedroom has a walk-in closet and double vanity. Carport can fit 2 cars. The Delta Hawaii community has a clubhouse, exercise room, swimming pool, ping pong, card tables, billiards, library of books & videos for use, and monthly events to socialize and meet your neighbors!
Key facts
- Ample storage space
- Open floor plan
- Wider hallways
Tags
Neighborhood map
What this means for you Summary
Snapshot
- This is a 3-bed/2.0-bath other listed at $225k.
Deal economics
- At list price, monthly cash flow is $1k ($13k/yr) — positive.
- The deal already cash-flows at list — no discount required.
- Meets the 1% rule at list price ($3k rent vs $225k).
- Recommended offer: $205k (9.0% below list) — sets the bar for market timing.
- Cap rate 11.9% vs local median 3.4% in Pittsburg — top-decile yield for the area; either an underpriced asset or a hidden risk that comps aren't pricing in. Stress-test before assuming the spread holds.
Location & tenants
- Location reads 58/100 on livability (#687 in CA) — a working-class tenant base; expect higher turnover. Strengths: employment A+, housing A+; Watch: schools F, crime D-, amenities F.
- Pittsburg Unified (suburban): math 21% / reading 35% proficiency, ranked #1,069 of 1,400 in CA (top 76%) — low school quality limits family demand, transient renter base, plan for 1-2y turnover; 66% free/reduced lunch — lower-income household profile, screen leases tightly.
- Market conditions: Rents rising (+1.1%/yr); 265 active listings in the ZIP; 23 comparable units currently listed for rent nearby; rentals at typical pace (median 22d on market — plan ~3-4 weeks tenant-placement turnaround); solid renter incomes; 2,169 units permitted in Contra Costa County in 2024 (896 in 5+ unit buildings).
- This rent runs 38% of the median local income ($96k/yr) — at the standard rent-burdened threshold; future hikes will face affordability resistance.
Forward outlook
- Local home prices are declining (-3.0%/yr); year-one equity from $2k of loan paydown is wiped out by about $7k of value loss. Plan a longer hold.
- Contra Costa County population projected at +26% by 2050 — long-run rental-demand tailwind backs the buy-and-hold thesis.
- At projected returns (-3.0% appreciation + 1.1% rent growth), your $63k cash investment doubles in ~7 years — after that, you're playing with house money.
Negotiation context
- It's been on market 114 days — a 9% lower offer ($205k) is reasonable based on typical stale-listing flexibility.
- 4 sale attempts with the ask held roughly flat each time — persistent listings suggest the price (not the market) is what's stuck; bring a comps-based counter.
Risks & watch-outs
- Climate carrying-cost: major wildfire risk; extreme-heat days projected 7→14/yr by 2055 (HVAC capex compounding) — expect insurance premiums to compound above CPI over the hold.
Questions for the listing agent
- It's been on market 114 days. Have you received any prior offers? Is the seller open to a 9% concession, seller financing, or rate buy-down credit?
- Why hasn't it sold? Are there any deal-killer items the seller is aware of (foundation, flood, title, zoning, code violations)?
- Is there a deadline driving the sale (1031 exchange, divorce, estate, relocation)? That informs how much negotiation room exists.
- Schools are F-rated, which usually means shorter tenancies and higher turnover. Who's the typical renter profile here, and what's been the actual vacancy rate?
- Crime grade is D in this area — have there been break-ins, vandalism, or insurance claims at this property in the last 3 years? What carrier currently insures it and at what premium?
- What's the average days-on-market for RENTAL listings here right now (not sales)? A rising rental-DOM trend means longer vacancies and softer asking-rent achievability than the comps imply.
- What's the recent tenant-quality profile in this submarket — average credit score on applications, eviction rate, late-payment / NSF rate, and stable-employment percentage? A property-management company in the area should have these aggregated.
- How much new for-sale + rental construction is in the pipeline within 1–3 miles? Heavy new supply typically softens prices + rents 12–24 months out; constrained supply supports both.
Investment metrics
- 1% rule
- 1.35% ✓
- Cap rate
- 11.86%
- Cash-on-cash
- 19.88%
- DSCR
- 1.88
- GRM
- 6.2
CMA / ARV
- ARV (median comp)
- $86,700
- List price
- $225,000
- Delta
- 159.52%
- Verdict
- OVERPRICED
- Comps
- 18 within 1.0 mi
Projected returns pro-forma
-3.0% appreciation · 1.11% rent growth · sell at horizon
- IRR
- 10.0%
- Equity multiple
- 1.39×
- Total profit
- $24,277
- Equity at exit
- $33,548
- IRR
- 17.6%
- Equity multiple
- 2.33×
- Total profit
- $84,019
- Equity at exit
- $19,454
Cash invested: $63,000 (down + closing). Projections, not guarantees.
Landlord ↔ Tenant lean methodology
- Overall (STATE)
- 18 Strongly Tenant-Friendly
- State California
- 18 Strongly Tenant-Friendly · D+13
- County
- — inherits STATE
- City
- — inherits STATE
ZIP-level market 94565
- Rents YoY
- 1.1%
- Active inventory
- 265
- Price-to-rent
- 6.2×
Monthly cashflow live
- Estimated rent
- $3,043 high interval (Pro) →
- Mortgage (P&I)
- −$1,180
- Tax from tax record
- −$86 /mo · $1,033/yr
- Insurance
- −$94
- HOA
- −$0
- Vacancy / Maint / Mgmt
- −$639
- Net cashflow
- $1,044
Break-even live
UW: 25.0% down · 7.5% · 30yr · 1.5% tax · 5.0% vac · 8.0% maint · 8.0% mgmt
Financing live
Cash to close
- Down payment
- $56,250
- Closing costs
- $6,750
- Reserves months
- —
- Total cash needed
- —
Loan-product check · same deal, 3 products live
Conventional
25% down · 7.5% · 30yr
- Down + closing
- —
- Monthly P&I
- —
- Monthly cashflow
- —
- DSCR
- —
- Eligible?
- —
Personal DTI + credit; lowest rate.
DSCR
20% down · 8.5% · 30yr
- Down + closing
- —
- Monthly P&I
- —
- Monthly cashflow
- —
- DSCR
- —
- Eligible?
- —
No personal income docs; deal must DSCR.
Hard money
10% down · 12.0% · 12mo
- Down + closing
- —
- Monthly P&I
- —
- Monthly cashflow
- —
- DSCR
- —
- Eligible?
- —
Short-term bridge; refi at stabilization.
Rent comps 23 comps
| Address | Beds | Baths | Sqft | Rent | $/sqft | DOM | Units | Dist |
|---|---|---|---|---|---|---|---|---|
| 4 Meadowbrook Ave Pittsburg, CA | 2.0 | 2.0 | 1122 | $2,600 | $2.32 | 43d | 1 | 0.22mi |
| 2221 Lynbrook Dr Pittsburg, CA | 3.0 | 2.0 | 1365 | $3,195 | $2.34 | 43d | 1 | 0.29mi |
| 948 Golden Leaf Way Pittsburg, CA | 3.0 | 2.0 | 1386 | $3,400 | $2.45 | 43d | 1 | 0.36mi |
| 1 Addison Ct Pittsburg, CA | 4.0 | 2.5 | 1805 | $3,295 | $1.83 | 24d | 1 | 0.37mi |
| 500 Loveridge Cir Pittsburg, CA | 1.0–3.0 | 1.0–2.0 | 825 | $2,940 | $3.56 | 1d | 10 | 0.46mi |
| 110 Dias Cir Pittsburg, CA | 1.0–3.0 | 1.0–2.0 | 819 | $2,895 | $3.53 | 1d | 15 | 0.46mi |
| 3809 Lassen Dr Pittsburg, CA | 3.0 | 1.5 | 1650 | $2,995 | $1.82 | 3d | 1 | 0.59mi |
| 240 Benjamin Ave Pittsburg, CA | 3.0 | 2.0 | 1379 | $3,139 | $2.28 | 2d | 1 | 0.66mi |
| 4225 McFaul Dr Pittsburg, CA | 4.0 | 2.0 | 1500 | $4,100 | $2.73 | 24d | 1 | 0.73mi |
| 60 Xena Ct Pittsburg, CA | 3.0 | 2.5 | 1805 | $3,200 | $1.77 | 43d | 1 | 0.78mi |
| 17 Lorraine Ave Pittsburg, CA | 3.0 | 1.5 | 1180 | $2,700 | $2.29 | 18d | 1 | 0.80mi |
| 2205 E Leland Rd Pittsburg, CA | 1.0–2.0 | 1.0–2.0 | 847 | $2,359 | $2.79 | 1d | 20 | 1.03mi |
| 30 Castlewood Dr Pittsburg, CA | 1.0–2.0 | 1.0 | 793 | $2,640 | $3.33 | 1d | 3 | 1.04mi |
| 1353 Pine St Pittsburg, CA | 3.0 | 2.0 | 1369 | $2,750 | $2.01 | 5d | 1 | 1.04mi |
| 1341 Maple St Pittsburg, CA | 2.0 | 1.0 | 1299 | $2,550 | $1.96 | 21d | 1 | 1.04mi |
| 1346 Redwood St Pittsburg, CA | 3.0 | 1.5 | 1066 | $2,915 | $2.73 | 16d | 1 | 1.08mi |
| 706 E 12th St Pittsburg, CA | 2.0 | 1.0 | 939 | $2,490 | $2.65 | 24d | 1 | 1.15mi |
| 706 E 12th St Pittsburg, CA | 2.0 | 1.0 | 935 | $2,490 | $2.66 | 21d | 1 | 1.15mi |
| 99 Liberty Ct Pittsburg, CA | 3.0 | 2.5 | 1802 | $3,600 | $2.00 | 43d | 1 | 1.15mi |
| 1000 Pheasant Dr Pittsburg, CA | 1.0–2.0 | 1.0–2.5 | 879 | $2,795 | $3.18 | 24d | 29 | 1.19mi |
| 241 W Buchanan Rd Pittsburg, CA | 1.0–2.0 | 1.0–2.0 | 840 | $2,660 | $3.17 | 1d | 13 | 1.23mi |
| 34 Kingswood Dr Pittsburg, CA | 4.0 | 2.0 | 1755 | $3,900 | $2.22 | 43d | 1 | 1.38mi |
| 322 E 8th St Pittsburg, CA | 2.0 | 1.0 | 884 | $2,495 | $2.82 | 18d | 1 | 1.49mi |
Listing history 21 events
-
2026-06-18days on market $225,000 Active 114 DOM
-
2026-06-17days on market $225,000 Active 113 DOM
-
2026-06-16days on market $225,000 Active 112 DOM
-
2026-06-15days on market $225,000 Active 111 DOM
-
2026-06-13days on market $225,000 Active 109 DOM
-
2026-06-13days on market $225,000 Active 108 DOM
-
2026-06-09days on market $225,000 Active 105 DOM
-
2026-06-08days on market $225,000 Active 104 DOM
-
2026-06-07days on market $225,000 Active 103 DOM
-
2026-06-04days on market $225,000 Active 100 DOM
-
2026-06-03days on market $225,000 Active 99 DOM
-
2026-06-02days on market $225,000 Active 98 DOM
-
2026-06-01days on market $225,000 Active 97 DOM
-
2026-05-31days on market $225,000 Active 96 DOM
-
2026-04-09status Active 723-char remark
Show marketing remark (723 chars)
Well maintained home in the Delta Hawaii 55+ community with an open floor plan with no wasted space. Cute porch area to enjoy with neighbors and friends as well as a BBQ area for outdoor entertaining. Spacious Kitchen/Living Room combo for entertaining. Kitchen has ample storage space and Stainless Steel appliances. The home features wider hallways and doorways, recessed lighting and updated finishes throughout. Bedrooms are spacious, Primary bedroom has a walk-in closet and double vanity. Carport can fit 2 cars. The Delta Hawaii community has a clubhouse, exercise room, swimming pool, ping pong, card tables, billiards, library of books & videos for use, and monthly events to socialize and meet your neighbors!
-
2026-03-30historical Active Under Contract 723-char remark
Show marketing remark (723 chars)
Well maintained home in the Delta Hawaii 55+ community with an open floor plan with no wasted space. Cute porch area to enjoy with neighbors and friends as well as a BBQ area for outdoor entertaining. Spacious Kitchen/Living Room combo for entertaining. Kitchen has ample storage space and Stainless Steel appliances. The home features wider hallways and doorways, recessed lighting and updated finishes throughout. Bedrooms are spacious, Primary bedroom has a walk-in closet and double vanity. Carport can fit 2 cars. The Delta Hawaii community has a clubhouse, exercise room, swimming pool, ping pong, card tables, billiards, library of books & videos for use, and monthly events to socialize and meet your neighbors!
-
2026-02-24$225,000 Active 723-char remark
Show marketing remark (723 chars)
Well maintained home in the Delta Hawaii 55+ community with an open floor plan with no wasted space. Cute porch area to enjoy with neighbors and friends as well as a BBQ area for outdoor entertaining. Spacious Kitchen/Living Room combo for entertaining. Kitchen has ample storage space and Stainless Steel appliances. The home features wider hallways and doorways, recessed lighting and updated finishes throughout. Bedrooms are spacious, Primary bedroom has a walk-in closet and double vanity. Carport can fit 2 cars. The Delta Hawaii community has a clubhouse, exercise room, swimming pool, ping pong, card tables, billiards, library of books & videos for use, and monthly events to socialize and meet your neighbors!
-
2025-09-09historical
-
2025-08-20status Active
-
2025-07-23status Pending
-
2025-06-20Active
ⓘ Source: listings_history table (triggers on properties + properties_extension) + one-shot
backfill from property_details.listing_events for pre-trigger history.
Tax reassessment forecast CA · Resets to sale price
- Current annual tax
- $1,033 · $86/mo
- Projected year-2 tax
- $1,710 · $142/mo
- Expected delta
- +$677/yr (+$56/mo · 65.6%)
ⓘ Screening estimate from a state-policy table — verify with the county assessor before closing.
Climate risk First Street
- Flood 1/10 Low FEMA zone X (unshaded) · 0% chance over 30 yrs
- Wildfire 6/10 Major
- Heat 5/10 Major 7 d/yr ≥99°F today · 14 d/yr by 30 yrs out
- Wind 1/10 Low
- Air quality 8/10 Severe 14 unhealthy d/yr today · 14 by 30 yrs out
Nearby sold comps map
Loading sold comps map…
Walkable amenities ~0.75 mi
Loading nearby amenities…
Taxation est. · year 1
- Rental income
- $36,512
- − Mortgage interest
- −$12,603
- − Property taxes
- −$1,033
- − Insurance
- −$1,125
- − Repairs & maintenance
- −$2,921
- − Management
- −$2,921
- − Depreciation
- −$6,545
- Taxable income
- $9,363
- Est. tax owed @ 24.0%
- −$2,247
- After-tax cash flow
- $10,280/yr
For passive investors: Depreciation is non-cash, so a rental often shows a tax loss while cash-flowing — sheltering income. Rental losses are passive: they offset passive income freely, and up to $25,000/yr can offset ordinary (W-2) income if you actively participate and your MAGI is under $100k (phasing out to $0 by $150k); unused losses carry forward. On sale, claimed depreciation is recaptured at up to 25%, and gains may owe capital-gains tax (a 1031 exchange can defer both). Figures are a year-1 estimate at your 24.0% rate — not tax advice; consult a CPA.
Schools (NCES district)
- District
- Pittsburg Unified
- NCES district ID
- 0630600
- Math proficiency
- 21% ▲ 1.00%
- Reading proficiency
- 35% ▲ 1.00%
- Median HH income
- $55,872
- Composite
- 27.99/100
- National rank
- #12238
- State rank
- #1069 of 1400 in CA
Livability — Pittsburg
- Score
- 58/100
- State rank
- #687
- US rank
- #20922
Category grades
Schools grade is shown separately in the Schools card above.
Census & demographics
- Census place
- Pittsburg, CA
- County
- Contra Costa County · 1,059,880 people
- City population
- 100,488
- Metro
- San Francisco-Oakland-Berkeley, CA
- Population (ZIP)
- 100,488
- Household income
- $95,556
- Rent vs Own
- Severe rent burden
- 3942.0
Population outlook (Contra Costa County) Hauer SSP2
- Today (2025)
- 1,287,720 people
- By 2030
- 1,364,937 · +6.0%
- By 2040
- 1,506,209 · +17.0%
- By 2050
- 1,624,373 · +26.1%
- By 2075
- 1,853,193 · +43.9%
- By 2100
- 1,901,231 · +47.6%
Race, ethnicity, and origin ACS 2023
- Neighborhood character
- Diverse neighborhood (Simpson 0.70)
- Race & ethnicity
- Hispanic / Latino 48% Two or more races 19% Asian 17% White 16% Black 13% Pacific Islander 1% Native American 1%
- Hispanic origin (detail)
- Mexican 38% Puerto Rican 1%
- Common ancestry
- Italian 1% Russian 1% Lithuanian 1%
- Foreign-born
- 34% · Canada, China, Vietnam
- Languages at home
- 47% English-only · Spanish 37% Tagalog/Filipino 6% Other Indo-European 4%
Political lean MEDSL · Contra Costa
- 2024 margin
- Solid D (+38.0) · D 67.3% · R 29.4% · Other 3.3%
- 2008→2024 swing
- +0.2pp no change · 2008: 37.8pp · 2024: 38.0pp
- All cycles
- 2024: D+38.0 2020: D+45.3 2016: D+43.5 2012: D+33.7 2008: D+37.8
Not yet ingested
- Civics
- —
Market trends
- HPI YoY
- ▼ -478.40%
- Current HPI
- 376.2576
- Rent YoY
- ▲ 1.11%
- Metro
- San Francisco-Oakland-Berkeley, CA
- State GDP YoY
- ▲ 3.21%
- F500 in state
- 116
Industry mix (Fortune 500 HQ in CA)
| Industry | F500 HQs | Revenue |
|---|---|---|
| Technology | 27 | $1,492B |
|
||
| Financial Services | 3 | $174B |
|
||
| Retail | 3 | $44B |
|
||
| Insurance | 3 | $26B |
|
||
| Media / Entertainment | 2 | $115B |
|
||
| Pharmaceuticals / Biotech | 2 | $62B |
|
||
Price history
7 events — show timeline
- 2026-04-09 Relisted — bridgeMLS, Bay East AOR, or Contra Costa AOR
- 2026-03-30 Contingent — bridgeMLS, Bay East AOR, or Contra Costa AOR
- 2026-02-24 Listed $225,000 bridgeMLS, Bay East AOR, or Contra Costa AOR
- 2025-09-09 Listing Removed — bridgeMLS, Bay East AOR, or Contra Costa AOR
- 2025-08-20 Relisted — bridgeMLS, Bay East AOR, or Contra Costa AOR
- 2025-07-23 Pending — bridgeMLS, Bay East AOR, or Contra Costa AOR
- 2025-06-20 Listed — bridgeMLS, Bay East AOR, or Contra Costa AOR
Property tax history
-0.4%/yrLatest (2025): $1,033 · +3.0% YoY. Source: county tax records.
Cash-flow waterfall
monthlySold comps — $/sqft
last 12 mo · ≤1 miLoading sold comps…