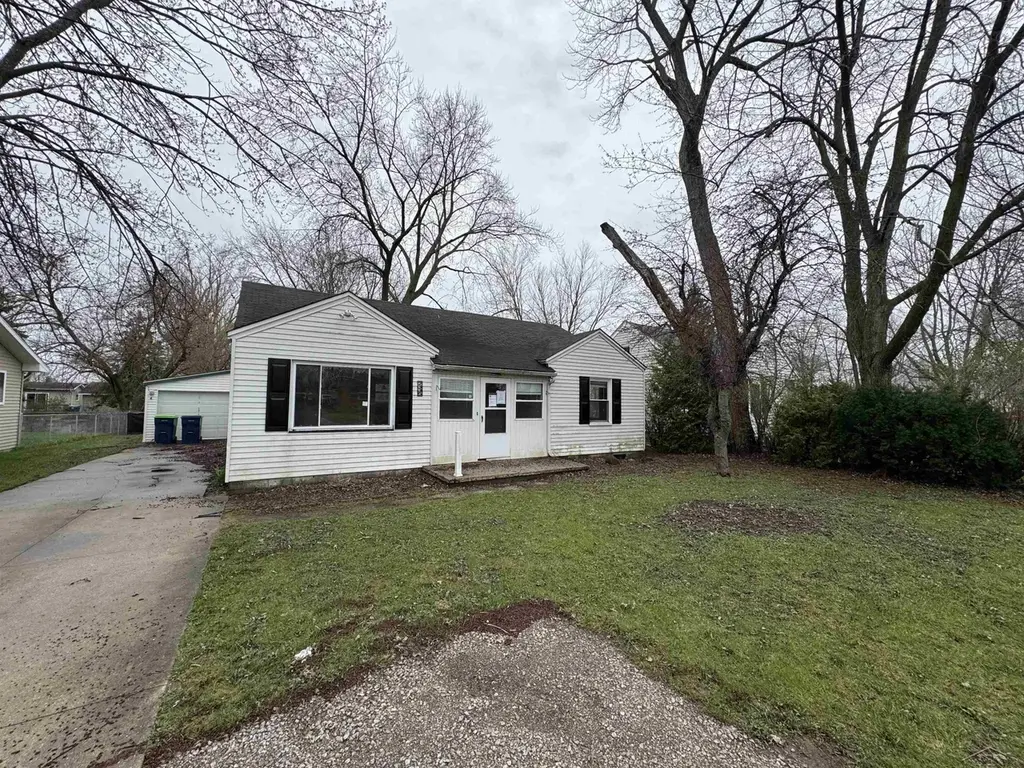
2335 Shattuck Rd · Saginaw, MI
Flood risk 1/10 · Minimal
- FEMA flood zone
- X (unshaded)
- Chance of flooding over 30 yrs
- 0.0%
- Est. flood insurance / yr
- $507 – $1,088
Fire risk 1/10 · Minimal
- Est. fire insurance / yr
- $784 – $1,456
Heat risk 2/10 · Minimal
- Hot days now (above 99°F)
- 7 days/yr
- Hot days in 30 yrs
- 14 days/yr
Wind risk 1/10 · Minimal
- Chance of severe wind over 30 yrs
- —
Air-quality risk 2/10 · Minimal
- Unhealthy air days now
- 1 days/yr
- Unhealthy air days in 30 yrs
- 1 days/yr
Risk factors via First Street. Map © Google.
Why this score? — see what drove the B grade
The composite is a weighted blend of 9 inputs, each scored 0–100. Each bar is that input's sub-score; the figure is the points it added to the 100-point composite (weight × sub-score).
- Cash flow +30.0/30.0
- 1% rule +10.0/10.0
- DSCR +10.0/10.0
- ARV discount +7.5/15.0
- Rent growth +4.4/5.0
- Livability +3.2/5.0
- Schools +3.1/10.0
- Condition / age +2.5/5.0
- Appreciation +0.0/10.0
$70,000
🖨 Deal sheet (PDF) 📄 Offer letter ✓ Due diligence
Listing remarks MLS
HIGHEST AND BEST DUE WEDNESDAY 4/29/2026 @ 12 NOON. Welcome to this 3-bedroom, 2 full bath home full of potential and opportunity! Featuring wood floors, a functional layout, and a 1-car attached garage, this property offers a solid foundation for your vision. Enjoy the convenience of a fenced-in backyard-perfect for pets, entertaining, or relaxing outdoors. Located in a convenient location close to everyday amenities, this home is ideal for buyers looking to add their personal touch. With a little TLC, this property could truly shine. Call today to schedule your personal showing! SELLER WILL NOT REVIEW OFFERS FOR 10 DAYS!
Key facts
- Wood floors
- Functional layout
- Convenient location
Tags
Neighborhood map
What this means for you Summary
Snapshot
- This is a 3-bed/1.0-bath single-family listed at $70k.
Deal economics
- At list price, monthly cash flow is $635 ($8k/yr) — positive.
- The deal already cash-flows at list — no discount required.
- Meets the 1% rule at list price ($2k rent vs $70k).
- Recommended offer: $69k (1.5% below list) — sets the bar for market timing.
- Cap rate 17.2% vs local median 8.2% in Saginaw — top-decile yield for the area; either an underpriced asset or a hidden risk that comps aren't pricing in. Stress-test before assuming the spread holds.
Location & tenants
- Location reads 63/100 on livability (#521 in MI) — a middle-class / working-renter tenant base. Strengths: cost of living A+, housing A+, health & safety A+; Watch: schools F, crime F, amenities F.
- Saginaw Township Community Schools (suburban): math 27% / reading 45% proficiency, ranked #265 of 540 in MI (top 49%) — families likely to look elsewhere, expect single-tenant / working-renter base with shorter leases.
- Market conditions: Rents rising fast (+7.7%/yr); 156 active listings in the ZIP; 1 comparable units currently listed for rent nearby; 154 units permitted in Saginaw County in 2024 (0 in 5+ unit buildings).
Forward outlook
- Local home prices are declining (-3.0%/yr); year-one equity from $484 of loan paydown is wiped out by about $2k of value loss. Plan a longer hold.
- Saginaw County population projected at -25% by 2050 — secular population decline; favor cash flow + early exit over multi-decade hold.
- At projected returns (-3.0% appreciation + 7.7% rent growth), your $20k cash investment doubles in ~3 years — after that, you're playing with house money.
Negotiation context
- It's been on market 19 days — a 2% lower offer ($69k) is reasonable based on typical stale-listing flexibility.
- 4 sale attempts since 25y ago with the ask held roughly flat each time — persistent listings suggest the price (not the market) is what's stuck; bring a comps-based counter.
Risks & watch-outs
- Watch-outs: property tax is 2.9% of price; built in 1948 — expect roof / HVAC / electrical / plumbing capex.
Questions for the listing agent
- Built in 1948 — when were the roof, HVAC, electrical panel, plumbing, and water heater last replaced?
- Property tax is high relative to price — has the assessment been appealed recently, and will the sale trigger a re-assessment?
- Is there a deadline driving the sale (1031 exchange, divorce, estate, relocation)? That informs how much negotiation room exists.
- Schools are F-rated, which usually means shorter tenancies and higher turnover. Who's the typical renter profile here, and what's been the actual vacancy rate?
- Crime grade is F in this area — have there been break-ins, vandalism, or insurance claims at this property in the last 3 years? What carrier currently insures it and at what premium?
- What's the average days-on-market for RENTAL listings here right now (not sales)? A rising rental-DOM trend means longer vacancies and softer asking-rent achievability than the comps imply.
- What's the recent tenant-quality profile in this submarket — average credit score on applications, eviction rate, late-payment / NSF rate, and stable-employment percentage? A property-management company in the area should have these aggregated.
- How much new for-sale + rental construction is in the pipeline within 1–3 miles? Heavy new supply typically softens prices + rents 12–24 months out; constrained supply supports both.
Investment metrics
- 1% rule
- 2.17% ✓
- Cap rate
- 17.18%
- Cash-on-cash
- 38.88%
- DSCR
- 2.73
- GRM
- 3.8
CMA / ARV
- ARV (median comp)
- $167,065
- List price
- $70,000
- Delta
- -58.10%
- Verdict
- UNDERPRICED
- Comps
- 20 within 1.0 mi
Show comp detail 12 sales within ~0.75 mi
| Address | Dist | Beds/Ba | Sqft | Sold | Price | $/sf | Match |
|---|---|---|---|---|---|---|---|
| 2335 Shattuck Rd | 0.00mi | 3/2.0 | 1,476 (0%) | 0mo | $63,000 | $43 | 96 |
| 2295 Plainview Dr | 0.10mi | 3/1.0 | 1,340 (-9%) | 11mo | $170,000 | $127 | 71 |
| 704 Stoker Dr | 0.59mi | 3/1.0 | 1,444 (-2%) | 9mo | $54,900 | $38 | 61 |
| 2770 Shattuck Rd | 0.45mi | 2/1.0 (-1) | 1,402 (-5%) | 6mo | $145,000 | $103 | 61 |
| 2136 Plainview Dr | 0.23mi | 3/1.5 | 1,316 (-11%) | 11mo | $158,000 | $120 | 60 |
| 1112 Asbury Ct | 0.45mi | 4/2.0 (+1) | 1,440 (-2%) | 8mo | $185,000 | $128 | 60 |
| 956 W Stoker Dr | 0.38mi | 4/2.0 (+1) | 1,456 (-1%) | 14mo | $94,000 | $65 | 59 |
| 2456 Barnard St | 0.61mi | 3/2.0 | 1,610 (+9%) | 2mo | $145,000 | $90 | 51 |
| 2917 N Michigan Ave | 0.64mi | 4/1.0 (+1) | 1,609 (+9%) | 4mo | $125,000 | $78 | 47 |
| 21 Ruhlig Ct | 0.65mi | 2/2.0 (-1) | 1,548 (+5%) | 8mo | $133,900 | $86 | 46 |
| 3076 Hanchett St | 0.51mi | 3/1.0 | 1,295 (-12%) | 14mo | $134,000 | $103 | 44 |
| 2463 Benjamin St | 0.70mi | 3/1.0 | 1,320 (-11%) | 8mo | $50,000 | $38 | 43 |
Match score weights: distance 35% · size 25% · config 20% · recency 20%. Top-matched comps best support the ARV.
Projected returns pro-forma
-3.0% appreciation · 7.71% rent growth · sell at horizon
- IRR
- 40.7%
- Equity multiple
- 2.87×
- Total profit
- $36,730
- Equity at exit
- $10,437
- IRR
- 49.4%
- Equity multiple
- 7.05×
- Total profit
- $118,520
- Equity at exit
- $6,052
Cash invested: $19,600 (down + closing). Projections, not guarantees.
Landlord ↔ Tenant lean methodology
- Overall (STATE)
- 62 Landlord-Friendly
- State Michigan
- 62 Landlord-Friendly · EVEN
- County
- — inherits STATE
- City
- — inherits STATE
ZIP-level market 48603
- Rents YoY
- 7.7%
- Active inventory
- 156
- Price-to-rent
- 3.8×
Monthly cashflow live
- Estimated rent
- $1,521 medium interval (Pro) →
- Mortgage (P&I)
- −$367
- Tax from tax record
- −$170 /mo · $2,040/yr
- Insurance
- −$29
- HOA
- −$0
- Vacancy / Maint / Mgmt
- −$319
- Net cashflow
- $635
Break-even live
Sensitivity live
| Price | -10% $675 | -5% $655 | +0% $635 | +5% $615 | +10% $595 |
|---|---|---|---|---|---|
| Rent | -10% $515 | -5% $575 | +0% $635 | +5% $695 | +10% $755 |
| Rate | -1.0pp $670 | -0.5pp $653 | base $635 | +0.5pp $617 | +1.0pp $599 |
UW: 25.0% down · 7.5% · 30yr · 1.5% tax · 5.0% vac · 8.0% maint · 8.0% mgmt
Financing live
Cash to close
- Down payment
- $17,500
- Closing costs
- $2,100
- Reserves months
- —
- Total cash needed
- —
Loan-product check · same deal, 3 products live
Conventional
25% down · 7.5% · 30yr
- Down + closing
- —
- Monthly P&I
- —
- Monthly cashflow
- —
- DSCR
- —
- Eligible?
- —
Personal DTI + credit; lowest rate.
DSCR
20% down · 8.5% · 30yr
- Down + closing
- —
- Monthly P&I
- —
- Monthly cashflow
- —
- DSCR
- —
- Eligible?
- —
No personal income docs; deal must DSCR.
Hard money
10% down · 12.0% · 12mo
- Down + closing
- —
- Monthly P&I
- —
- Monthly cashflow
- —
- DSCR
- —
- Eligible?
- —
Short-term bridge; refi at stabilization.
Rent comps 1 comps
| Address | Beds | Baths | Sqft | Rent | $/sqft | DOM | Units | Dist |
|---|---|---|---|---|---|---|---|---|
| 4070 Green Isle Way Saginaw, MI | 1.0–3.0 | 1.0–1.5 | 950 | $1,350 | $1.42 | 44d | 15 | 1.09mi |
Listing history 9 events
-
2026-05-05status Pending 630-char remark
Show marketing remark (636 chars)
HIGHEST AND BEST DUE WEDNESDAY 4/29/2026 @ 12 NOON. Welcome to this 3-bedroom, 2 full bath home full of potential and opportunity! Featuring wood floors, a functional layout, and a 1-car attached garage, this property offers a solid foundation for your vision. Enjoy the convenience of a fenced-in backyard—perfect for pets, entertaining, or relaxing outdoors. Located in a convenient location close to everyday amenities, this home is ideal for buyers looking to add their personal touch. With a little TLC, this property could truly shine. Call today to schedule your personal showing! SELLER WILL NOT REVIEW OFFERS FOR 10 DAYS!
-
2026-05-05status Pending 636-char remark
Show marketing remark (636 chars)
HIGHEST AND BEST DUE WEDNESDAY 4/29/2026 @ 12 NOON. Welcome to this 3-bedroom, 2 full bath home full of potential and opportunity! Featuring wood floors, a functional layout, and a 1-car attached garage, this property offers a solid foundation for your vision. Enjoy the convenience of a fenced-in backyard—perfect for pets, entertaining, or relaxing outdoors. Located in a convenient location close to everyday amenities, this home is ideal for buyers looking to add their personal touch. With a little TLC, this property could truly shine. Call today to schedule your personal showing! SELLER WILL NOT REVIEW OFFERS FOR 10 DAYS!
-
2026-04-16$70,000 Active 630-char remark
Show marketing remark (630 chars)
HIGHEST AND BEST DUE WEDNESDAY 4/29/2026 @ 12 NOON. Welcome to this 3-bedroom, 2 full bath home full of potential and opportunity! Featuring wood floors, a functional layout, and a 1-car attached garage, this property offers a solid foundation for your vision. Enjoy the convenience of a fenced-in backyard-perfect for pets, entertaining, or relaxing outdoors. Located in a convenient location close to everyday amenities, this home is ideal for buyers looking to add their personal touch. With a little TLC, this property could truly shine. Call today to schedule your personal showing! SELLER WILL NOT REVIEW OFFERS FOR 10 DAYS!
-
2026-04-15$70,000 Active 636-char remark
Show marketing remark (636 chars)
HIGHEST AND BEST DUE WEDNESDAY 4/29/2026 @ 12 NOON. Welcome to this 3-bedroom, 2 full bath home full of potential and opportunity! Featuring wood floors, a functional layout, and a 1-car attached garage, this property offers a solid foundation for your vision. Enjoy the convenience of a fenced-in backyard—perfect for pets, entertaining, or relaxing outdoors. Located in a convenient location close to everyday amenities, this home is ideal for buyers looking to add their personal touch. With a little TLC, this property could truly shine. Call today to schedule your personal showing! SELLER WILL NOT REVIEW OFFERS FOR 10 DAYS!
-
2001-08-06soldstatus $77,000
-
2001-06-27soldstatus $77,000
-
2001-06-27soldstatus $77,000
-
2001-04-09$79,900
-
2001-04-09$79,900
ⓘ Source: listings_history table (triggers on properties + properties_extension) + one-shot
backfill from property_details.listing_events for pre-trigger history.
Tax reassessment forecast MI · Partial reset (capped growth)
- Current annual tax
- $2,040 · $170/mo
- Projected year-2 tax
- $2,040 · $170/mo
- Expected delta
- $0/yr ($0/mo · 0.0%)
ⓘ Screening estimate from a state-policy table — verify with the county assessor before closing.
Climate risk First Street
- Flood 1/10 Low FEMA zone X (unshaded) · 0% chance over 30 yrs
- Wildfire 1/10 Low
- Heat 2/10 Low 7 d/yr ≥99°F today · 14 d/yr by 30 yrs out
- Wind 1/10 Low
- Air quality 2/10 Low 1 unhealthy d/yr today · 1 by 30 yrs out
Nearby sold comps map
Loading sold comps map…
Walkable amenities ~0.75 mi
Loading nearby amenities…
Taxation est. · year 1
- Rental income
- $18,249
- − Mortgage interest
- −$3,921
- − Property taxes
- −$2,040
- − Insurance
- −$350
- − Repairs & maintenance
- −$1,460
- − Management
- −$1,460
- − Depreciation
- −$2,036
- Taxable income
- $6,981
- Est. tax owed @ 24.0%
- −$1,676
- After-tax cash flow
- $5,946/yr
For passive investors: Depreciation is non-cash, so a rental often shows a tax loss while cash-flowing — sheltering income. Rental losses are passive: they offset passive income freely, and up to $25,000/yr can offset ordinary (W-2) income if you actively participate and your MAGI is under $100k (phasing out to $0 by $150k); unused losses carry forward. On sale, claimed depreciation is recaptured at up to 25%, and gains may owe capital-gains tax (a 1031 exchange can defer both). Figures are a year-1 estimate at your 24.0% rate — not tax advice; consult a CPA.
Schools (NCES district)
- District
- Saginaw Township Community Schools
- NCES district ID
- 2630450
- Math proficiency
- 27% ▼ -9.00%
- Reading proficiency
- 45% ▼ -4.00%
- Median HH income
- $48,971
- Composite
- 31.01/100
- National rank
- #6094
- State rank
- #265 of 540 in MI
Livability — Saginaw
- Score
- 63/100
- State rank
- #521
- US rank
- #15424
Category grades
Schools grade is shown separately in the Schools card above.
Census & demographics
- County
- Saginaw County · 54,884 people
- City population
- 54,884
- Metro
- Saginaw, MI
- Population (ZIP)
- 27,757
- Household income
- $66,352
- Rent vs Own
- Severe rent burden
- 1106.0
Population outlook (Saginaw County) Hauer SSP2
- Today (2025)
- 180,568 people
- By 2030
- 172,302 · -4.6%
- By 2040
- 153,919 · -14.8%
- By 2050
- 135,519 · -24.9%
- By 2075
- 97,199 · -46.2%
- By 2100
- 65,037 · -64.0%
Race, ethnicity, and origin ACS 2023
- Neighborhood character
- Predominantly White (70%)
- Race & ethnicity
- White 70% Black 12% Hispanic / Latino 10% Asian 5% Two or more races 5%
- Hispanic origin (detail)
- Mexican 8%
- Common ancestry
- Romanian 8% Lithuanian 7% Slovak 3%
- Foreign-born
- 6% · Canada, China
- Languages at home
- 93% English-only · Other Indo-European 3% Spanish 2% Other Asian/Pacific 1%
Political lean MEDSL · Saginaw
- 2024 margin
- Toss-up / Even · D 47.7% · R 51.0% · Other 1.4%
- 2008→2024 swing
- -20.6pp toward R · 2008: 17.3pp · 2024: -3.3pp
- All cycles
- 2024: R+3.3 2020: D+0.3 2016: R+1.1 2012: D+11.9 2008: D+17.3
Not yet ingested
- Civics
- —
Market trends
- HPI YoY
- ▼ -103.35%
- Current HPI
- 152.7507
- Rent YoY
- ▲ 7.71%
- Metro
- Saginaw, MI
- State GDP YoY
- ▲ 1.37%
- F500 in state
- 28
Industry mix (Fortune 500 HQ in MI)
| Industry | F500 HQs | Revenue |
|---|---|---|
| Automotive Parts | 3 | $48B |
|
||
| Automotive | 2 | $372B |
|
||
| Chemicals | 1 | $45B |
|
||
| Automotive Retail | 1 | $29B |
|
||
| Healthcare / Medical Devices | 1 | $23B |
|
||
| Automotive Technology | 1 | $20B |
|
||
Price history
-12.4% since first listed9 events — show timeline
- 2026-05-05 Pending — REALCOMP
- 2026-05-05 Pending — MiRealSource-MiMLS
- 2026-04-16 Listed $70,000 REALCOMP
- 2026-04-15 Listed $70,000 MiRealSource-MiMLS
- 2001-08-06 Sold (Public Records) $77,000 Public Records
- 2001-06-27 Sold (MLS) $77,000 MiRealSource-MiMLS
- 2001-06-27 Sold (MLS) $77,000 REALCOMP
- 2001-04-09 Listed $79,900 MiRealSource-MiMLS
- 2001-04-09 Listed $79,900 REALCOMP
Property tax history
+3.6%/yrLatest (2025): $2,040 · -33.3% YoY. Source: county tax records.
Cash-flow waterfall
monthlySold comps — $/sqft
last 12 mo · ≤1 miLoading sold comps…