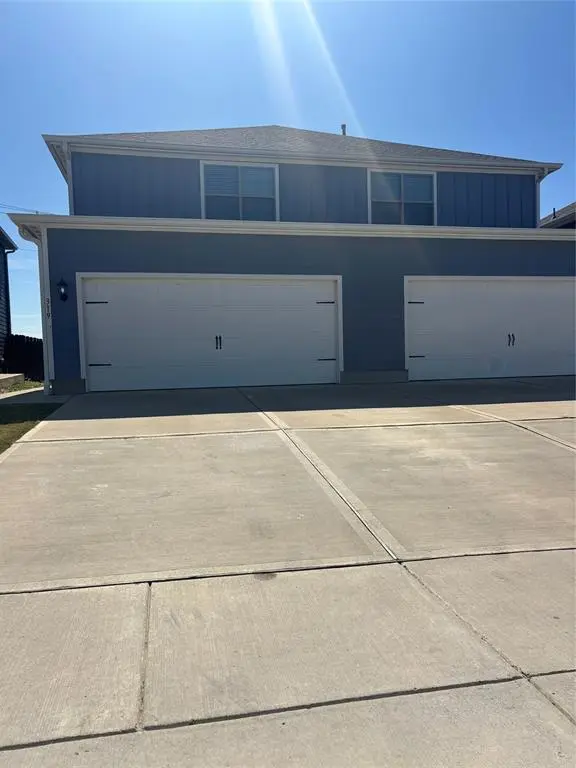
319 Stone Ct · Princeton, TX
Flood risk 1/10 · Minimal
- FEMA flood zone
- X (unshaded)
- Chance of flooding over 30 yrs
- 0.0%
- Est. flood insurance / yr
- $507 – $1,088
Fire risk 5/10 · Moderate
- Est. fire insurance / yr
- $1,222 – $2,270
Heat risk 7/10 · Major
- Hot days now (above 110°F)
- 7 days/yr
- Hot days in 30 yrs
- 23 days/yr
Wind risk 6/10 · Moderate
- Chance of severe wind over 30 yrs
- 27.0%
Air-quality risk 3/10 · Minor
- Unhealthy air days now
- 3 days/yr
- Unhealthy air days in 30 yrs
- 3 days/yr
Risk factors via First Street. Map © Google.
Why this score? — see what drove the C- grade
The composite is a weighted blend of 9 inputs, each scored 0–100. Each bar is that input's sub-score; the figure is the points it added to the 100-point composite (weight × sub-score).
- ARV discount +15.0/15.0
- Cash flow +14.9/30.0
- 1% rule +5.2/10.0
- DSCR +4.5/10.0
- Schools +4.2/10.0
- Condition / age +4.0/5.0
- Livability +3.1/5.0
- Rent growth +2.2/5.0
- Appreciation +0.0/10.0
$200,000
🖨 Deal sheet 📄 Offer letter ✓ Due diligence
Listing remarks MLS
Great opportunity for buyers or investors. This townhome features 1,543 square feet with 3 bedrooms, 2 bathrooms, one living area, and a dining area. The kitchen includes granite countertops and plenty of cabinet space and opens to the living area for an easy flow. The layout makes good use of the space and the size is manageable for homeowners. Located in the growing community of Princeton with convenient access to nearby shopping, dining, and major roads. It could be a good option for investors looking to add a rental property to their portfolio or buyers looking for an affordable home in a fast growing area.
Key facts
- Granite countertops
- $60 HOA
- 2 garage spots
Tags
Neighborhood map
What this means for you Summary
Snapshot
- This is a 3-bed/2.5-bath townhouse listed at $200k. Condition is rated good.
Deal economics
- At list price, monthly cash flow is $57 ($689/yr) — positive.
- The deal already cash-flows at list — no discount required.
- Meets the 1% rule at list price ($2k rent vs $200k).
- Recommended offer: $182k (9.0% below list) — sets the bar for market timing.
- Cap rate 6.6% vs local median 4.5% in Princeton — top-decile yield for the area; either an underpriced asset or a hidden risk that comps aren't pricing in. Stress-test before assuming the spread holds.
Location & tenants
- Location reads 62/100 on livability (#969 in TX) — a middle-class / working-renter tenant base. Strengths: employment A+, housing A+, cost of living A; Watch: schools C-, amenities F, commute F.
- Princeton ISD (suburban): math 51% / reading 47% proficiency, ranked #188 of 826 in TX (top 23%) — families likely to look elsewhere, expect single-tenant / working-renter base with shorter leases.
- Market conditions: Rents soft (-1.0%/yr); 1404 active listings in the ZIP; 40 comparable units currently listed for rent nearby; rentals at typical pace (median 24d on market — plan ~3-4 weeks tenant-placement turnaround); solid renter incomes; 19,194 units permitted in Collin County in 2024 (3,988 in 5+ unit buildings).
Forward outlook
- Local home prices are declining (-3.0%/yr); year-one equity from $1k of loan paydown is wiped out by about $6k of value loss. Plan a longer hold.
- Collin County population projected at +60% by 2050 — long-run rental-demand tailwind backs the buy-and-hold thesis.
Negotiation context
- It's been on market 101 days — a 9% lower offer ($182k) is reasonable based on typical stale-listing flexibility.
- 3 sale attempts since 4y ago with the ask held roughly flat each time — persistent listings suggest the price (not the market) is what's stuck; bring a comps-based counter.
Risks & watch-outs
- Climate carrying-cost: major wind risk, 27% chance of damaging wind over 30y; moderate wildfire risk; extreme-heat days projected 7→23/yr by 2055 (HVAC capex compounding) — expect insurance premiums to compound above CPI over the hold.
Questions for the listing agent
- It's been on market 101 days. Have you received any prior offers? Is the seller open to a 9% concession, seller financing, or rate buy-down credit?
- What does the HOA fee cover, when was the last increase, and are there any pending special assessments or reserve-fund shortfalls?
- Why hasn't it sold? Are there any deal-killer items the seller is aware of (foundation, flood, title, zoning, code violations)?
- Is there a deadline driving the sale (1031 exchange, divorce, estate, relocation)? That informs how much negotiation room exists.
- What's the average days-on-market for RENTAL listings here right now (not sales)? A rising rental-DOM trend means longer vacancies and softer asking-rent achievability than the comps imply.
- What's the recent tenant-quality profile in this submarket — average credit score on applications, eviction rate, late-payment / NSF rate, and stable-employment percentage? A property-management company in the area should have these aggregated.
- How much new for-sale + rental construction is in the pipeline within 1–3 miles? Heavy new supply typically softens prices + rents 12–24 months out; constrained supply supports both.
Investment metrics
- 1% rule
- 1.02% ✓
- Cap rate
- 6.64%
- Cash-on-cash
- 1.23%
- DSCR
- 1.05
- GRM
- 8.2
CMA / ARV
- ARV (median comp)
- $290,100
- List price
- $200,000
- Delta
- -31.06%
- Verdict
- UNDERPRICED
- Comps
- 20 within 1.0 mi
Show comp detail 6 sales within ~0.75 mi
| Address | Dist | Beds/Ba | Sqft | Sold | Price | $/sf | Match |
|---|---|---|---|---|---|---|---|
| 320 Marsh Ln | 0.15mi | 3/2.5 | 1,543 (0%) | 16mo | $248,900 | $161 | 80 |
| 209 Marsh Ln | 0.15mi | 3/2.5 | 1,573 (+2%) | 22mo | $300,900 | $191 | 72 |
| 207 Marsh Ln | 0.15mi | 3/2.5 | 1,573 (+2%) | 22mo | $300,900 | $191 | 71 |
| 203 Marsh Ln | 0.15mi | 3/2.5 | 1,586 (+3%) | 23mo | $310,900 | $196 | 69 |
| 321 Marsh Ln | 0.12mi | 4/2.5 (+1) | 1,772 (+15%) | 23mo | $315,900 | $178 | 46 |
| 319 Marsh Ln | 0.12mi | 4/2.5 (+1) | 1,772 (+15%) | 24mo | $322,900 | $182 | 45 |
Match score weights: distance 35% · size 25% · config 20% · recency 20%. Top-matched comps best support the ARV.
Projected returns pro-forma
-3.0% appreciation · 0.0% rent growth · sell at horizon
- IRR
- -18.1%
- Equity multiple
- 0.38×
- Total profit
- $-34,600
- Equity at exit
- $29,821
- IRR
- -18.8%
- Equity multiple
- 0.14×
- Total profit
- $-47,997
- Equity at exit
- $17,292
Cash invested: $56,000 (down + closing). Projections, not guarantees.
Landlord ↔ Tenant lean methodology
- Overall (STATE)
- 87 Strongly Landlord-Friendly
- State Texas
- 87 Strongly Landlord-Friendly · R+5
- County
- — inherits STATE
- City
- — inherits STATE
ZIP-level market 75407
- Home prices YoY
- -30.3%
- Rents YoY
- -1.0%
- Active inventory
- 1404
- Price-to-rent
- 8.2×
Monthly cashflow live
- Estimated rent
- $2,043 high interval (Pro) →
- Mortgage (P&I)
- −$1,049
- Tax from tax record
- −$364 /mo · $4,372/yr
- Insurance
- −$83
- HOA
- −$60
- Vacancy / Maint / Mgmt
- −$429
- Net cashflow
- $57
Break-even live
UW: 25.0% down · 7.5% · 30yr · 1.5% tax · 5.0% vac · 8.0% maint · 8.0% mgmt
Financing live
Cash to close
- Down payment
- $50,000
- Closing costs
- $6,000
- Reserves months
- —
- Total cash needed
- —
Loan-product check · same deal, 3 products live
Conventional
25% down · 7.5% · 30yr
- Down + closing
- —
- Monthly P&I
- —
- Monthly cashflow
- —
- DSCR
- —
- Eligible?
- —
Personal DTI + credit; lowest rate.
DSCR
20% down · 8.5% · 30yr
- Down + closing
- —
- Monthly P&I
- —
- Monthly cashflow
- —
- DSCR
- —
- Eligible?
- —
No personal income docs; deal must DSCR.
Hard money
10% down · 12.0% · 12mo
- Down + closing
- —
- Monthly P&I
- —
- Monthly cashflow
- —
- DSCR
- —
- Eligible?
- —
Short-term bridge; refi at stabilization.
Rent comps 40 comps
| Address | Beds | Baths | Sqft | Rent | $/sqft | DOM | Units | Dist |
|---|---|---|---|---|---|---|---|---|
| 315 Stone Ct Princeton, TX | 3.0 | 2.5 | 1573 | $2,100 | $1.34 | 43d | 1 | 0.03mi |
| 303 Stone Ct Princeton, TX | 3.0 | 2.5 | 1586 | $1,700 | $1.07 | 24d | 1 | 0.05mi |
| 229 Marsh Ln Princeton, TX | 3.0 | 2.5 | 1550 | $1,650 | $1.06 | 24d | 1 | 0.10mi |
| 1525 Farm to Market Road 982 Princeton, TX | 2.0–4.0 | 2.0–2.5 | 1551 | $2,332 | $1.50 | 1d | 54 | 0.14mi |
| 203 Marsh Ln Princeton, TX | 3.0 | 2.5 | 1586 | $1,575 | $0.99 | 7d | 1 | 0.14mi |
| 220 Marsh Ln Princeton, TX | 4.0 | 2.5 | 1722 | $1,785 | $1.04 | 5d | 1 | 0.15mi |
| 204 Marsh Ln Princeton, TX | 4.0 | 2.5 | 1722 | $1,700 | $0.99 | 43d | 1 | 0.17mi |
| 445 Grenada Lake Dr Princeton, TX | 4.0 | 3.0 | 2029 | $2,050 | $1.01 | 5d | 1 | 0.37mi |
| 605 Grenada Lake Dr Princeton, TX | 3.0 | 2.0 | 1563 | $1,925 | $1.23 | 15d | 1 | 0.40mi |
| 865 Table Rock St Princeton, TX | 3.0 | 2.0 | 1563 | $2,050 | $1.31 | 22d | 1 | 0.42mi |
| 882 Breakwater Dr Princeton, TX | 4.0 | 2.5 | 1824 | $2,250 | $1.23 | 22d | 1 | 0.43mi |
| 843 Ozark Path Princeton, TX | 3.0 | 2.0 | 1249 | $2,100 | $1.68 | 43d | 1 | 0.44mi |
| 818 Table Rock St Princeton, TX | 4.0 | 3.0 | 2029 | $2,349 | $1.16 | 1d | 1 | 0.47mi |
| 846 Breakwater Dr Princeton, TX | 3.0 | 2.5 | 1824 | $2,000 | $1.10 | 2d | 1 | 0.48mi |
| 814 Lake Fletcher Rd Princeton, TX | 4.0 | 2.5 | 1991 | $1,994 | $1.00 | 3d | 1 | 0.49mi |
| 814 Lake Fletcher Rd Princeton, TX | 4.0 | 3.0 | 1921 | $1,994 | $1.04 | 4d | 1 | 0.49mi |
| 803 Table Rock St Princeton, TX | 4.0 | 2.5 | 1683 | $1,850 | $1.10 | 43d | 1 | 0.50mi |
| 366 Lake Erie Dr Princeton, TX | 4.0 | 2.5 | 1824 | $1,990 | $1.09 | 24d | 1 | 0.51mi |
| 1501 Hidden Bluff Xing Princeton, TX | 4.0 | 2.0 | 1794 | $2,200 | $1.23 | 12d | 1 | 0.67mi |
| 408 Stampede Ln Princeton, TX | 4.0 | 2.0 | 1794 | $1,925 | $1.07 | 43d | 1 | 0.73mi |
| 412 Gunsmoke Trl Princeton, TX | 4.0 | 3.0 | 2193 | $2,000 | $0.91 | 43d | 1 | 0.74mi |
| 503 Willow View Way Princeton, TX | 4.0 | 2.0 | 2014 | $2,149 | $1.07 | 7d | 1 | 0.77mi |
| 507 Saddle Club Way Princeton, TX | 4.0 | 2.0 | 2014 | $2,090 | $1.04 | 12d | 1 | 0.78mi |
| 420 Gunsmoke Trl Princeton, TX | 4.0 | 2.0 | 1865 | $1,975 | $1.06 | 7d | 1 | 0.78mi |
| 513 Spur Rdg Princeton, TX | 3.0 | 2.0 | 1622 | $2,200 | $1.36 | 17d | 1 | 0.83mi |
| 603 Smokey Trl Princeton, TX | 3.0 | 2.0 | 1622 | $2,100 | $1.29 | 18d | 1 | 0.88mi |
| 604 Saddle Club Way Princeton, TX | 4.0 | 2.0 | 1592 | $2,050 | $1.29 | 43d | 1 | 0.89mi |
| 611 Saddle Club Way Princeton, TX | 4.0 | 2.0 | 1828 | $2,100 | $1.15 | 43d | 1 | 0.92mi |
| 603 Calm Springs Dr Princeton, TX | 4.0 | 2.0 | 2039 | $2,250 | $1.10 | 11d | 1 | 0.94mi |
| 468 Pebble Brook Ln Princeton, TX | 4.0 | 3.0 | 2174 | $2,250 | $1.03 | 12d | 1 | 0.94mi |
| 622 Saxony Dr Princeton, TX | 3.0 | 2.0 | 1567 | $2,000 | $1.28 | 43d | 1 | 0.96mi |
| 663 Saxony Dr Princeton, TX | 4.0 | 2.0 | 2209 | $2,250 | $1.02 | 24d | 1 | 0.96mi |
| 663 Saxony Dr Princeton, TX | 4.0 | 2.0 | 2209 | $2,100 | $0.95 | 43d | 1 | 0.96mi |
| 649 Saxony Dr Princeton, TX | 4.0 | 2.0 | 1674 | $2,100 | $1.25 | 12d | 1 | 0.97mi |
| 627 Willow View Way Princeton, TX | 4.0 | 2.0 | 1664 | $2,000 | $1.20 | 43d | 1 | 0.98mi |
| 226 Griffith Dr Princeton, TX | 3.0 | 2.5 | 1339 | $1,675 | $1.25 | 24d | 1 | 1.03mi |
| 717 Rawhide Way Princeton, TX | 4.0 | 3.0 | 2193 | $2,500 | $1.14 | 43d | 1 | 1.05mi |
| 461 Princewood Dr Princeton, TX | 3.0 | 2.0 | 1749 | $1,750 | $1.00 | 24d | 1 | 1.07mi |
| 720 Willow View Way Princeton, TX | 4.0 | 2.0 | 2013 | $2,250 | $1.12 | 24d | 1 | 1.08mi |
| 414 E Hazelwood St Princeton, TX | 3.0 | 2.0 | 1328 | $1,595 | $1.20 | 24d | 1 | 1.10mi |
HOA detail
- Monthly dues
- $60 · $720/yr
Listing history 21 events
-
2026-06-18days on market $200,000 Active 101 DOM
-
2026-06-17days on market $200,000 Active 100 DOM
-
2026-06-16days on market $200,000 Active 99 DOM
-
2026-06-15days on market $200,000 Active 98 DOM
-
2026-06-13days on market $200,000 Active 96 DOM
-
2026-06-13days on market $200,000 Active 95 DOM
-
2026-06-09days on market $200,000 Active 92 DOM
-
2026-06-08days on market $200,000 Active 91 DOM
-
2026-06-07days on market $200,000 Active 90 DOM
-
2026-06-04days on market $200,000 Active 87 DOM
-
2026-06-03days on market $200,000 Active 86 DOM
-
2026-06-02days on market $200,000 Active 85 DOM
-
2026-06-01days on market $200,000 Active 84 DOM
-
2026-05-31days on market $200,000 Active 83 DOM
-
2026-05-19price $200,000 619-char remark
Show marketing remark (619 chars)
Great opportunity for buyers or investors. This townhome features 1,543 square feet with 3 bedrooms, 2 bathrooms, one living area, and a dining area. The kitchen includes granite countertops and plenty of cabinet space and opens to the living area for an easy flow. The layout makes good use of the space and the size is manageable for homeowners. Located in the growing community of Princeton with convenient access to nearby shopping, dining, and major roads. It could be a good option for investors looking to add a rental property to their portfolio or buyers looking for an affordable home in a fast growing area.
-
2026-03-09$205,000 Active 619-char remark
Show marketing remark (619 chars)
Great opportunity for buyers or investors. This townhome features 1,543 square feet with 3 bedrooms, 2 bathrooms, one living area, and a dining area. The kitchen includes granite countertops and plenty of cabinet space and opens to the living area for an easy flow. The layout makes good use of the space and the size is manageable for homeowners. Located in the growing community of Princeton with convenient access to nearby shopping, dining, and major roads. It could be a good option for investors looking to add a rental property to their portfolio or buyers looking for an affordable home in a fast growing area.
-
2022-08-18soldstatus Closed 676-char remark
Show marketing remark (676 chars)
This gorgeous two-story townhome at South Park Meadows is the perfect combination of the space you desire and the upgrades you love! On the main floor, enjoy an incredible, open layout with a large family room, dining room and an upgraded, chef-inspired kitchen. The kitchen comes equipped with a full suite of stainless steel Whirlpool brand appliances, granite countertops and an abundance of cabinet storage. All the bedrooms in this home are located on the second floor and include a walk-in closet. A covered back patio, professionally landscaped front yard and an attached two-car garage add to the appeal of this exceptional new construction home at South Park Meadows.
-
2022-07-26status Pending 676-char remark
Show marketing remark (676 chars)
This gorgeous two-story townhome at South Park Meadows is the perfect combination of the space you desire and the upgrades you love! On the main floor, enjoy an incredible, open layout with a large family room, dining room and an upgraded, chef-inspired kitchen. The kitchen comes equipped with a full suite of stainless steel Whirlpool brand appliances, granite countertops and an abundance of cabinet storage. All the bedrooms in this home are located on the second floor and include a walk-in closet. A covered back patio, professionally landscaped front yard and an attached two-car garage add to the appeal of this exceptional new construction home at South Park Meadows.
-
2022-07-01$354,900 Active 676-char remark
Show marketing remark (676 chars)
This gorgeous two-story townhome at South Park Meadows is the perfect combination of the space you desire and the upgrades you love! On the main floor, enjoy an incredible, open layout with a large family room, dining room and an upgraded, chef-inspired kitchen. The kitchen comes equipped with a full suite of stainless steel Whirlpool brand appliances, granite countertops and an abundance of cabinet storage. All the bedrooms in this home are located on the second floor and include a walk-in closet. A covered back patio, professionally landscaped front yard and an attached two-car garage add to the appeal of this exceptional new construction home at South Park Meadows.
-
2022-06-30historical
-
2022-05-13$376,900 Active
ⓘ Source: listings_history table (triggers on properties + properties_extension) + one-shot
backfill from property_details.listing_events for pre-trigger history.
Tax reassessment forecast TX · Resets to sale price
- Current annual tax
- $4,372 · $364/mo
- Projected year-2 tax
- $4,372 · $364/mo
- Expected delta
- $0/yr ($0/mo · 0.0%)
ⓘ Screening estimate from a state-policy table — verify with the county assessor before closing.
Climate risk First Street
- Flood 1/10 Low FEMA zone X (unshaded) · 0% chance over 30 yrs
- Wildfire 5/10 Major
- Heat 7/10 Severe 7 d/yr ≥110°F today · 23 d/yr by 30 yrs out
- Wind 6/10 Major 27% chance of damaging wind over 30 yrs
- Air quality 3/10 Moderate 3 unhealthy d/yr today · 3 by 30 yrs out
Nearby sold comps map
Loading sold comps map…
Walkable amenities ~0.75 mi
Loading nearby amenities…
Taxation est. · year 1
- Rental income
- $24,514
- − Mortgage interest
- −$11,203
- − Property taxes
- −$4,372
- − Insurance
- −$1,000
- − Repairs & maintenance
- −$1,961
- − Management
- −$1,961
- − HOA
- −$720
- − Depreciation
- −$5,818
- Taxable loss
- −$2,521
- Est. tax savings @ 24.0%
- +$605
- After-tax cash flow
- $1,294/yr
For passive investors: Depreciation is non-cash, so a rental often shows a tax loss while cash-flowing — sheltering income. Rental losses are passive: they offset passive income freely, and up to $25,000/yr can offset ordinary (W-2) income if you actively participate and your MAGI is under $100k (phasing out to $0 by $150k); unused losses carry forward. On sale, claimed depreciation is recaptured at up to 25%, and gains may owe capital-gains tax (a 1031 exchange can defer both). Figures are a year-1 estimate at your 24.0% rate — not tax advice; consult a CPA.
Condition & rehab AI · 12 photos
This well-maintained townhome is in good condition with a good condition score of 80. It has a good layout and is located in a growing community. It would benefit from some cosmetic updates to the interior walls and flooring to further increase its value.
Value-add opportunities
- Both Painting the interior walls — Fresh paint can make a significant difference in the home's appearance and value
- Both Updating the flooring in the bathrooms — Replacing old tiles with modern options can enhance both resale and rental appeal
- Both Adding smart home features — Modern technology can increase the home's appeal and value
- Both Upgrading the kitchen appliances — Newer, more energy-efficient appliances can improve the home's value and energy efficiency
Renovation cost estimate screening
Value-add ROI direction
- Both Painting the interior walls — Fresh paint can make a significant difference in the home's appearance and value ↑
- Both Updating the flooring in the bathrooms — Replacing old tiles with modern options can enhance both resale and rental appeal ↑
- Both Adding smart home features — Modern technology can increase the home's appeal and value ↑
- Both Upgrading the kitchen appliances — Newer, more energy-efficient appliances can improve the home's value and energy efficiency ↑
ⓘ Cost ranges are severity-bucket heuristics (US national rule-of-thumb). Get contractor quotes + a written scope before underwriting a rehab budget.
Schools (NCES district)
- District
- Princeton ISD
- NCES district ID
- 4835850
- Math proficiency
- 51% ▼ -8.00%
- Reading proficiency
- 47% ▬ 0.00%
- Median HH income
- $54,827
- Composite
- 42.44/100
- National rank
- #3226
- State rank
- #188 of 826 in TX
Livability — Princeton
- Score
- 62/100
- State rank
- #969
- US rank
- #17215
Category grades
Schools grade is shown separately in the Schools card above.
Census & demographics
- Census place
- Princeton, TX
- County
- Collin County · 1,159,394 people
- City population
- 34,171
- Metro
- Dallas-Fort Worth-Arlington, TX
- Population (ZIP)
- 34,171
- Household income
- $100,037
- Rent vs Own
- Severe rent burden
- 368.0
Population outlook (Collin County) Hauer SSP2
- Today (2025)
- 1,210,074 people
- By 2030
- 1,358,201 · +12.2%
- By 2040
- 1,654,061 · +36.7%
- By 2050
- 1,937,359 · +60.1%
- By 2075
- 2,567,039 · +112.1%
- By 2100
- 2,952,048 · +144.0%
Race, ethnicity, and origin ACS 2023
- Neighborhood character
- Diverse neighborhood (Simpson 0.66)
- Race & ethnicity
- White 47% Hispanic / Latino 30% Black 17% Two or more races 10% Asian 4% Native American 1%
- Hispanic origin (detail)
- Mexican 26%
- Common ancestry
- Lithuanian 2% Romanian 1% Russian 1%
- Foreign-born
- 15% · Canada, China, Mexico
- Languages at home
- 70% English-only · Spanish 22% Other Indo-European 2% Other Asian/Pacific 1%
Political lean MEDSL · Collin
- 2024 margin
- R (+11.1) · D 43.1% · R 54.3% · Other 2.6%
- 2008→2024 swing
- +14.4pp toward D · 2008: -25.6pp · 2024: -11.1pp
- All cycles
- 2024: R+11.1 2020: R+4.3 2016: R+17.0 2012: R+31.6 2008: R+25.6
Not yet ingested
- Civics
- —
Market trends
- HPI YoY
- ▼ -103.99%
- Current HPI
- 238.9373
- Rent YoY
- ▼ -1.02%
- Metro
- Dallas-Fort Worth-Arlington, TX
- State GDP YoY
- ▲ 3.95%
- F500 in state
- 110
Industry mix (Fortune 500 HQ in TX)
| Industry | F500 HQs | Revenue |
|---|---|---|
| Energy | 16 | $1,198B |
|
||
| Technology | 5 | $198B |
|
||
| Engineering / Construction | 4 | $72B |
|
||
| Energy Services | 3 | $60B |
|
||
| Utilities | 3 | $41B |
|
||
| Healthcare | 2 | $330B |
|
||
Price history
-46.9% since first listed7 events — show timeline
- 2026-05-19 Price Changed $200,000 NTREIS
- 2026-03-09 Listed $205,000 NTREIS
- 2022-08-18 Sold (MLS) — NTREIS
- 2022-07-26 Pending — NTREIS
- 2022-07-01 Listed $354,900 NTREIS
- 2022-06-30 Listing Removed — NTREIS
- 2022-05-13 Listed $376,900 NTREIS
Property tax history
+102.3%/yrLatest (2025): $4,372 · -1.6% YoY. Source: county tax records.
Cash-flow waterfall
monthlySold comps — $/sqft
last 12 mo · ≤1 miLoading sold comps…