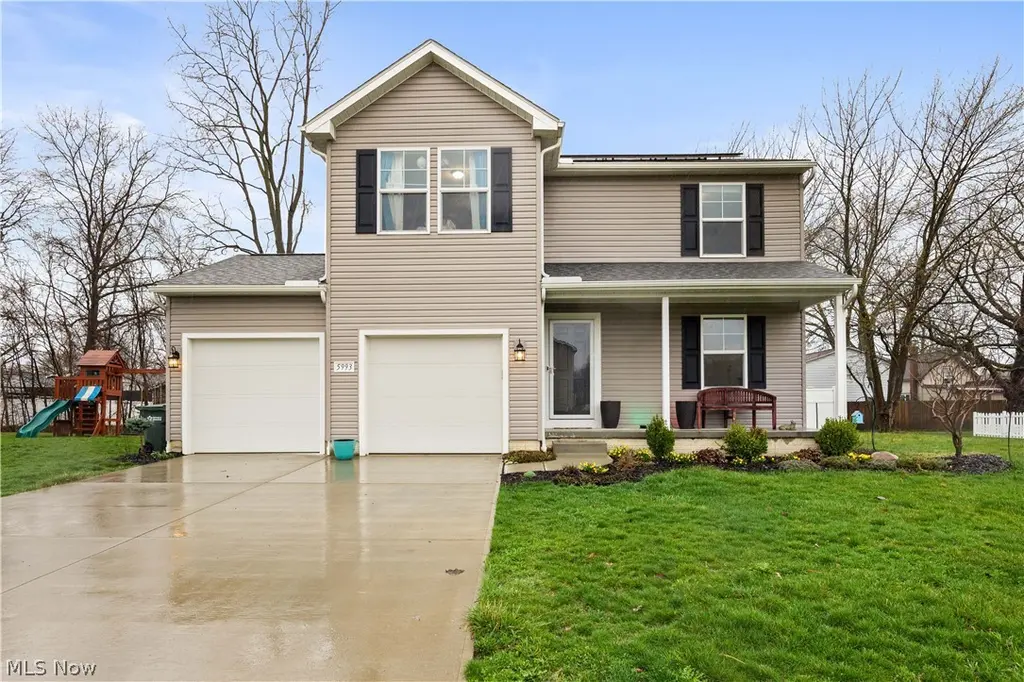
5993 Montauk Pt · Vermilion, OH
Flood risk 1/10 · Minimal
- FEMA flood zone
- X (unshaded)
- Chance of flooding over 30 yrs
- 0.0%
- Est. flood insurance / yr
- $473 – $860
Fire risk 1/10 · Minimal
- Est. fire insurance / yr
- $713 – $1,323
Heat risk 3/10 · Minor
- Hot days now (above 96°F)
- 7 days/yr
- Hot days in 30 yrs
- 17 days/yr
Wind risk 2/10 · Minimal
- Chance of severe wind over 30 yrs
- —
Air-quality risk 2/10 · Minimal
- Unhealthy air days now
- 1 days/yr
- Unhealthy air days in 30 yrs
- 3 days/yr
Risk factors via First Street. Map © Google.
Why this score? — see what drove the B grade
The composite is a weighted blend of 9 inputs, each scored 0–100. Each bar is that input's sub-score; the figure is the points it added to the 100-point composite (weight × sub-score).
- Cash flow +30.0/30.0
- 1% rule +10.0/10.0
- DSCR +10.0/10.0
- ARV discount +7.2/15.0
- Schools +5.0/10.0
- Livability +4.0/5.0
- Rent growth +2.5/5.0
- Condition / age +2.5/5.0
- Appreciation +0.0/10.0
$323,000
🖨 Deal sheet 📄 Offer letter ✓ Due diligence
Listing remarks MLS
Stunning 4 bed, 2.5 bath home in Lighthouse Estates! Built in 2021 and loaded with updates: Samsung stove (2023), pergola & patio (2023), partially finished basement (2025), solar panels (2024), custom wall panels, kitchen backsplash, garage/laundry shelving & more. Private fenced backyard—perfect for entertaining. Move-in ready with modern style and energy efficiency. Walking distance to the beach, shopping, and dining. Home includes fully installed solar panel system — enjoy clean, renewable energy and major long-term savings! Average monthly electric bills drop significantly with solar, especially in summer months. Fixed solar loan payment of $199/month locks in energy savings while utility rates rise.
Key facts
- Pergola
- Custom wall panels
- Patio
Tags
Neighborhood map
What this means for you Summary
Snapshot
- This is a 4-bed/2.5-bath single-family listed at $323k.
Deal economics
- At list price, monthly cash flow is $2k ($20k/yr) — positive.
- The deal already cash-flows at list — no discount required.
- Meets the 1% rule at list price ($5k rent vs $323k).
- Recommended offer: $294k (9.0% below list) — sets the bar for market timing.
- Cap rate 12.5% vs local median 5.0% in Vermilion — top-decile yield for the area; either an underpriced asset or a hidden risk that comps aren't pricing in. Stress-test before assuming the spread holds.
Location & tenants
- Location reads 81/100 on livability (#96 in OH, #1,481 nationally) — a professional / high-income tenant draw. Strengths: crime A+, cost of living A+, housing A+; Watch: commute F.
- Vermilion Local (suburban): math 56% / reading 60% proficiency, ranked #316 of 656 in OH (top 48%) — acceptable for families but not a draw, mixed tenant base, ~2y average lease.
- Market conditions: 142 active listings in the ZIP; 3 comparable units currently listed for rent nearby; rentals leasing fast (median 2d on market — plan ~1-2 weeks tenant-placement turnaround); 128 units permitted in Erie County in 2024 (5 in 5+ unit buildings).
- At $4,856/mo this rent would consume 81% of the median local household income ($72k/yr) — very limited rent-growth headroom before tenants either downsize or default.
Forward outlook
- Local home prices are declining (-3.0%/yr); year-one equity from $2k of loan paydown is wiped out by about $10k of value loss. Plan a longer hold.
- Erie County population projected at -15% by 2050 — secular population decline; favor cash flow + early exit over multi-decade hold.
- At projected returns (-3.0% appreciation + 3.0% rent growth), your $90k cash investment doubles in ~6 years — after that, you're playing with house money.
Negotiation context
- It's been on market 120 days — a 9% lower offer ($294k) is reasonable based on typical stale-listing flexibility.
- 2 sale attempts; this cycle's ask has dropped $47k (13%) from the opening price — seller is motivated, your offer sets the floor, not the list.
- Current owner paid $113k; list at $323k implies a 186% gain — meaningful room to come down on a strong offer.
Questions for the listing agent
- It's been on market 120 days. Have you received any prior offers? Is the seller open to a 9% concession, seller financing, or rate buy-down credit?
- Why hasn't it sold? Are there any deal-killer items the seller is aware of (foundation, flood, title, zoning, code violations)?
- Is there a deadline driving the sale (1031 exchange, divorce, estate, relocation)? That informs how much negotiation room exists.
- Schools are B-rated — typically a magnet for longer-tenancy family renters. What's the average tenant stay here, and is there a school-zone premium baked into asking?
- What's the average days-on-market for RENTAL listings here right now (not sales)? A rising rental-DOM trend means longer vacancies and softer asking-rent achievability than the comps imply.
- What's the recent tenant-quality profile in this submarket — average credit score on applications, eviction rate, late-payment / NSF rate, and stable-employment percentage? A property-management company in the area should have these aggregated.
- How much new for-sale + rental construction is in the pipeline within 1–3 miles? Heavy new supply typically softens prices + rents 12–24 months out; constrained supply supports both.
Investment metrics
- 1% rule
- 1.50% ✓
- Cap rate
- 12.47%
- Cash-on-cash
- 22.07%
- DSCR
- 1.98
- GRM
- 5.5
CMA / ARV
- ARV (median comp)
- $321,173
- List price
- $323,000
- Delta
- 0.57%
- Verdict
- FAIR
- Comps
- 20 within 1.0 mi
Show comp detail 12 sales within ~0.75 mi
| Address | Dist | Beds/Ba | Sqft | Sold | Price | $/sf | Match |
|---|---|---|---|---|---|---|---|
| 5945 Cape Hatteras Dr | 0.14mi | 3/2.0 (-1) | 1,764 (+4%) | 7mo | $399,990 | $227 | 74 |
| 6012 Conneaut Light Dr | 0.10mi | 4/3.0 | 1,508 (-11%) | 2mo | $375,000 | $249 | 73 |
| 6004 Conneaut Light Dr | 0.05mi | 3/3.0 (-1) | 1,771 (+5%) | 19mo | $322,500 | $182 | 67 |
| 1080 Oakwood Dr | 0.24mi | 5/2.0 (+1) | 1,807 (+7%) | 12mo | $260,000 | $144 | 60 |
| 5573 Martin | 0.64mi | 3/2.0 (-1) | 1,550 (-8%) | 0mo | $329,900 | $213 | 49 |
| 5572 South St | 0.64mi | 3/1.5 (-1) | 1,618 (-4%) | 8mo | $347,000 | $214 | 47 |
| 914 York Ct | 0.19mi | 3/3.0 (-1) | 1,876 (+11%) | 22mo | $323,500 | $172 | 47 |
| 307 Chardonnay Cir | 0.74mi | 4/3.0 | 1,811 (+7%) | 15mo | $389,500 | $215 | 39 |
| 5524 Hartford Ave | 0.63mi | 3/1.5 (-1) | 1,560 (-8%) | 13mo | $160,000 | $103 | 38 |
| 1131 State St | 0.57mi | 3/2.5 (-1) | 1,927 (+14%) | 14mo | $292,000 | $152 | 34 |
| 978 State St | 0.55mi | 3/1.5 (-1) | 1,440 (-15%) | 12mo | $305,000 | $212 | 31 |
| 1299 State Rd | 0.66mi | 3/2.0 (-1) | 1,893 (+12%) | 22mo | $275,000 | $145 | 24 |
Match score weights: distance 35% · size 25% · config 20% · recency 20%. Top-matched comps best support the ARV.
Projected returns pro-forma
-3.0% appreciation · 3.0% rent growth · sell at horizon
- IRR
- 14.8%
- Equity multiple
- 1.59×
- Total profit
- $53,653
- Equity at exit
- $48,160
- IRR
- 23.5%
- Equity multiple
- 3.03×
- Total profit
- $183,306
- Equity at exit
- $27,927
Cash invested: $90,440 (down + closing). Projections, not guarantees.
Landlord ↔ Tenant lean methodology
- Overall (STATE)
- 73 Landlord-Friendly
- State Ohio
- 73 Landlord-Friendly · R+6
- County
- — inherits STATE
- City
- — inherits STATE
ZIP-level market 44089
- Active inventory
- 142
- Price-to-rent
- 5.5×
Monthly cashflow live
- Estimated rent
- $4,856 medium interval (Pro) →
- Mortgage (P&I)
- −$1,694
- Tax from tax record
- −$345 /mo · $4,134/yr
- Insurance
- −$135
- HOA
- −$0
- Vacancy / Maint / Mgmt
- −$1,020
- Net cashflow
- $1,664
Break-even live
UW: 25.0% down · 7.5% · 30yr · 1.5% tax · 5.0% vac · 8.0% maint · 8.0% mgmt
Financing live
Cash to close
- Down payment
- $80,750
- Closing costs
- $9,690
- Reserves months
- —
- Total cash needed
- —
Loan-product check · same deal, 3 products live
Conventional
25% down · 7.5% · 30yr
- Down + closing
- —
- Monthly P&I
- —
- Monthly cashflow
- —
- DSCR
- —
- Eligible?
- —
Personal DTI + credit; lowest rate.
DSCR
20% down · 8.5% · 30yr
- Down + closing
- —
- Monthly P&I
- —
- Monthly cashflow
- —
- DSCR
- —
- Eligible?
- —
No personal income docs; deal must DSCR.
Hard money
10% down · 12.0% · 12mo
- Down + closing
- —
- Monthly P&I
- —
- Monthly cashflow
- —
- DSCR
- —
- Eligible?
- —
Short-term bridge; refi at stabilization.
Rent comps 3 comps
| Address | Beds | Baths | Sqft | Rent | $/sqft | DOM | Units | Dist |
|---|---|---|---|---|---|---|---|---|
| 5821 South St Vermilion, OH | 5.0 | 2.5 | 2007 | $2,995 | $1.49 | 1d | 1 | 0.41mi |
| 5012 Hollyview Dr Unit 1496126P Vermilion, OH | 4.0 | 1.5 | 1679 | $8,362 | $4.98 | 43d | 1 | 1.30mi |
| 4861 Pineview Dr Unit 1496121P Vermilion, OH | 5.0 | 2.0 | 2055 | $6,645 | $3.23 | 1d | 1 | 1.32mi |
Listing history 24 events
-
2026-06-18days on market $323,000 Active 120 DOM
-
2026-06-17days on market $323,000 Active 119 DOM
-
2026-06-16days on market $323,000 Active 118 DOM
-
2026-06-15days on market $323,000 Active 117 DOM
-
2026-06-13days on market $323,000 Active 115 DOM
-
2026-06-09days on market $323,000 Active 111 DOM
-
2026-06-08days on market $323,000 Active 110 DOM
-
2026-06-07days on market $323,000 Active 109 DOM
-
2026-06-05pricedays on market $323,000 Active 106 DOM
-
2026-06-03remarks 679-char remark
-
2026-06-03days on market $324,000 Active 105 DOM
-
2026-06-02days on market $324,000 Active 104 DOM
-
2026-06-01days on market $324,000 Active 103 DOM
-
2026-05-31days on market $324,000 Active 102 DOM
-
2026-04-17price $334,000 738-char remark
Show marketing remark (738 chars)
Stunning 4 bed, 2.5 bath home in Lighthouse Estates! Built in 2021 and loaded with updates: Samsung stove (2023), pergola & patio (2023), partially finished basement (2025), solar panels (2024), custom wall panels, kitchen backsplash, garage/laundry shelving & more. Private fenced backyard—perfect for entertaining. Move-in ready with modern style and energy efficiency. Walking distance to the beach, shopping, and dining. Home includes fully installed solar panel system — enjoy clean, renewable energy and major long-term savings! Average monthly electric bills drop significantly with solar, especially in summer months. Fixed solar loan payment of $199/month locks in energy savings while utility rates rise.
-
2026-03-20price $349,000 738-char remark
Show marketing remark (738 chars)
Stunning 4 bed, 2.5 bath home in Lighthouse Estates! Built in 2021 and loaded with updates: Samsung stove (2023), pergola & patio (2023), partially finished basement (2025), solar panels (2024), custom wall panels, kitchen backsplash, garage/laundry shelving & more. Private fenced backyard—perfect for entertaining. Move-in ready with modern style and energy efficiency. Walking distance to the beach, shopping, and dining. Home includes fully installed solar panel system — enjoy clean, renewable energy and major long-term savings! Average monthly electric bills drop significantly with solar, especially in summer months. Fixed solar loan payment of $199/month locks in energy savings while utility rates rise.
-
2026-02-18$369,900 Active 738-char remark
Show marketing remark (738 chars)
Stunning 4 bed, 2.5 bath home in Lighthouse Estates! Built in 2021 and loaded with updates: Samsung stove (2023), pergola & patio (2023), partially finished basement (2025), solar panels (2024), custom wall panels, kitchen backsplash, garage/laundry shelving & more. Private fenced backyard—perfect for entertaining. Move-in ready with modern style and energy efficiency. Walking distance to the beach, shopping, and dining. Home includes fully installed solar panel system — enjoy clean, renewable energy and major long-term savings! Average monthly electric bills drop significantly with solar, especially in summer months. Fixed solar loan payment of $199/month locks in energy savings while utility rates rise.
-
2025-11-12historical
-
2025-09-07price $349,900
-
2025-09-07price $349,999
-
2025-08-09price $359,999
-
2025-07-25price $377,900
-
2025-07-18$379,900 Active
-
2020-08-03soldstatus $112,950
ⓘ Source: listings_history table (triggers on properties + properties_extension) + one-shot
backfill from property_details.listing_events for pre-trigger history.
Tax reassessment forecast OH · Partial reset (capped growth)
- Current annual tax
- $4,134 · $345/mo
- Projected year-2 tax
- $4,586 · $382/mo
- Expected delta
- +$452/yr (+$38/mo · 10.9%)
ⓘ Screening estimate from a state-policy table — verify with the county assessor before closing.
Climate risk First Street
- Flood 1/10 Low FEMA zone X (unshaded) · 0% chance over 30 yrs
- Wildfire 1/10 Low
- Heat 3/10 Moderate 7 d/yr ≥96°F today · 17 d/yr by 30 yrs out
- Wind 2/10 Low
- Air quality 2/10 Low 1 unhealthy d/yr today · 3 by 30 yrs out
Nearby sold comps map
Loading sold comps map…
Walkable amenities ~0.75 mi
Loading nearby amenities…
Taxation est. · year 1
- Rental income
- $58,277
- − Mortgage interest
- −$18,093
- − Property taxes
- −$4,134
- − Insurance
- −$1,615
- − Repairs & maintenance
- −$4,662
- − Management
- −$4,662
- − Depreciation
- −$9,396
- Taxable income
- $15,714
- Est. tax owed @ 24.0%
- −$3,771
- After-tax cash flow
- $16,192/yr
For passive investors: Depreciation is non-cash, so a rental often shows a tax loss while cash-flowing — sheltering income. Rental losses are passive: they offset passive income freely, and up to $25,000/yr can offset ordinary (W-2) income if you actively participate and your MAGI is under $100k (phasing out to $0 by $150k); unused losses carry forward. On sale, claimed depreciation is recaptured at up to 25%, and gains may owe capital-gains tax (a 1031 exchange can defer both). Figures are a year-1 estimate at your 24.0% rate — not tax advice; consult a CPA.
Schools (NCES district)
- District
- Vermilion Local
- NCES district ID
- 3904682
- Math proficiency
- 56% ▼ -13.00%
- Reading proficiency
- 60% ▼ -5.00%
- Median HH income
- $52,091
- Composite
- 49.61/100
- National rank
- #1981
- State rank
- #316 of 656 in OH
Livability — Vermilion
- Score
- 81/100
- State rank
- #96
- US rank
- #1481
Category grades
Schools grade is shown separately in the Schools card above.
Census & demographics
- Census place
- Vermilion, OH
- County
- Erie · 78,232 people
- Metro
- Sandusky, OH
- Population (ZIP)
- 15,873
- Household income
- $72,045
- Rent vs Own
- Severe rent burden
- 5.8
Population outlook (Erie County) Hauer SSP2
- Today (2025)
- 73,204 people
- By 2030
- 71,341 · -2.5%
- By 2040
- 66,771 · -8.8%
- By 2050
- 62,512 · -14.6%
- By 2075
- 56,154 · -23.3%
- By 2100
- 49,045 · -33.0%
Race, ethnicity, and origin ACS 2023
- Neighborhood character
- Predominantly White (93%)
- Race & ethnicity
- White 93% Hispanic / Latino 4% Two or more races 3%
- Common ancestry
- Romanian 7% Lithuanian 4% Slovak 2%
- Foreign-born
- 1%
- Languages at home
- 98% English-only · Other Indo-European 1%
Political lean MEDSL · Erie
- 2024 margin
- R (+14.1) · D 42.5% · R 56.6%
- 2008→2024 swing
- -28.0pp toward R · 2008: 13.9pp · 2024: -14.1pp
- All cycles
- 2024: R+14.1 2020: R+11.6 2016: R+9.8 2012: D+11.3 2008: D+13.9
Not yet ingested
- Civics
- —
Market trends
- HPI YoY
- ▼ -122.76%
- Current HPI
- 206.8223
- Rent YoY
- —
- Metro
- —
- State GDP YoY
- ▲ 1.98%
- F500 in state
- 48
Industry mix (Fortune 500 HQ in OH)
| Industry | F500 HQs | Revenue |
|---|---|---|
| Insurance | 3 | $145B |
|
||
| Industrial Machinery | 3 | $49B |
|
||
| Financial Services | 3 | $24B |
|
||
| Consumer Goods | 2 | $93B |
|
||
| Aerospace / Defense | 2 | $47B |
|
||
| Utilities | 2 | $33B |
|
||
Price history
+195.7% since first listed10 events — show timeline
- 2026-04-17 Price Changed $334,000 MLSNOW
- 2026-03-20 Price Changed $349,000 MLSNOW
- 2026-02-18 Listed $369,900 MLSNOW
- 2025-11-12 Listing Removed — MLSNOW
- 2025-09-07 Price Changed $349,900 MLSNOW
- 2025-09-07 Price Changed $349,999 MLSNOW
- 2025-08-09 Price Changed $359,999 MLSNOW
- 2025-07-25 Price Changed $377,900 MLSNOW
- 2025-07-18 Listed $379,900 MLSNOW
- 2020-08-03 Sold (Public Records) $112,950 Public Records
Property tax history
+24.7%/yrLatest (2025): $4,134 · -2.9% YoY. Source: county tax records.
Cash-flow waterfall
monthlySold comps — $/sqft
last 12 mo · ≤1 miLoading sold comps…