 🏷️ Likely Rental
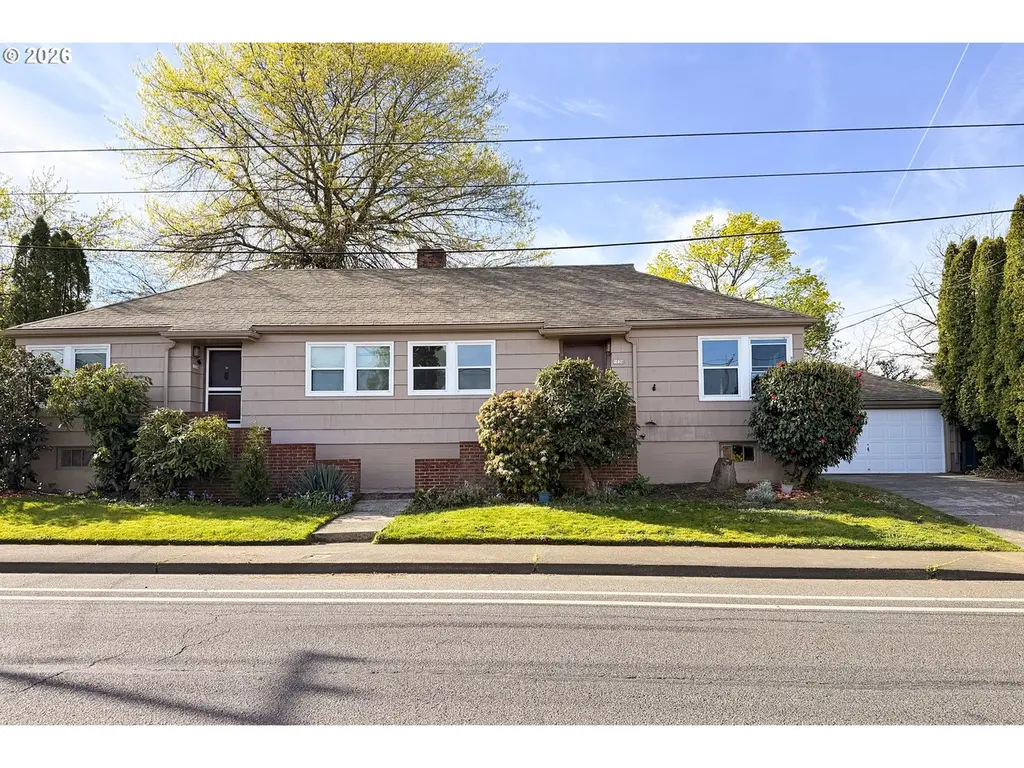
7020 NE Halsey St · Portland, OR
Flood risk 1/10 · Minimal
- FEMA flood zone
- X (unshaded)
- Chance of flooding over 30 yrs
- 0.0%
- Est. flood insurance / yr
- $473 – $860
Fire risk 1/10 · Minimal
- Est. fire insurance / yr
- $498 – $926
Heat risk 3/10 · Minor
- Hot days now (above 91°F)
- 7 days/yr
- Hot days in 30 yrs
- 15 days/yr
Wind risk 1/10 · Minimal
- Chance of severe wind over 30 yrs
- —
Air-quality risk 10/10 · Severe
- Unhealthy air days now
- 19 days/yr
- Unhealthy air days in 30 yrs
- 21 days/yr
Risk factors via First Street. Map © Google.
Why this score? — see what drove the D grade
The composite is a weighted blend of 9 inputs, each scored 0–100. Each bar is that input's sub-score; the figure is the points it added to the 100-point composite (weight × sub-score).
- ARV discount +15.0/15.0
- Cash flow +7.8/30.0
- Schools +4.7/10.0
- Livability +3.9/5.0
- Rent growth +2.8/5.0
- Condition / age +2.5/5.0
- 1% rule +2.4/10.0
- DSCR +1.9/10.0
- Appreciation +0.0/10.0
$489,000
🖨 Deal sheet 📄 Offer letter ✓ Due diligence
Multi-family units
County records classify this as Multi-Family (2-4 Unit). Listing-text estimate: 2 units. confirmed
Listing remarks MLS
NE Portland duplex on a corner lot offering solid upside potential. Each unit features 2 bedrooms, 1 bath, and a full unfinished basement, providing additional storage or future flexibility.One unit is currently vacant and has been recently updated with fresh interior paint, new flooring, bathroom improvements, and new gas furnace—making it ready for immediate occupancy or lease-up. The second unit expected to be vacated May 31st. Estimated market rent is approximately $1,750/month per unit (according to attached Rent-o-meter report). Both units include updated double-pane vinyl windows and private fenced backyards. New roof will go on by end of May. A detached two-car garage adds additional value and utility.Property is being sold as-is. Ideal opportunity for investors to add value or owner-occupants looking to offset their mortgage while building equity.
Key facts
- New flooring
- Fresh interior paint
- Corner lot
Tags
Neighborhood map
What this means for you Summary
Snapshot
- This is a 2 × 2-bed/1-bath units multifamily listed at $489k.
Deal economics
- At list price, monthly cash flow is $-537 ($-6k/yr) — negative. Per door: $-268/mo.
- To cash-flow at today's rent, offer at most $411k (15.9% below list).
- To meet the 1% rule (rent ≥ 1% of price), the offer needs to be $360k (26.4% below list).
- Recommended offer: $360k (26.4% below list) — sets the bar for 1% rule.
- Cap rate 5.0% vs local median 2.2% in Portland — top-decile yield for the area; either an underpriced asset or a hidden risk that comps aren't pricing in. Stress-test before assuming the spread holds.
Location & tenants
- Location reads 77/100 on livability (#72 in OR, #3,256 nationally) — a middle-class / working-renter tenant base. Strengths: amenities A+, commute A+, health & safety A+; Watch: crime F, cost of living F.
- Portland SD 1J (urban): math 46% / reading 58% proficiency, ranked #23 of 183 in OR (top 13%) — acceptable for families but not a draw, mixed tenant base, ~2y average lease.
- Market conditions: Rents rising (+1.1%/yr); 182 active listings in the ZIP; 13 comparable units currently listed for rent nearby; rentals at typical pace (median 20d on market — plan ~3-4 weeks tenant-placement turnaround); solid renter incomes; 2,041 units permitted in Multnomah County in 2024 (905 in 5+ unit buildings).
- This rent runs 44% of the median local income ($97k/yr) — at the standard rent-burdened threshold; future hikes will face affordability resistance.
Forward outlook
- Local home prices are declining (-3.0%/yr); year-one equity from $3k of loan paydown is wiped out by about $15k of value loss. Plan a longer hold.
- Multnomah County population projected at +33% by 2050 — long-run rental-demand tailwind backs the buy-and-hold thesis.
Negotiation context
- It's been on market 68 days — a 6% lower offer ($460k) is reasonable based on typical stale-listing flexibility.
Risks & watch-outs
- Watch-outs: built in 1948 — expect roof / HVAC / electrical / plumbing capex.
Questions for the listing agent
- What do current leases actually rent for vs. the listed asking? Can we see a recent rent roll and the last 12 months of T-12 income?
- It's been on market 68 days. Have you received any prior offers? Is the seller open to a 26% concession, seller financing, or rate buy-down credit?
- Can we see the unit-by-unit rent roll, current vacancy, and any below-market leases? What's the average tenancy length?
- What capital expenditures (roof, boiler, parking lot, exteriors) have been made in the last 5 years, and what's planned in the next 2?
- Built in 1948 — when were the roof, HVAC, electrical panel, plumbing, and water heater last replaced?
- Why hasn't it sold? Are there any deal-killer items the seller is aware of (foundation, flood, title, zoning, code violations)?
- Is there a deadline driving the sale (1031 exchange, divorce, estate, relocation)? That informs how much negotiation room exists.
- Crime grade is F in this area — have there been break-ins, vandalism, or insurance claims at this property in the last 3 years? What carrier currently insures it and at what premium?
- The area grade is low — what's the realistic commute time and amenity access for the typical tenant pool here? Any planned neighborhood developments (good or bad) we should know about?
- What's the average days-on-market for RENTAL listings here right now (not sales)? A rising rental-DOM trend means longer vacancies and softer asking-rent achievability than the comps imply.
- What's the recent tenant-quality profile in this submarket — average credit score on applications, eviction rate, late-payment / NSF rate, and stable-employment percentage? A property-management company in the area should have these aggregated.
- How much new apartment / multifamily construction is in the pipeline within 1–3 miles? Heavy new supply (>2% of stock underway) typically softens rents 12–24 months out; light construction supports rent growth.
Investment metrics
- 1% rule
- 0.74% ✗
- Cap rate
- 4.98%
- Cash-on-cash
- -4.71%
- DSCR
- 0.79
- GRM
- 11.3
CMA / ARV
- ARV (median comp)
- $655,185
- List price
- $489,000
- Delta
- -25.36%
- Verdict
- UNDERPRICED
- Comps
- 20 within 1.0 mi
Show comp detail 2 sales within ~0.75 mi
| Address | Dist | Beds/Ba | Sqft | Sold | Price | $/sf | Match |
|---|---|---|---|---|---|---|---|
| 7906 NE Oregon St | 0.53mi | 5/3.0 (+1) | 2,263 (+1%) | 16mo | $660,000 | $292 | 52 |
| 504 506 NE 62nd Ave | 0.65mi | 3/2.0 (-1) | 2,124 (-6%) | 22mo | $570,000 | $268 | 37 |
Match score weights: distance 35% · size 25% · config 20% · recency 20%. Top-matched comps best support the ARV.
Projected returns pro-forma
-3.0% appreciation · 1.11% rent growth · sell at horizon
- IRR
- -26.4%
- Equity multiple
- 0.12×
- Total profit
- $-120,099
- Equity at exit
- $72,911
- IRR
- -31.2%
- Equity multiple
- -0.28×
- Total profit
- $-174,928
- Equity at exit
- $42,280
Cash invested: $136,920 (down + closing). Projections, not guarantees.
Landlord ↔ Tenant lean methodology
- Overall (CITY)
- 0 Strongly Tenant-Friendly
- State Oregon
- 28 Tenant-Leaning · D+6
- County
- — inherits STATE
- City Portland
- 0 Strongly Tenant-Friendly · D+39
ZIP-level market 97213
- Rents YoY
- 1.1%
- Active inventory
- 182
- Price-to-rent
- 22.6×
Monthly cashflow live
- Estimated rent
- $3,598 high interval (Pro) →
- Mortgage (P&I)
- −$2,564
- Tax est. 1.5%
- −$611 /mo · $7,335/yr
- Insurance
- −$204
- HOA
- −$0
- Vacancy / Maint / Mgmt
- −$756
- Net cashflow
- $-537
Break-even live
2-unit breakdown (identical units grouped — click to expand)
| Units | Beds | Baths | Est. rent |
|---|---|---|---|
| 2× units | 2 | 1 | $3,598 |
| #1 | 2 | 1 | $1,799 |
| #2 | 2 | 1 | $1,799 |
| Total (2 units) | $3,598 | ||
UW: 25.0% down · 7.5% · 30yr · 1.5% tax · 5.0% vac · 8.0% maint · 8.0% mgmt
Financing live
Cash to close
- Down payment
- $122,250
- Closing costs
- $14,670
- Reserves months
- —
- Total cash needed
- —
Loan-product check · same deal, 3 products live
Conventional
25% down · 7.5% · 30yr
- Down + closing
- —
- Monthly P&I
- —
- Monthly cashflow
- —
- DSCR
- —
- Eligible?
- —
Personal DTI + credit; lowest rate.
DSCR
20% down · 8.5% · 30yr
- Down + closing
- —
- Monthly P&I
- —
- Monthly cashflow
- —
- DSCR
- —
- Eligible?
- —
No personal income docs; deal must DSCR.
Hard money
10% down · 12.0% · 12mo
- Down + closing
- —
- Monthly P&I
- —
- Monthly cashflow
- —
- DSCR
- —
- Eligible?
- —
Short-term bridge; refi at stabilization.
Rent comps 13 comps
| Address | Beds | Baths | Sqft | Rent | $/sqft | DOM | Units | Dist |
|---|---|---|---|---|---|---|---|---|
| 865 NE 72nd Ave Portland, OR | 3.0 | 2.0 | 1796 | $3,495 | $1.95 | 14d | 1 | 0.27mi |
| 7212 NE Tillamook St Portland, OR | 4.0 | 2.0 | 2061 | $3,285 | $1.59 | 20d | 1 | 0.29mi |
| 1045 NE 79th Ave Portland, OR | 4.0 | 3.0 | 2500 | $3,000 | $1.20 | 1d | 1 | 0.41mi |
| 1635 NE 81st Ave Portland, OR | 3.0 | 2.0 | 1950 | $2,400 | $1.23 | 23d | 1 | 0.49mi |
| 1204 NE 62nd Ave Portland, OR | 4.0 | 2.0 | 1680 | $2,999 | $1.79 | 4d | 1 | 0.49mi |
| 425 NE 70th Ave Apt 1 Portland, OR | 3.0 | 2.0 | 1600 | $2,250 | $1.41 | 2d | 1 | 0.51mi |
| 6976 NE Stanton St Portland, OR | 3.0 | 2.0 | 1956 | $3,245 | $1.66 | 1d | 1 | 0.72mi |
| 8833 SE Pine St Portland, OR | 4.0 | 2.0 | 1756 | $2,999 | $1.71 | 43d | 1 | 1.22mi |
| 3044 NE 53rd Ave Portland, OR | 3.0 | 2.0 | 2236 | $4,250 | $1.90 | 43d | 1 | 1.23mi |
| 4621 NE Royal Ct Portland, OR | 4.0 | 3.0 | 2957 | $2,500 | $0.85 | 43d | 1 | 1.26mi |
| 2224 NE 46th Ave Portland, OR | 4.0 | 3.0 | 2906 | $4,800 | $1.65 | 23d | 1 | 1.31mi |
| 3938 NE 66th Ave Portland, OR | 4.0 | 3.0 | 3070 | $3,995 | $1.30 | 1d | 1 | 1.31mi |
| 9801-9823 NE Glisan St Unit 9823-A Portland, OR | 5.0 | 2.5 | 2800 | $2,300 | $0.82 | 43d | 1 | 1.39mi |
Listing history 13 events
-
2026-06-18days on market $489,000 Active 68 DOM
-
2026-06-17days on market $489,000 Active 67 DOM
-
2026-06-16days on market $489,000 Active 66 DOM
-
2026-06-15days on market $489,000 Active 65 DOM
-
2026-06-13days on market $489,000 Active 63 DOM
-
2026-06-09days on market $489,000 Active 59 DOM
-
2026-06-08days on market $489,000 Active 58 DOM
-
2026-06-07days on market $489,000 Active 57 DOM
-
2026-06-03days on market $489,000 Active 53 DOM
-
2026-06-02days on market $489,000 Active 52 DOM
-
2026-06-01days on market $489,000 Active 51 DOM
-
2026-05-31days on market $489,000 Active 50 DOM
-
2026-04-11$489,000 Active 874-char remark
Show marketing remark (874 chars)
NE Portland duplex on a corner lot offering solid upside potential. Each unit features 2 bedrooms, 1 bath, and a full unfinished basement, providing additional storage or future flexibility.One unit is currently vacant and has been recently updated with fresh interior paint, new flooring, bathroom improvements, and new gas furnace—making it ready for immediate occupancy or lease-up. The second unit expected to be vacated May 31st. Estimated market rent is approximately $1,750/month per unit (according to attached Rent-o-meter report). Both units include updated double-pane vinyl windows and private fenced backyards. New roof will go on by end of May. A detached two-car garage adds additional value and utility.Property is being sold as-is. Ideal opportunity for investors to add value or owner-occupants looking to offset their mortgage while building equity.
ⓘ Source: listings_history table (triggers on properties + properties_extension) + one-shot
backfill from property_details.listing_events for pre-trigger history.
Climate risk First Street
- Flood 1/10 Low FEMA zone X (unshaded) · 0% chance over 30 yrs
- Wildfire 1/10 Low
- Heat 3/10 Moderate 7 d/yr ≥91°F today · 15 d/yr by 30 yrs out
- Wind 1/10 Low
- Air quality 10/10 Extreme 19 unhealthy d/yr today · 21 by 30 yrs out
Nearby sold comps map
Loading sold comps map…
Walkable amenities ~0.75 mi
Loading nearby amenities…
Taxation est. · year 1
- Rental income
- $43,176
- − Mortgage interest
- −$27,392
- − Property taxes
- −$7,335
- − Insurance
- −$2,445
- − Repairs & maintenance
- −$3,454
- − Management
- −$3,454
- − Depreciation
- −$14,225
- Taxable loss
- −$15,129
- Est. tax savings @ 24.0%
- +$3,631
- After-tax cash flow
- $-2,812/yr
For passive investors: Depreciation is non-cash, so a rental often shows a tax loss while cash-flowing — sheltering income. Rental losses are passive: they offset passive income freely, and up to $25,000/yr can offset ordinary (W-2) income if you actively participate and your MAGI is under $100k (phasing out to $0 by $150k); unused losses carry forward. On sale, claimed depreciation is recaptured at up to 25%, and gains may owe capital-gains tax (a 1031 exchange can defer both). Figures are a year-1 estimate at your 24.0% rate — not tax advice; consult a CPA.
Schools (NCES district)
- District
- Portland SD 1J
- NCES district ID
- 4110040
- Math proficiency
- 46% ▼ -2.00%
- Reading proficiency
- 58% ▼ -3.00%
- Median HH income
- $57,851
- Composite
- 47.1/100
- National rank
- #5112
- State rank
- #23 of 183 in OR
Livability — Portland
- Score
- 77/100
- State rank
- #72
- US rank
- #3256
Category grades
Schools grade is shown separately in the Schools card above.
Census & demographics
- Census place
- Portland, OR
- County
- Multnomah County · 786,692 people
- City population
- 774,334
- Metro
- Portland-Vancouver-Hillsboro, OR-WA
- Population (ZIP)
- 31,408
- Household income
- $97,068
- Rent vs Own
- Severe rent burden
- 1514.0
Population outlook (Multnomah County) Hauer SSP2
- Today (2025)
- 930,825 people
- By 2030
- 996,904 · +7.1%
- By 2040
- 1,121,379 · +20.5%
- By 2050
- 1,242,124 · +33.4%
- By 2075
- 1,464,431 · +57.3%
- By 2100
- 1,576,181 · +69.3%
Race, ethnicity, and origin ACS 2023
- Neighborhood character
- Predominantly White (79%)
- Race & ethnicity
- White 79% Two or more races 10% Hispanic / Latino 6% Asian 5% Black 2%
- Hispanic origin (detail)
- Mexican 4%
- Common ancestry
- Slovak 4% Italian 4% Portuguese 4%
- Foreign-born
- 8% · Canada, Vietnam, China
- Languages at home
- 89% English-only · Spanish 3% Other Asian/Pacific 2% Vietnamese 2%
Political lean MEDSL · Multnomah
- 2024 margin
- Solid D (+62.1) · D 79.3% · R 17.2% · Other 3.5%
- 2008→2024 swing
- +6.0pp toward D · 2008: 56.1pp · 2024: 62.1pp
- All cycles
- 2024: D+62.1 2020: D+61.3 2016: D+58.3 2012: D+54.9 2008: D+56.1
Not yet ingested
- Civics
- —
Market trends
- HPI YoY
- ▼ -807.84%
- Current HPI
- 330.3186
- Rent YoY
- ▲ 1.11%
- Metro
- Portland-Vancouver-Hillsboro, OR-WA
- State GDP YoY
- ▲ 2.05%
- F500 in state
- 2
Industry mix (Fortune 500 HQ in OR)
| Industry | F500 HQs | Revenue |
|---|---|---|
| Consumer Goods | 1 | $51B |
|
||
Price history
1 event — show timeline
- 2026-04-11 Listed $489,000 RMLS
Cash-flow waterfall
monthlySold comps — $/sqft
last 12 mo · ≤1 miLoading sold comps…