 🏗️ New Construction
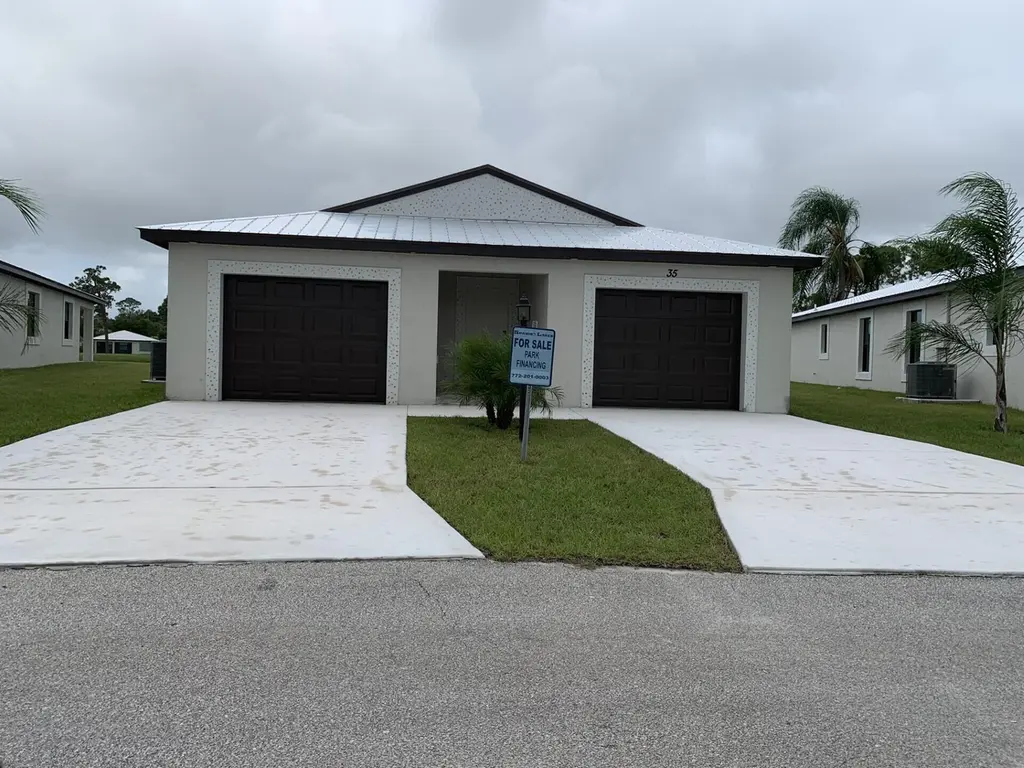
41 La Villa Way · Lakewood Park, FL
Flood risk 3/10 · Minor
- FEMA flood zone
- X (unshaded)
- Chance of flooding over 30 yrs
- 0.2%
- Est. flood insurance / yr
- $507 – $1,088
Fire risk 4/10 · Minor
- Est. fire insurance / yr
- $947 – $1,759
Heat risk 10/10 · Severe
- Hot days now (above 107°F)
- 7 days/yr
- Hot days in 30 yrs
- 25 days/yr
Wind risk 10/10 · Severe
- Chance of severe wind over 30 yrs
- 99.0%
Air-quality risk 1/10 · Minimal
- Unhealthy air days now
- 0 days/yr
- Unhealthy air days in 30 yrs
- 0 days/yr
Risk factors via First Street. Map © Google.
Why this score? — see what drove the F grade
The composite is a weighted blend of 9 inputs, each scored 0–100. Each bar is that input's sub-score; the figure is the points it added to the 100-point composite (weight × sub-score).
- ARV discount +7.5/15.0
- Cash flow +7.4/30.0
- Condition / age +4.0/5.0
- Schools +3.7/10.0
- Livability +3.2/5.0
- Rent growth +2.5/5.0
- 1% rule +2.1/10.0
- DSCR +1.5/10.0
- Appreciation +0.0/10.0
$309,000
🖨 Deal sheet 📄 Offer letter ✓ Due diligence
Listing remarks
Our most Popular Model: The Windsor offers unmatched value with 3 full bedrooms, 2 baths, and a car garage + golf-cart garage. Enjoy high vaulted ceilings, a chef's kitchen with a large island, and open concept living perfect for entertaining. Built for comfort and peace of mind with solid block construction and impact windows. Whether you're relaxing at home or enjoying the clubhouse, golf course, or pickleball courts, this home delivers the 55+ lifestyle you've been dreaming of. All models are built with 3/16th true plywood roof sheathing, hurricane tie straps, R-30 insulation, & hip roof designs ensuring big insurance premium discounts. Our homes are equipped with all energy effici
Key facts
- Open concept living
- Hurricane tie straps
- Chef's kitchen
Tags
Property features AI
Finance
- Financial info: Land lease required (monthly); Land lease expires in 2126
- HOA & community: Located in a senior community; Pets allowed with no restrictions
Exterior
- Parking: Attached garage (1.5 spaces, covered)
- Security: Security patrol
- Utilities: Public water; Public sewer; Cable available; Electricity available; Water connected
- Home design: Single family residence; One story; New construction; Faces east
- Construction: Block/Concrete/Stucco/CBS construction; Built by Wynne Building Corporation; New construction
- Exterior features: Waterfront property; Metal roof
Interior
- Kitchen: Dishwasher; Electric range; Microwave; Refrigerator; Electric water heater
- Bedrooms: 3 main-level bedrooms
- Flooring: Carpet; Linoleum; Tile
- Bathrooms: 2 full bathrooms (both on main level)
- Heating & cooling: Central electric heating; Central air (electric)
- Interior features: High ceilings; Kitchen island; Walk-in closet(s)
- Laundry & utility: Dedicated laundry room
Neighborhood map
What this means for you Summary
Snapshot
- This is a 3-bed/2.0-bath single-family listed at $309k. Condition is rated good.
Deal economics
- At list price, monthly cash flow is $-477 ($-6k/yr) — negative.
- To cash-flow at today's rent, offer at most $296k (4.3% below list).
- To meet the 1% rule (rent ≥ 1% of price), the offer needs to be $259k (16.3% below list).
- Recommended offer: $259k (16.3% below list) — sets the bar for 1% rule.
Location & tenants
- Location reads 63/100 on livability (#719 in FL) — a middle-class / working-renter tenant base. Strengths: cost of living A+, housing A+; Watch: schools F, amenities F, commute F.
- St. Lucie (urban): math 40% / reading 48% proficiency, ranked #51 of 73 in FL (top 70%) — families likely to look elsewhere, expect single-tenant / working-renter base with shorter leases.
- Market conditions: 292 active listings in the ZIP; 8 comparable units currently listed for rent nearby; rentals at typical pace (median 21d on market — plan ~3-4 weeks tenant-placement turnaround); 4,868 units permitted in St. Lucie County in 2024 (268 in 5+ unit buildings).
- At $2,586/mo this rent would consume 49% of the median local household income ($63k/yr) (locally 140% of renters already pay >50% of income on rent) — very limited rent-growth headroom before tenants either downsize or default.
Forward outlook
- Local home prices are declining (-3.0%/yr); year-one equity from $3k of loan paydown is wiped out by about $11k of value loss. Plan a longer hold.
- St. Lucie County population projected at +20% by 2050 — long-run rental-demand tailwind backs the buy-and-hold thesis.
Negotiation context
- It's been on market 77 days — a 6% lower offer ($290k) is reasonable based on typical stale-listing flexibility.
Risks & watch-outs
- Climate carrying-cost: severe wind risk, 99% chance of damaging wind over 30y; extreme-heat days projected 7→25/yr by 2055 (HVAC capex compounding) — expect insurance premiums to compound above CPI over the hold.
Questions for the listing agent
- What do current leases actually rent for vs. the listed asking? Can we see a recent rent roll and the last 12 months of T-12 income?
- It's been on market 77 days. Have you received any prior offers? Is the seller open to a 16% concession, seller financing, or rate buy-down credit?
- Why hasn't it sold? Are there any deal-killer items the seller is aware of (foundation, flood, title, zoning, code violations)?
- Is there a deadline driving the sale (1031 exchange, divorce, estate, relocation)? That informs how much negotiation room exists.
- Schools are F-rated, which usually means shorter tenancies and higher turnover. Who's the typical renter profile here, and what's been the actual vacancy rate?
- The area grade is low — what's the realistic commute time and amenity access for the typical tenant pool here? Any planned neighborhood developments (good or bad) we should know about?
- What's the average days-on-market for RENTAL listings here right now (not sales)? A rising rental-DOM trend means longer vacancies and softer asking-rent achievability than the comps imply.
- What's the recent tenant-quality profile in this submarket — average credit score on applications, eviction rate, late-payment / NSF rate, and stable-employment percentage? A property-management company in the area should have these aggregated.
- How much new for-sale + rental construction is in the pipeline within 1–3 miles? Heavy new supply typically softens prices + rents 12–24 months out; constrained supply supports both.
Investment metrics
- 1% rule
- 0.71% ✗
- Cap rate
- 4.72%
- Cash-on-cash
- -5.61%
- DSCR
- 0.75
- GRM
- 11.8
CMA / ARV
- ARV (on-the-fly)
- $364,624
- Comps found
- 12
Show comp detail 12 sales within ~0.75 mi
| Address | Dist | Beds/Ba | Sqft | Sold | Price | $/sf | Match |
|---|---|---|---|---|---|---|---|
| 65 Lavilla Way | 0.05mi | 2/2.0 (-1) | 1,687 (-4%) | 6mo | $299,000 | $177 | 81 |
| 37 Lagos Del Norte | 0.36mi | 3/2.0 | 1,839 (+5%) | 5mo | $305,000 | $166 | 70 |
| 6505 Citrus Park Blvd | 0.11mi | 3/2.0 | 1,548 (-12%) | 9mo | $345,000 | $223 | 68 |
| 5902 Walnut Park Ln | 0.75mi | 3/2.0 | 1,766 (+1%) | 1mo | $399,900 | $226 | 63 |
| 39 Villa Blanca | 0.51mi | 2/2.5 (-1) | 1,840 (+5%) | 1mo | $180,000 | $98 | 60 |
| 7004 Bayard Rd | 0.52mi | 4/2.0 (+1) | 1,673 (-5%) | 4mo | $334,990 | $200 | 60 |
| 7004 Bayard Rd #10 | 0.52mi | 4/2.0 (+1) | 1,673 (-5%) | 4mo | $334,990 | $200 | 60 |
| 7205 Salerno Rd | 0.54mi | 4/2.0 (+1) | 1,673 (-5%) | 5mo | $347,990 | $208 | 58 |
| 695 24th St SW | 0.58mi | 4/2.0 (+1) | 1,828 (+4%) | 13mo | $370,000 | $202 | 49 |
| 6702 Penny Ln | 0.44mi | 3/2.0 | 1,528 (-13%) | 10mo | $380,000 | $249 | 49 |
| 604 24th St SW | 0.74mi | 3/2.0 | 1,570 (-10%) | 9mo | $404,000 | $257 | 41 |
| 1160 25th St SW | 0.68mi | 4/2.0 (+1) | 1,584 (-10%) | 9mo | $390,000 | $246 | 39 |
Match score weights: distance 35% · size 25% · config 20% · recency 20%. Top-matched comps best support the ARV.
Projected returns pro-forma
-3.0% appreciation · 3.0% rent growth · sell at horizon
- IRR
- -25.9%
- Equity multiple
- 0.12×
- Total profit
- $-89,430
- Equity at exit
- $54,367
- IRR
- -22.5%
- Equity multiple
- -0.14×
- Total profit
- $-116,840
- Equity at exit
- $31,526
Cash invested: $102,095 (down + closing). Projections, not guarantees.
Landlord ↔ Tenant lean methodology
- Overall (STATE)
- 87 Strongly Landlord-Friendly
- State Florida
- 87 Strongly Landlord-Friendly · R+3
- County
- — inherits STATE
- City
- — inherits STATE
ZIP-level market 34951
- Home prices YoY
- -23.6%
- Active inventory
- 292
- Price-to-rent
- 10.0×
Monthly cashflow live
- Estimated rent
- $2,586 high interval (Pro) →
- Mortgage (P&I)
- −$1,912
- Tax est. 1.5%
- −$456 /mo · $5,469/yr
- Insurance
- −$152
- HOA
- −$0
- Vacancy / Maint / Mgmt
- −$543
- Net cashflow
- $-477
Break-even live
UW: 25.0% down · 7.5% · 30yr · 1.5% tax · 5.0% vac · 8.0% maint · 8.0% mgmt
Financing live
Cash to close
- Down payment
- $91,156
- Closing costs
- $10,939
- Reserves months
- —
- Total cash needed
- —
Loan-product check · same deal, 3 products live
Conventional
25% down · 7.5% · 30yr
- Down + closing
- —
- Monthly P&I
- —
- Monthly cashflow
- —
- DSCR
- —
- Eligible?
- —
Personal DTI + credit; lowest rate.
DSCR
20% down · 8.5% · 30yr
- Down + closing
- —
- Monthly P&I
- —
- Monthly cashflow
- —
- DSCR
- —
- Eligible?
- —
No personal income docs; deal must DSCR.
Hard money
10% down · 12.0% · 12mo
- Down + closing
- —
- Monthly P&I
- —
- Monthly cashflow
- —
- DSCR
- —
- Eligible?
- —
Short-term bridge; refi at stabilization.
Rent comps 8 comps
| Address | Beds | Baths | Sqft | Rent | $/sqft | DOM | Units | Dist |
|---|---|---|---|---|---|---|---|---|
| 2450 8th Ave SW Vero Beach, FL | 3.0 | 2.0 | 1388 | $2,100 | $1.51 | 20d | 1 | 0.54mi |
| 7503 Paso Robles Blvd Fort Pierce, FL | 3.0 | 2.0 | 1260 | $2,000 | $1.59 | 23d | 1 | 0.71mi |
| 5642 Sunberry Cir Fort Pierce, FL | 3.0 | 2.0 | 1377 | $1,950 | $1.42 | 23d | 1 | 0.83mi |
| 7403 Winter Garden Pkwy Fort Pierce, FL | 3.0 | 2.0 | 1372 | $2,200 | $1.60 | 21d | 1 | 0.90mi |
| 2320 Water Oaks Ln Unit 111 Vero Beach, FL | 3.0 | 2.0 | 1811 | $3,500 | $1.93 | 20d | 1 | 0.92mi |
| 5510 Shannon Dr Fort Pierce, FL | 3.0 | 2.0 | 1594 | $2,350 | $1.47 | 13d | 1 | 1.12mi |
| 7704 Pacific Ave Fort Pierce, FL | 3.0 | 2.0 | 1719 | $2,500 | $1.45 | 13d | 1 | 1.16mi |
| 23 Highland Dr SW Vero Beach, FL | 4.0 | 3.0 | 1263 | $2,950 | $2.34 | 20d | 1 | 1.35mi |
Listing history 18 events
-
2026-06-18days on market $309,000 Active 77 DOM
-
2026-06-17days on market $309,000 Active 76 DOM
-
2026-06-16days on market $309,000 Active 75 DOM
-
2026-06-15days on market $309,000 Active 74 DOM
-
2026-06-14days on market $309,000 Active 72 DOM
-
2026-06-13days on market $309,000 Active 71 DOM
-
2026-06-10days on market $309,000 Active 69 DOM
-
2026-06-09days on market $309,000 Active 68 DOM
-
2026-06-08days on market $309,000 Active 67 DOM
-
2026-06-07days on market $309,000 Active 66 DOM
-
2026-06-05days on market $309,000 Active 63 DOM
-
2026-06-03days on market $309,000 Active 62 DOM
-
2026-06-02days on market $309,000 Active 61 DOM
-
2026-06-01days on market $309,000 Active 60 DOM
-
2026-05-31days on market $309,000 Active 59 DOM
-
2026-05-30days on market $309,000 Active 58 DOM
-
2026-04-06price $309,000
-
2026-04-02$305,000 Active
ⓘ Source: listings_history table (triggers on properties + properties_extension) + one-shot
backfill from property_details.listing_events for pre-trigger history.
Climate risk First Street
- Flood 3/10 Moderate FEMA zone X (unshaded) · 20% chance over 30 yrs
- Wildfire 4/10 Moderate
- Heat 10/10 Extreme 7 d/yr ≥107°F today · 25 d/yr by 30 yrs out
- Wind 10/10 Extreme 99% chance of damaging wind over 30 yrs
- Air quality 1/10 Low 0 unhealthy d/yr today · 0 by 30 yrs out
Nearby sold comps map
Loading sold comps map…
Walkable amenities ~0.75 mi
Loading nearby amenities…
Taxation est. · year 1
- Rental income
- $31,029
- − Mortgage interest
- −$20,425
- − Property taxes
- −$5,469
- − Insurance
- −$1,823
- − Repairs & maintenance
- −$2,482
- − Management
- −$2,482
- − Depreciation
- −$10,607
- Taxable loss
- −$12,260
- Est. tax savings @ 24.0%
- +$2,942
- After-tax cash flow
- $-2,782/yr
For passive investors: Depreciation is non-cash, so a rental often shows a tax loss while cash-flowing — sheltering income. Rental losses are passive: they offset passive income freely, and up to $25,000/yr can offset ordinary (W-2) income if you actively participate and your MAGI is under $100k (phasing out to $0 by $150k); unused losses carry forward. On sale, claimed depreciation is recaptured at up to 25%, and gains may owe capital-gains tax (a 1031 exchange can defer both). Figures are a year-1 estimate at your 24.0% rate — not tax advice; consult a CPA.
Condition & rehab AI · 12 photos
This home is in excellent condition with a modern kitchen, two bathrooms, and impact windows. It is move-in ready and would benefit from some exterior painting and landscaping improvements to further enhance its value.
Value-add opportunities
- Resale Painting the exterior walls — Fresh paint can enhance curb appeal and property value.
- Resale Landscaping improvements — Enhanced landscaping can attract more potential buyers.
- Both Adding smart home features — Smart home features can increase both resale and rental value by making the home more modern and convenient.
Renovation cost estimate screening
Value-add ROI direction
- Resale Painting the exterior walls — Fresh paint can enhance curb appeal and property value. ↑
- Resale Landscaping improvements — Enhanced landscaping can attract more potential buyers. ↑
- Both Adding smart home features — Smart home features can increase both resale and rental value by making the home more modern and convenient. ↑
ⓘ Cost ranges are severity-bucket heuristics (US national rule-of-thumb). Get contractor quotes + a written scope before underwriting a rehab budget.
Schools (NCES district)
- District
- St. Lucie
- NCES district ID
- 1201770
- Math proficiency
- 40% ▼ -11.00%
- Reading proficiency
- 48% ▼ -4.00%
- Median HH income
- $44,737
- Composite
- 37.28/100
- National rank
- #4449
- State rank
- #51 of 73 in FL
Livability — Lakewood Park
- Score
- 63/100
- State rank
- #719
- US rank
- #15407
Category grades
Schools grade is shown separately in the Schools card above.
Census & demographics
- Census place
- Lakewood Park, FL
- County
- Saint Lucie County · 337,150 people
- Metro
- Port St. Lucie, FL
- Population (ZIP)
- 17,148
- Household income
- $63,122
- Rent vs Own
- Severe rent burden
- 140.0
Population outlook (St. Lucie County) Hauer SSP2
- Today (2025)
- 338,016 people
- By 2030
- 355,687 · +5.2%
- By 2040
- 385,521 · +14.1%
- By 2050
- 406,106 · +20.1%
- By 2075
- 441,054 · +30.5%
- By 2100
- 436,885 · +29.2%
Race, ethnicity, and origin ACS 2023
- Neighborhood character
- Predominantly White (74%)
- Race & ethnicity
- White 74% Black 13% Hispanic / Latino 8% Two or more races 7% Asian 2%
- Hispanic origin (detail)
- Mexican 2% Puerto Rican 2% Cuban 2%
- Common ancestry
- Romanian 3% Italian 2% Lithuanian 2%
- Foreign-born
- 10% · Canada, Jamaica, Vietnam
- Languages at home
- 88% English-only · Spanish 7% French/Haitian/Cajun 3% Vietnamese 1%
Political lean MEDSL · St. Lucie
- 2024 margin
- Lean R (+9.1) · D 45.1% · R 54.2%
- 2008→2024 swing
- -21.2pp toward R · 2008: 12.1pp · 2024: -9.1pp
- All cycles
- 2024: R+9.1 2020: R+1.6 2016: R+2.5 2012: D+7.9 2008: D+12.1
Not yet ingested
- Civics
- —
Market trends
- HPI YoY
- ▼ -106.06%
- Current HPI
- 343.1376
- Rent YoY
- —
- Metro
- Port St. Lucie, FL
- State GDP YoY
- ▲ 3.28%
- F500 in state
- 36
Industry mix (Fortune 500 HQ in FL)
| Industry | F500 HQs | Revenue |
|---|---|---|
| Industrial Technology | 2 | $29B |
|
||
| Insurance | 2 | $17B |
|
||
| Retail | 1 | $60B |
|
||
| Technology Distribution | 1 | $58B |
|
||
| Homebuilding | 1 | $35B |
|
||
| Technology Manufacturing | 1 | $35B |
|
||
Price history
+1.3% since first listed2 events — show timeline
- 2026-04-06 Price Changed $309,000 Beaches MLS
- 2026-04-02 Listed $305,000 Beaches MLS
Cash-flow waterfall
monthlySold comps — $/sqft
last 12 mo · ≤1 miLoading sold comps…