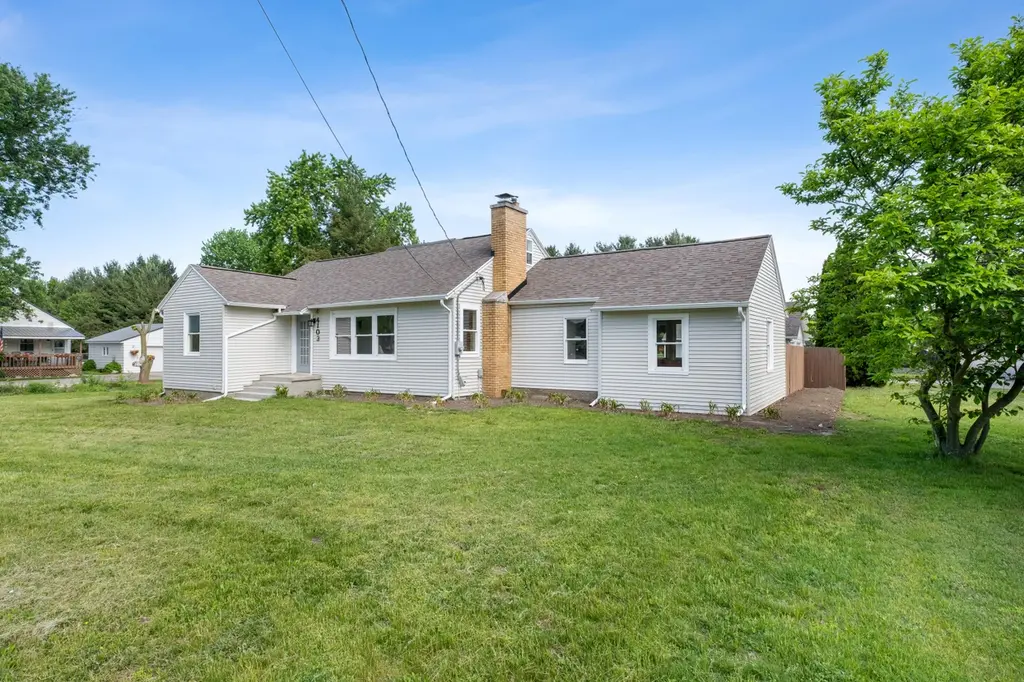
4103 Port Sheldon St · Hudsonville, MI
Flood risk 1/10 · Minimal
- FEMA flood zone
- X (unshaded)
- Chance of flooding over 30 yrs
- 0.0%
- Est. flood insurance / yr
- $507 – $1,088
Fire risk 1/10 · Minimal
- Est. fire insurance / yr
- $784 – $1,456
Heat risk 2/10 · Minimal
- Hot days now (above 95°F)
- 7 days/yr
- Hot days in 30 yrs
- 16 days/yr
Wind risk 2/10 · Minimal
- Chance of severe wind over 30 yrs
- —
Air-quality risk 2/10 · Minimal
- Unhealthy air days now
- 1 days/yr
- Unhealthy air days in 30 yrs
- 1 days/yr
Risk factors via First Street. Map © Google.
Why this score? — see what drove the D- grade
The composite is a weighted blend of 9 inputs, each scored 0–100. Each bar is that input's sub-score; the figure is the points it added to the 100-point composite (weight × sub-score).
- ARV discount +9.8/15.0
- Cash flow +8.8/30.0
- Schools +5.5/10.0
- Livability +4.0/5.0
- Rent growth +2.5/5.0
- Condition / age +2.5/5.0
- DSCR +2.4/10.0
- 1% rule +2.2/10.0
- Appreciation +0.0/10.0
$349,900
🖨 Deal sheet 📄 Offer letter ✓ Due diligence
Listing remarks MLS
This beautifully remodeled Hudsonville home is a must see! Main floor has 2 bedrooms, 2 full baths, living room with fireplace, kitchen and dining room that flows into an enormous family room. Upstairs the entire attic could be used as a bedroom, or office / play room. The basement sports a large finished room with egress window for a 4th bedroom or rec room. The oversized fenced backyard with concrete patio is perfect for entertaining and keeping kids and pets safe. What is unique about this house is it shares a driveway with the church, which gives you easy access to the neighborhood and a short bike ride to Rush Creek Park. Directly behind the yard is the church's preschool playground. Hudsonville Schools, with low Georgetown property taxes!Renovations include: new roof, remodeled attic, new flooring and lighting, some new windows, tastefully painted inside and out, remodeled kitchen, beautiful new tiled bathrooms. Offers are due by June 8, Monday at 2 pm.
Key facts
- Remodeled attic
- Remodeled kitchen
- New flooring
Tags
Property features AI
Exterior
- Parking: Detached 2-car garage; Detached parking
- Utilities: Public water; Natural gas connected
- Home design: Cape Cod style; Single-family residence
- Construction: Built in 1950; Aluminum siding; Composition shingle roof; Crawl space and full basement
- Exterior features: Paved road access; 0.39-acre lot
Interior
- Kitchen: Dishwasher; Disposal; Microwave; Oven; Refrigerator
- Bedrooms: Primary bedroom; Bedroom 2; Bedroom 3; Bedroom 4
- Bathrooms: 2 full bathrooms
- Heating & cooling: Forced air heating; Has cooling
- Interior features: Garage door opener; Eat-in kitchen; Replacement windows; Fireplace; 8 total rooms
- Laundry & utility: Natural gas water heater
Neighborhood map
What this means for you Summary
Snapshot
- This is a 4-bed/2.0-bath single-family listed at $350k.
Deal economics
- At list price, monthly cash flow is $-286 ($-3k/yr) — negative.
- To cash-flow at today's rent, offer at most $299k (14.4% below list).
- To meet the 1% rule (rent ≥ 1% of price), the offer needs to be $251k (28.2% below list).
- Recommended offer: $251k (28.2% below list) — sets the bar for 1% rule.
- Cap rate 5.3% vs local median 3.6% in Hudsonville — top-decile yield for the area; either an underpriced asset or a hidden risk that comps aren't pricing in. Stress-test before assuming the spread holds.
Location & tenants
- Location reads 80/100 on livability (#79 in MI, #1,690 nationally) — a professional / high-income tenant draw. Strengths: schools A+, cost of living A+, housing A+; Watch: amenities F, commute F.
- Hudsonville Public School District (suburban): math 55% / reading 70% proficiency, ranked #32 of 540 in MI (top 6%) — acceptable for families but not a draw, mixed tenant base, ~2y average lease; only 15% free/reduced lunch — higher-income household profile.
- Market conditions: 212 active listings in the ZIP; 2 comparable units currently listed for rent nearby; high-income renter base; 1,237 units permitted in Ottawa County in 2024 (443 in 5+ unit buildings).
Forward outlook
- Local home prices are declining (-3.0%/yr); year-one equity from $2k of loan paydown is wiped out by about $10k of value loss. Plan a longer hold.
- Ottawa County population projected at +24% by 2050 — long-run rental-demand tailwind backs the buy-and-hold thesis.
Negotiation context
- Only 10 days on market — expect competitive offers; lowballing is unlikely to land.
- 13 sale attempts since 37y ago with the ask held roughly flat each time — persistent listings suggest the price (not the market) is what's stuck; bring a comps-based counter.
- Current owner paid $122k; list at $350k implies a 188% gain — meaningful room to come down on a strong offer.
Risks & watch-outs
- Watch-outs: built in 1950 — expect roof / HVAC / electrical / plumbing capex.
Questions for the listing agent
- What do current leases actually rent for vs. the listed asking? Can we see a recent rent roll and the last 12 months of T-12 income?
- Built in 1950 — when were the roof, HVAC, electrical panel, plumbing, and water heater last replaced?
- Is there a deadline driving the sale (1031 exchange, divorce, estate, relocation)? That informs how much negotiation room exists.
- Schools are A-rated — typically a magnet for longer-tenancy family renters. What's the average tenant stay here, and is there a school-zone premium baked into asking?
- The area grade is low — what's the realistic commute time and amenity access for the typical tenant pool here? Any planned neighborhood developments (good or bad) we should know about?
- What's the average days-on-market for RENTAL listings here right now (not sales)? A rising rental-DOM trend means longer vacancies and softer asking-rent achievability than the comps imply.
- What's the recent tenant-quality profile in this submarket — average credit score on applications, eviction rate, late-payment / NSF rate, and stable-employment percentage? A property-management company in the area should have these aggregated.
- How much new for-sale + rental construction is in the pipeline within 1–3 miles? Heavy new supply typically softens prices + rents 12–24 months out; constrained supply supports both.
Investment metrics
- 1% rule
- 0.72% ✗
- Cap rate
- 5.31%
- Cash-on-cash
- -3.50%
- DSCR
- 0.84
- GRM
- 11.6
CMA / ARV
- ARV (on-the-fly)
- $368,722
- Comps found
- 12
Show comp detail 12 sales within ~0.75 mi
| Address | Dist | Beds/Ba | Sqft | Sold | Price | $/sf | Match |
|---|---|---|---|---|---|---|---|
| 3976 Port Sheldon St | 0.20mi | 4/1.0 | 1,684 (-2%) | 9mo | $334,500 | $199 | 75 |
| 4082 Marion St | 0.40mi | 4/2.0 | 1,776 (+3%) | 3mo | $370,000 | $208 | 74 |
| 3651 Black Creek Dr | 0.50mi | 3/2.0 (-1) | 1,754 (+2%) | 3mo | $372,500 | $212 | 66 |
| 3970 Brookfield Dr | 0.23mi | 4/2.0 | 1,948 (+13%) | 3mo | $357,400 | $183 | 65 |
| 6487 36th Ave | 0.63mi | 4/2.0 | 1,776 (+3%) | 1mo | $330,000 | $186 | 64 |
| 3808 Port Sheldon St | 0.41mi | 4/1.5 | 1,596 (-7%) | 6mo | $325,000 | $204 | 62 |
| 6328 Summerhill Dr | 0.26mi | 5/4.0 (+1) | 1,589 (-8%) | 0mo | $600,000 | $378 | 62 |
| 3852 Pebblefield Dr | 0.34mi | 3/2.0 (-1) | 1,560 (-10%) | 10mo | $364,000 | $233 | 56 |
| 4656 Stonewood Ct | 0.71mi | 4/3.5 | 1,778 (+3%) | 4mo | $428,000 | $241 | 52 |
| 4372 Shady Oak Ct | 0.48mi | 3/1.5 (-1) | 1,512 (-12%) | 9mo | $399,900 | $264 | 43 |
| 6888 Gettysburg Dr | 0.66mi | 3/2.5 (-1) | 1,566 (-9%) | 5mo | $335,000 | $214 | 43 |
| 6898 Georgetown Ave | 0.62mi | 3/1.5 (-1) | 1,511 (-12%) | 1mo | $362,500 | $240 | 42 |
Match score weights: distance 35% · size 25% · config 20% · recency 20%. Top-matched comps best support the ARV.
Projected returns pro-forma
-3.0% appreciation · 3.0% rent growth · sell at horizon
- IRR
- -22.2%
- Equity multiple
- 0.23×
- Total profit
- $-74,960
- Equity at exit
- $52,171
- IRR
- -16.3%
- Equity multiple
- 0.09×
- Total profit
- $-88,937
- Equity at exit
- $30,253
Cash invested: $97,972 (down + closing). Projections, not guarantees.
Landlord ↔ Tenant lean methodology
- Overall (STATE)
- 62 Landlord-Friendly
- State Michigan
- 62 Landlord-Friendly · EVEN
- County
- — inherits STATE
- City
- — inherits STATE
ZIP-level market 49426
- Home prices YoY
- -30.9%
- Active inventory
- 212
- Price-to-rent
- 11.6×
Monthly cashflow live
- Estimated rent
- $2,511 medium interval (Pro) →
- Mortgage (P&I)
- −$1,835
- Tax from tax record
- −$289 /mo · $3,470/yr
- Insurance
- −$146
- HOA
- −$0
- Vacancy / Maint / Mgmt
- −$527
- Net cashflow
- $-286
Break-even live
UW: 25.0% down · 7.5% · 30yr · 1.5% tax · 5.0% vac · 8.0% maint · 8.0% mgmt
Financing live
Cash to close
- Down payment
- $87,475
- Closing costs
- $10,497
- Reserves months
- —
- Total cash needed
- —
Loan-product check · same deal, 3 products live
Conventional
25% down · 7.5% · 30yr
- Down + closing
- —
- Monthly P&I
- —
- Monthly cashflow
- —
- DSCR
- —
- Eligible?
- —
Personal DTI + credit; lowest rate.
DSCR
20% down · 8.5% · 30yr
- Down + closing
- —
- Monthly P&I
- —
- Monthly cashflow
- —
- DSCR
- —
- Eligible?
- —
No personal income docs; deal must DSCR.
Hard money
10% down · 12.0% · 12mo
- Down + closing
- —
- Monthly P&I
- —
- Monthly cashflow
- —
- DSCR
- —
- Eligible?
- —
Short-term bridge; refi at stabilization.
Rent comps 2 comps
| Address | Beds | Baths | Sqft | Rent | $/sqft | DOM | Units | Dist |
|---|---|---|---|---|---|---|---|---|
| 3281 Oak St Unit 3281 Hudsonville, MI | 3.0 | 1.5 | 1260 | $1,800 | $1.43 | 14d | 1 | 1.44mi |
| 5875 Balsam Dr Hudsonville, MI | 1.0–3.0 | 1.0–2.5 | 1050 | $2,463 | $2.35 | 2d | 13 | 1.45mi |
Listing history 7 events
-
2026-06-09status $349,900 Pending 10 DOM
-
2026-06-08days on market $349,900 Active 10 DOM
-
2026-06-07days on market $349,900 Active 9 DOM
-
2026-06-03days on market $349,900 Active 5 DOM
-
2026-06-03days on market $349,900 Active 4 DOM
-
2026-06-01days on market $349,900 Active 3 DOM
-
2026-05-31days on market $349,900 Active 2 DOM
ⓘ Source: listings_history table (triggers on properties + properties_extension) + one-shot
backfill from property_details.listing_events for pre-trigger history.
Tax reassessment forecast MI · Partial reset (capped growth)
- Current annual tax
- $3,470 · $289/mo
- Projected year-2 tax
- $4,429 · $369/mo
- Expected delta
- +$959/yr (+$80/mo · 27.7%)
ⓘ Screening estimate from a state-policy table — verify with the county assessor before closing.
Climate risk First Street
- Flood 1/10 Low FEMA zone X (unshaded) · 0% chance over 30 yrs
- Wildfire 1/10 Low
- Heat 2/10 Low 7 d/yr ≥95°F today · 16 d/yr by 30 yrs out
- Wind 2/10 Low
- Air quality 2/10 Low 1 unhealthy d/yr today · 1 by 30 yrs out
Nearby sold comps map
Loading sold comps map…
Walkable amenities ~0.75 mi
Loading nearby amenities…
Taxation est. · year 1
- Rental income
- $30,136
- − Mortgage interest
- −$19,600
- − Property taxes
- −$3,470
- − Insurance
- −$1,750
- − Repairs & maintenance
- −$2,411
- − Management
- −$2,411
- − Depreciation
- −$10,179
- Taxable loss
- −$9,684
- Est. tax savings @ 24.0%
- +$2,324
- After-tax cash flow
- $-1,107/yr
For passive investors: Depreciation is non-cash, so a rental often shows a tax loss while cash-flowing — sheltering income. Rental losses are passive: they offset passive income freely, and up to $25,000/yr can offset ordinary (W-2) income if you actively participate and your MAGI is under $100k (phasing out to $0 by $150k); unused losses carry forward. On sale, claimed depreciation is recaptured at up to 25%, and gains may owe capital-gains tax (a 1031 exchange can defer both). Figures are a year-1 estimate at your 24.0% rate — not tax advice; consult a CPA.
Schools (NCES district)
- District
- Hudsonville Public School District
- NCES district ID
- 2618840
- Math proficiency
- 55% ▼ -10.00%
- Reading proficiency
- 70% ▼ -4.00%
- Median HH income
- $69,784
- Composite
- 54.98/100
- National rank
- #1301
- State rank
- #32 of 540 in MI
Livability — Hudsonville
- Score
- 80/100
- State rank
- #79
- US rank
- #1690
Category grades
Schools grade is shown separately in the Schools card above.
Census & demographics
- County
- Ottawa County · 144,142 people
- City population
- 40,523
- Metro
- Grand Rapids-Kentwood, MI
- Population (ZIP)
- 40,523
- Household income
- $112,234
- Rent vs Own
- Severe rent burden
- 149.0
Population outlook (Ottawa County) Hauer SSP2
- Today (2025)
- 313,561 people
- By 2030
- 330,027 · +5.3%
- By 2040
- 361,118 · +15.2%
- By 2050
- 388,414 · +23.9%
- By 2075
- 452,175 · +44.2%
- By 2100
- 473,041 · +50.9%
Race, ethnicity, and origin ACS 2023
- Neighborhood character
- Predominantly White (92%)
- Race & ethnicity
- White 92% Two or more races 4% Hispanic / Latino 4% Asian 2%
- Common ancestry
- Iranian 43% Romanian 5% Lithuanian 2%
- Foreign-born
- 3% · Canada
- Languages at home
- 97% English-only · Spanish 1% German/W. Germanic 1%
Political lean MEDSL · Ottawa
- 2024 margin
- Strong R (+20.4) · D 39.0% · R 59.5% · Other 1.5%
- 2008→2024 swing
- +3.4pp toward D · 2008: -23.9pp · 2024: -20.4pp
- All cycles
- 2024: R+20.4 2020: R+21.5 2016: R+30.4 2012: R+34.2 2008: R+23.9
Not yet ingested
- Civics
- —
Market trends
- HPI YoY
- ▼ -116.09%
- Current HPI
- 259.442
- Rent YoY
- —
- Metro
- Grand Rapids-Kentwood, MI
- State GDP YoY
- ▲ 1.37%
- F500 in state
- 28
Industry mix (Fortune 500 HQ in MI)
| Industry | F500 HQs | Revenue |
|---|---|---|
| Automotive Parts | 3 | $48B |
|
||
| Automotive | 2 | $372B |
|
||
| Chemicals | 1 | $45B |
|
||
| Automotive Retail | 1 | $29B |
|
||
| Healthcare / Medical Devices | 1 | $23B |
|
||
| Automotive Technology | 1 | $20B |
|
||
Price history
+355.0% since first listed21 events — show timeline
- 2026-05-30 Listed $349,900 MiRealSource-MiMLS
- 2026-05-30 Listed $349,900 REALCOMP
- 2026-05-30 Listed $349,900 SW Michigan MLS
- 2014-09-23 Listing Removed — SW Michigan MLS
- 2014-09-23 Listing Removed — SW Michigan MLS
- 2004-04-16 Sold (MLS) $121,500 REALCOMP
- 2004-04-16 Sold (MLS) $121,500 SW Michigan MLS
- 2003-11-18 Listed $125,900 REALCOMP
- 2003-11-18 Listed $125,900 SW Michigan MLS
- 2003-11-02 Listing Removed — REALCOMP
- 2003-09-23 Listed $129,900 REALCOMP
- 2003-09-23 Listed $129,900 SW Michigan MLS
- 2001-11-21 Listing Removed — REALCOMP
- 2001-10-03 Listed $121,900 REALCOMP
- 2001-10-03 Listed $121,900 SW Michigan MLS
- 1996-05-07 Sold (MLS) $79,900 REALCOMP
- 1996-05-07 Sold (MLS) $79,900 SW Michigan MLS
- 1995-11-09 Listed $84,900 REALCOMP
- 1995-11-09 Listed $84,900 SW Michigan MLS
- 1989-02-13 Listed $76,900 REALCOMP
- 1989-02-13 Listed $76,900 SW Michigan MLS
Property tax history
+3.0%/yrLatest (2025): $3,470 · +3.6% YoY. Source: county tax records.
Cash-flow waterfall
monthlySold comps — $/sqft
last 12 mo · ≤1 miLoading sold comps…