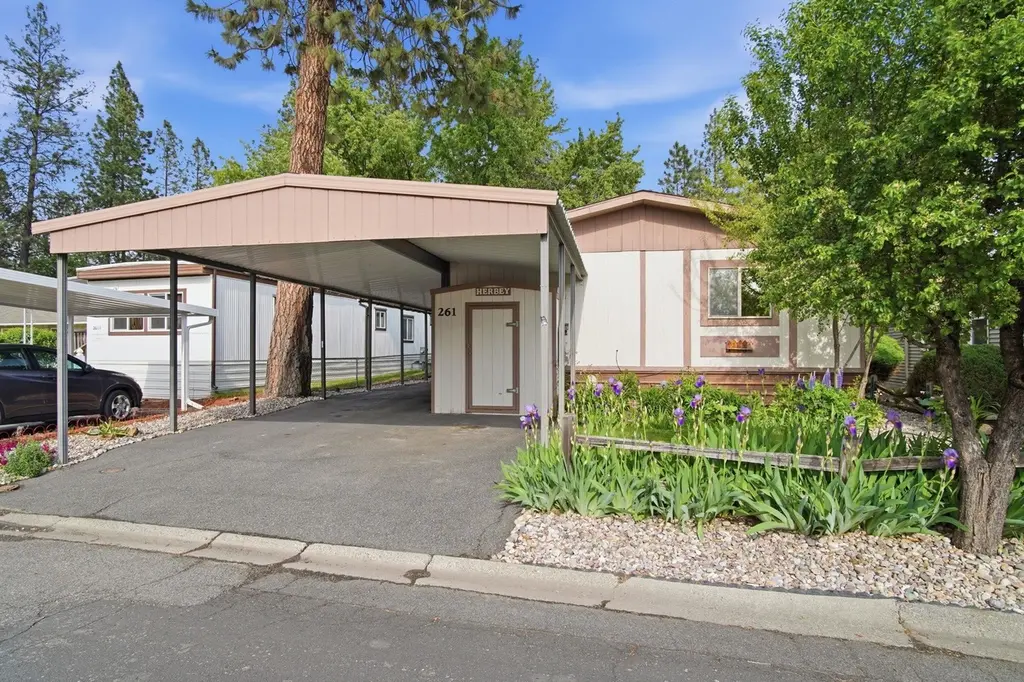
2311 W 16th Ave #261 · Spokane, WA
Flood risk 1/10 · Minimal
- FEMA flood zone
- X (unshaded)
- Chance of flooding over 30 yrs
- 0.0%
- Est. flood insurance / yr
- $507 – $1,088
Fire risk 6/10 · Moderate
- Est. fire insurance / yr
- $604 – $1,122
Heat risk 3/10 · Minor
- Hot days now (above 93°F)
- 7 days/yr
- Hot days in 30 yrs
- 15 days/yr
Wind risk 1/10 · Minimal
- Chance of severe wind over 30 yrs
- —
Air-quality risk 9/10 · Severe
- Unhealthy air days now
- 13 days/yr
- Unhealthy air days in 30 yrs
- 16 days/yr
Risk factors via First Street. Map © Google.
Why this score? — see what drove the B grade
The composite is a weighted blend of 9 inputs, each scored 0–100. Each bar is that input's sub-score; the figure is the points it added to the 100-point composite (weight × sub-score).
- Cash flow +30.0/30.0
- DSCR +10.0/10.0
- 1% rule +9.3/10.0
- ARV discount +7.4/15.0
- Schools +4.6/10.0
- Livability +4.0/5.0
- Rent growth +2.9/5.0
- Condition / age +2.5/5.0
- Appreciation +0.0/10.0
$120,000
🖨 Deal sheet 📄 Offer letter ✓ Due diligence
Listing remarks MLS
Very well maintained 1986 MFG Home in wonderful Cascade Park 55+ with lots of amenities and fun things to do. 3B, 2B, Fmrm, formal dining great kitchen, 3 solar tubes to give off natural light. Furnace and A/C 4 years old. Newer vinyl windows thru-out. Newer appliances in kitchen. Exterior painted 2009, 2 sheds 3 car carport. Wonderful yard, on canyon. Must see!!
Key facts
- Fitness center
- Open living space
- Private retreat
Tags
Property features AI
Finance
- HOA & community: Located in Cascade MHC (land-lease community); Monthly land lease: $699
Exterior
- Parking: Carport (3 spaces)
- Home design: Manufactured home; Skirted foundation
- Construction: Siding exterior; Composition roof
- Exterior features: Deck; Patio; Paved road frontage; Community pool
Interior
- Kitchen: Free-standing range; Dishwasher; Refrigerator
- Bedrooms: 3 bedrooms
- Heating & cooling: Electric forced-air heating; Central air conditioning
- Interior features: Utility room; No basement
- Laundry & utility: Washer; Dryer
Neighborhood map
What this means for you Summary
Snapshot
- This is a 3-bed/2.0-bath manufactured listed at $120k.
Deal economics
- At list price, monthly cash flow is $599 ($7k/yr) — positive.
- The deal already cash-flows at list — no discount required.
- Meets the 1% rule at list price ($2k rent vs $120k).
- Recommended offer: $118k (1.5% below list) — sets the bar for market timing.
- Cap rate 12.3% vs local median 3.2% in Spokane — top-decile yield for the area; either an underpriced asset or a hidden risk that comps aren't pricing in. Stress-test before assuming the spread holds.
Location & tenants
- Location reads 80/100 on livability (#93 in WA, #1,822 nationally) — a professional / high-income tenant draw. Strengths: amenities A+, commute A+, housing A+; Watch: crime F.
- Spokane School District (urban): math 47% / reading 58% proficiency, ranked #136 of 291 in WA (top 47%) — acceptable for families but not a draw, mixed tenant base, ~2y average lease.
- Zoned schools: Wilson Elementary (360 students, 25% FRL); Lewis & Clark High School (1,739 students, 38% FRL) — zoned schools average 32% FRL vs 50% district-wide (18 pts lower); this property's tenant base skews higher-income than the district average.
- Market conditions: Rents rising (+1.5%/yr); 381 active listings in the ZIP; 19 comparable units currently listed for rent nearby; rentals at typical pace (median 23d on market — plan ~3-4 weeks tenant-placement turnaround); solid renter incomes; 3,608 units permitted in Spokane County in 2024 (1,792 in 5+ unit buildings).
Forward outlook
- Local home prices are declining (-3.0%/yr); year-one equity from $830 of loan paydown is wiped out by about $4k of value loss. Plan a longer hold.
- Spokane County population projected at +13% by 2050 — modest demand growth; plan on rents tracking national, not racing it.
- At projected returns (-3.0% appreciation + 1.5% rent growth), your $34k cash investment doubles in ~7 years — after that, you're playing with house money.
Negotiation context
- It's been on market 20 days — a 2% lower offer ($118k) is reasonable based on typical stale-listing flexibility.
- 4 sale attempts since 17y ago with the ask held roughly flat each time — persistent listings suggest the price (not the market) is what's stuck; bring a comps-based counter.
- Current owner paid $50k; list at $120k implies a 140% gain — meaningful room to come down on a strong offer.
Risks & watch-outs
- Climate carrying-cost: major wildfire risk — expect insurance premiums to compound above CPI over the hold.
Questions for the listing agent
- Is there a deadline driving the sale (1031 exchange, divorce, estate, relocation)? That informs how much negotiation room exists.
- Schools are B-rated — typically a magnet for longer-tenancy family renters. What's the average tenant stay here, and is there a school-zone premium baked into asking?
- Crime grade is F in this area — have there been break-ins, vandalism, or insurance claims at this property in the last 3 years? What carrier currently insures it and at what premium?
- What's the average days-on-market for RENTAL listings here right now (not sales)? A rising rental-DOM trend means longer vacancies and softer asking-rent achievability than the comps imply.
- What's the recent tenant-quality profile in this submarket — average credit score on applications, eviction rate, late-payment / NSF rate, and stable-employment percentage? A property-management company in the area should have these aggregated.
- How much new for-sale + rental construction is in the pipeline within 1–3 miles? Heavy new supply typically softens prices + rents 12–24 months out; constrained supply supports both.
Investment metrics
- 1% rule
- 1.43% ✓
- Cap rate
- 12.29%
- Cash-on-cash
- 21.41%
- DSCR
- 1.95
- GRM
- 5.8
CMA / ARV
- ARV (on-the-fly)
- $119,712
- Comps found
- 12
Show comp detail 12 sales within ~0.75 mi
| Address | Dist | Beds/Ba | Sqft | Sold | Price | $/sf | Match |
|---|---|---|---|---|---|---|---|
| 2311 W 16th Ave #267 | 0.05mi | 3/2.0 | 1,344 (-3%) | 3mo | $105,000 | $78 | 89 |
| 2311 W 16th Ave #187 | 0.09mi | 3/2.0 | 1,456 (+5%) | 2mo | $140,000 | $96 | 86 |
| 2311 W 16th Ave #231 | 0.09mi | 3/2.0 | 1,456 (+5%) | 3mo | $104,000 | $71 | 86 |
| 2311 W 16th Ave #169 | 0.10mi | 3/2.0 | 1,344 (-3%) | 10mo | $115,000 | $86 | 81 |
| 2311 W 16th #240 Ave | 0.11mi | 3/2.0 | 1,488 (+7%) | 4mo | $98,000 | $66 | 80 |
| 2311 W 16th Ave #273 | 0.10mi | 3/2.0 | 1,456 (+5%) | 12mo | $155,000 | $106 | 78 |
| 2311 W 16th Ave #37 | 0.33mi | 3/2.0 | 1,344 (-3%) | 1mo | $149,000 | $111 | 78 |
| 2311 W 16th Ave #50 | 0.28mi | 2/2.0 (-1) | 1,410 (+1%) | 3mo | $29,000 | $21 | 77 |
| 2311 W 16th Ave #210 | 0.07mi | 3/2.0 | 1,456 (+5%) | 16mo | $136,000 | $93 | 76 |
| 2311 W 16th Ave #302 | 0.12mi | 2/2.0 (-1) | 1,272 (-9%) | 3mo | $76,200 | $60 | 72 |
| 2311 W 16th Ave #194 | 0.09mi | 2/2.0 (-1) | 1,534 (+10%) | 13mo | $99,000 | $65 | 63 |
| 2311 W 16th Ave #17 | 0.22mi | 3/2.0 | 1,522 (+9%) | 14mo | $135,000 | $89 | 62 |
Match score weights: distance 35% · size 25% · config 20% · recency 20%. Top-matched comps best support the ARV.
Projected returns pro-forma
-3.0% appreciation · 1.52% rent growth · sell at horizon
- IRR
- 12.3%
- Equity multiple
- 1.48×
- Total profit
- $16,189
- Equity at exit
- $17,892
- IRR
- 20.1%
- Equity multiple
- 2.58×
- Total profit
- $53,130
- Equity at exit
- $10,375
Cash invested: $33,600 (down + closing). Projections, not guarantees.
Landlord ↔ Tenant lean methodology
- Overall (STATE)
- 28 Tenant-Leaning
- State Washington
- 28 Tenant-Leaning · D+8
- County
- — inherits STATE
- City
- — inherits STATE
ZIP-level market 99224
- Home prices YoY
- -29.4%
- Rents YoY
- 1.5%
- Active inventory
- 381
- Price-to-rent
- 5.8×
Monthly cashflow live
- Estimated rent
- $1,720 high interval (Pro) →
- Mortgage (P&I)
- −$629
- Tax from tax record
- −$80 /mo · $964/yr
- Insurance
- −$50
- HOA
- −$0
- Vacancy / Maint / Mgmt
- −$361
- Net cashflow
- $599
Break-even live
UW: 25.0% down · 7.5% · 30yr · 1.5% tax · 5.0% vac · 8.0% maint · 8.0% mgmt
Financing live
Cash to close
- Down payment
- $30,000
- Closing costs
- $3,600
- Reserves months
- —
- Total cash needed
- —
Loan-product check · same deal, 3 products live
Conventional
25% down · 7.5% · 30yr
- Down + closing
- —
- Monthly P&I
- —
- Monthly cashflow
- —
- DSCR
- —
- Eligible?
- —
Personal DTI + credit; lowest rate.
DSCR
20% down · 8.5% · 30yr
- Down + closing
- —
- Monthly P&I
- —
- Monthly cashflow
- —
- DSCR
- —
- Eligible?
- —
No personal income docs; deal must DSCR.
Hard money
10% down · 12.0% · 12mo
- Down + closing
- —
- Monthly P&I
- —
- Monthly cashflow
- —
- DSCR
- —
- Eligible?
- —
Short-term bridge; refi at stabilization.
Rent comps 19 comps
| Address | Beds | Baths | Sqft | Rent | $/sqft | DOM | Units | Dist |
|---|---|---|---|---|---|---|---|---|
| 2610 W Westwood Ln Spokane, WA | 2.0 | 1.0–2.0 | 764 | $1,680 | $2.20 | 13d | 24 | 0.36mi |
| 1619 W 13th Ave Spokane, WA | 4.0 | 3.0 | 1800 | $2,650 | $1.47 | 23d | 1 | 0.63mi |
| 1739 W Tenth Ave Spokane, WA | 4.0 | 1.0 | 1228 | $1,500 | $1.22 | 13d | 1 | 0.75mi |
| 1711 W Tenth Ave Apt 2 Spokane, WA | 2.0 | 1.0 | 1000 | $1,250 | $1.25 | 23d | 1 | 0.76mi |
| 1611 W 8th Ave Apt 2 Spokane, WA | 2.0 | 1.0 | 900 | $1,195 | $1.33 | 13d | 1 | 0.91mi |
| 1119 W 11th Ave Spokane, WA | 3.0 | 2.0 | 971 | $1,625 | $1.67 | 23d | 1 | 0.95mi |
| 1405 W 8th Ave Unit 4 Spokane, WA | 2.0 | 1.0 | 900 | $1,195 | $1.33 | 13d | 1 | 0.98mi |
| 3720 W Grandview Ave Unit B Spokane, WA | 2.0 | 1.0 | 1400 | $1,795 | $1.28 | 43d | 1 | 1.06mi |
| 904 W Lincoln Pl Unit 2 Spokane, WA | 2.0 | 1.0 | 885 | $1,245 | $1.41 | 23d | 1 | 1.25mi |
| 612 S Lincoln St Spokane, WA | 1.0–2.0 | 1.0 | 871 | $1,700 | $1.95 | 13d | 1 | 1.30mi |
| 155 S Oak St Spokane, WA | 1.0–2.0 | 1.0 | 825 | $1,180 | $1.43 | 23d | 1 | 1.31mi |
| 620 W 7th Ave #403 Spokane, WA | 3.0 | 2.0 | 1202 | $1,295 | $1.08 | 23d | 1 | 1.41mi |
| 615 W 6th Ave Unit A Spokane, WA | 2.0 | 1.0 | 900 | $1,150 | $1.28 | 23d | 1 | 1.43mi |
| 1306 S Westcliff Pl Spokane, WA | 3.0 | 2.5 | 1328 | $1,995 | $1.50 | 13d | 1 | 1.43mi |
| 524 W 7th Ave Spokane, WA | 2.0 | 1.0 | 812 | $1,900 | $2.34 | 23d | 3 | 1.44mi |
| 707 W 5th Ave Spokane, WA | 2.0 | 1.0 | 716 | $1,786 | $2.49 | 13d | 10 | 1.45mi |
| 608 S Stevens St Spokane, WA | 1.0–2.0 | 1.0 | 961 | $1,350 | $1.40 | 13d | 6 | 1.49mi |
| 608 S Stevens St Unit 202 Spokane, WA | 2.0 | 1.0 | 1090 | $1,350 | $1.24 | 23d | 1 | 1.49mi |
| 34 W 26th Ave Spokane, WA | 3.0 | 2.0 | 1664 | $2,600 | $1.56 | 21d | 1 | 1.49mi |
Listing history 15 events
-
2026-06-18status $120,000 Active 20 DOM
-
2026-06-08status $120,000 Pending 20 DOM
-
2026-06-07days on market $120,000 Active 20 DOM
-
2026-06-03days on market $120,000 Active 16 DOM
-
2026-06-02days on market $120,000 Active 15 DOM
-
2026-06-01days on market $120,000 Active 14 DOM
-
2026-05-31days on market $120,000 Active 13 DOM
-
2026-05-31days on market $120,000 Active 12 DOM
-
2026-05-18$120,000 Active
-
2025-09-11price $120,000
-
2025-08-14$130,000 Active
-
2010-07-02soldstatus $50,000 365-char remark
Show marketing remark (365 chars)
Very well maintained 1986 MFG Home in wonderful Cascade Park 55+ with lots of amenities and fun things to do. 3B, 2B, Fmrm, formal dining great kitchen, 3 solar tubes to give off natural light. Furnace and A/C 4 years old. Newer vinyl windows thru-out. Newer appliances in kitchen. Exterior painted 2009, 2 sheds 3 car carport. Wonderful yard, on canyon. Must see!!
-
2010-04-12$52,500 365-char remark
Show marketing remark (365 chars)
Very well maintained 1986 MFG Home in wonderful Cascade Park 55+ with lots of amenities and fun things to do. 3B, 2B, Fmrm, formal dining great kitchen, 3 solar tubes to give off natural light. Furnace and A/C 4 years old. Newer vinyl windows thru-out. Newer appliances in kitchen. Exterior painted 2009, 2 sheds 3 car carport. Wonderful yard, on canyon. Must see!!
-
2010-04-11historical
-
2009-10-10$55,000
ⓘ Source: listings_history table (triggers on properties + properties_extension) + one-shot
backfill from property_details.listing_events for pre-trigger history.
Tax reassessment forecast WA · Resets to sale price
- Current annual tax
- $964 · $80/mo
- Projected year-2 tax
- $1,176 · $98/mo
- Expected delta
- +$212/yr (+$18/mo · 22.0%)
ⓘ Screening estimate from a state-policy table — verify with the county assessor before closing.
Climate risk First Street
- Flood 1/10 Low FEMA zone X (unshaded) · 0% chance over 30 yrs
- Wildfire 6/10 Major
- Heat 3/10 Moderate 7 d/yr ≥93°F today · 15 d/yr by 30 yrs out
- Wind 1/10 Low
- Air quality 9/10 Extreme 13 unhealthy d/yr today · 16 by 30 yrs out
Nearby sold comps map
Loading sold comps map…
Walkable amenities ~0.75 mi
Loading nearby amenities…
Taxation est. · year 1
- Rental income
- $20,643
- − Mortgage interest
- −$6,722
- − Property taxes
- −$964
- − Insurance
- −$600
- − Repairs & maintenance
- −$1,651
- − Management
- −$1,651
- − Depreciation
- −$3,491
- Taxable income
- $5,564
- Est. tax owed @ 24.0%
- −$1,335
- After-tax cash flow
- $5,857/yr
For passive investors: Depreciation is non-cash, so a rental often shows a tax loss while cash-flowing — sheltering income. Rental losses are passive: they offset passive income freely, and up to $25,000/yr can offset ordinary (W-2) income if you actively participate and your MAGI is under $100k (phasing out to $0 by $150k); unused losses carry forward. On sale, claimed depreciation is recaptured at up to 25%, and gains may owe capital-gains tax (a 1031 exchange can defer both). Figures are a year-1 estimate at your 24.0% rate — not tax advice; consult a CPA.
Schools (NCES district)
- District
- Spokane School District
- NCES district ID
- 5308250
- Math proficiency
- 47% ▲ 1.00%
- Reading proficiency
- 58% ▲ 1.00%
- Median HH income
- $43,187
- Composite
- 46.1/100
- National rank
- #5477
- State rank
- #136 of 291 in WA
Livability — Spokane
- Score
- 80/100
- State rank
- #93
- US rank
- #1822
Category grades
Schools grade is shown separately in the Schools card above.
Census & demographics
- Census place
- Spokane, WA
- County
- Spokane County · 496,401 people
- City population
- 298,820
- Metro
- Spokane-Spokane Valley, WA
- Population (ZIP)
- 24,919
- Household income
- $80,770
- Rent vs Own
- Severe rent burden
- 886.0
Population outlook (Spokane County) Hauer SSP2
- Today (2025)
- 531,314 people
- By 2030
- 549,278 · +3.4%
- By 2040
- 577,822 · +8.8%
- By 2050
- 598,188 · +12.6%
- By 2075
- 630,744 · +18.7%
- By 2100
- 622,360 · +17.1%
Race, ethnicity, and origin ACS 2023
- Neighborhood character
- Predominantly White (84%)
- Race & ethnicity
- White 84% Two or more races 7% Hispanic / Latino 5% Asian 3% Black 2% Native American 1%
- Hispanic origin (detail)
- Mexican 4%
- Common ancestry
- Portuguese 4% Romanian 3% Slovak 3%
- Foreign-born
- 7% · Canada, China
- Languages at home
- 91% English-only · Russian/Polish/Slavic 3% Spanish 2% Other Indo-European 1%
Political lean MEDSL · Spokane
- 2024 margin
- Toss-up / Even · D 46.0% · R 51.0% · Other 3.0%
- 2008→2024 swing
- -3.8pp toward R · 2008: -1.1pp · 2024: -5.0pp
- All cycles
- 2024: R+5.0 2020: R+4.3 2016: R+8.3 2012: R+6.3 2008: R+1.1
Not yet ingested
- Civics
- —
Market trends
- HPI YoY
- ▼ -131.96%
- Current HPI
- 317.2242
- Rent YoY
- ▲ 1.52%
- Metro
- Spokane-Spokane Valley, WA
- State GDP YoY
- ▲ 4.65%
- F500 in state
- 22
Industry mix (Fortune 500 HQ in WA)
| Industry | F500 HQs | Revenue |
|---|---|---|
| Retail | 2 | $269B |
|
||
| Technology / Retail | 1 | $638B |
|
||
| Technology | 1 | $245B |
|
||
| Telecommunications | 1 | $38B |
|
||
| Food / Beverage | 1 | $36B |
|
||
| Automotive / Trucks | 1 | $34B |
|
||
Price history
+118.2% since first listed7 events — show timeline
- 2026-05-18 Listed $120,000 SPOKANEMLS as Distributed by MLS Grid
- 2025-09-11 Price Changed $120,000 SPOKANEMLS as Distributed by MLS Grid
- 2025-08-14 Listed $130,000 SPOKANEMLS as Distributed by MLS Grid
- 2010-07-02 Sold (MLS) $50,000 SPOKANEMLS as Distributed by MLS Grid
- 2010-04-12 Listed $52,500 SPOKANEMLS as Distributed by MLS Grid
- 2010-04-11 Listing Removed — SPOKANEMLS as Distributed by MLS Grid
- 2009-10-10 Listed $55,000 SPOKANEMLS as Distributed by MLS Grid
Property tax history
+12.6%/yrLatest (2026): $964 · +58.7% YoY. Source: county tax records.
Cash-flow waterfall
monthlySold comps — $/sqft
last 12 mo · ≤1 miLoading sold comps…