86 Alameda St · Loganville, GA
Flood risk No data
- FEMA flood zone
- —
- Chance of flooding over 30 yrs
- —
- Est. flood insurance / yr
- —
Fire risk No data
- Est. fire insurance / yr
- —
Heat risk No data
- Hot days now (above threshold)
- —
- Hot days in 30 yrs
- —
Wind risk No data
- Chance of severe wind over 30 yrs
- —
Air-quality risk No data
- Unhealthy air days now
- —
- Unhealthy air days in 30 yrs
- —
Risk factors via First Street. Map © Google.
Why this score? — see what drove the C- grade
The composite is a weighted blend of 9 inputs, each scored 0–100. Each bar is that input's sub-score; the figure is the points it added to the 100-point composite (weight × sub-score).
- ARV discount +15.0/15.0
- Cash flow +13.8/30.0
- Condition / age +4.8/5.0
- DSCR +4.2/10.0
- 1% rule +3.9/10.0
- Schools +3.7/10.0
- Livability +3.7/5.0
- Rent growth +3.3/5.0
- Appreciation +0.0/10.0
$269,900
🖨 Deal sheet 📄 Offer letter ✓ Due diligence
Listing remarks
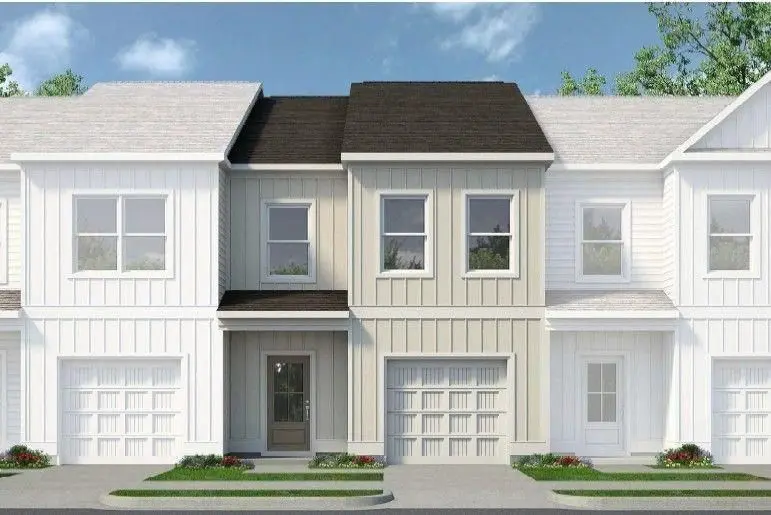
Move-In Ready July! The Pinehurst floorplan in Smith Douglas Homes highly anticipated Fuller Station communitywhere location truly stands out. This spacious townhome offers an open-concept design with upscale finishes throughout, including a kitchen with 42 upper cabinets, a center island, tile backsplash, quartz countertops, and a sleek chrome interior package featuring stylish chrome finishes and upgraded lighting. The family room is anchored by a modern linear fireplace and enhanced with a ceiling fan and designer light fixtures, creating a warm and inviting living space. An open iron rail staircase leads to the second-floor primary suite, highlighted by a tray ceiling and a spa-like ens
Key facts
- Quartz countertops
- Open concept design
- Center island
Tags
Neighborhood map
What this means for you Summary
Snapshot
- This is a 3-bed/2.5-bath single-family listed at $270k. Condition is rated excellent.
Deal economics
- At list price, monthly cash flow is $25 ($297/yr) — positive.
- The deal already cash-flows at list — no discount required.
- To meet the 1% rule (rent ≥ 1% of price), the offer needs to be $239k (11.4% below list).
- Recommended offer: $239k (11.4% below list) — sets the bar for 1% rule.
- Cap rate 6.4% vs local median 4.0% in Loganville — top-decile yield for the area; either an underpriced asset or a hidden risk that comps aren't pricing in. Stress-test before assuming the spread holds.
Location & tenants
- Location reads 74/100 on livability (#39 in GA, #4,689 nationally) — a middle-class / working-renter tenant base. Strengths: crime A+, housing A+, cost of living A-; Watch: amenities F, commute F.
- Gwinnett County (suburban): math 39% / reading 43% proficiency, ranked #32 of 174 in GA (top 18%) — families likely to look elsewhere, expect single-tenant / working-renter base with shorter leases.
- Market conditions: Rents rising (+3.1%/yr); 847 active listings in the ZIP; 29 comparable units currently listed for rent nearby; rentals at typical pace (median 20d on market — plan ~3-4 weeks tenant-placement turnaround); solid renter incomes; 5,607 units permitted in Gwinnett County in 2024 (1,277 in 5+ unit buildings).
- This rent runs 31% of the median local income ($94k/yr) — at the standard rent-burdened threshold; future hikes will face affordability resistance.
Forward outlook
- Local home prices are declining (-3.0%/yr); year-one equity from $2k of loan paydown is wiped out by about $8k of value loss. Plan a longer hold.
- Gwinnett County population projected at +47% by 2050 — long-run rental-demand tailwind backs the buy-and-hold thesis.
Negotiation context
- It's been on market 42 days — a 3% lower offer ($262k) is reasonable based on typical stale-listing flexibility.
Questions for the listing agent
- It's been on market 42 days. Have you received any prior offers? Is the seller open to a 11% concession, seller financing, or rate buy-down credit?
- Is there a deadline driving the sale (1031 exchange, divorce, estate, relocation)? That informs how much negotiation room exists.
- What's the average days-on-market for RENTAL listings here right now (not sales)? A rising rental-DOM trend means longer vacancies and softer asking-rent achievability than the comps imply.
- What's the recent tenant-quality profile in this submarket — average credit score on applications, eviction rate, late-payment / NSF rate, and stable-employment percentage? A property-management company in the area should have these aggregated.
- How much new for-sale + rental construction is in the pipeline within 1–3 miles? Heavy new supply typically softens prices + rents 12–24 months out; constrained supply supports both.
Investment metrics
- 1% rule
- 0.89% ✗
- Cap rate
- 6.40%
- Cash-on-cash
- 0.39%
- DSCR
- 1.02
- GRM
- 9.4
CMA / ARV
- ARV (median comp)
- $387,698
- List price
- $269,900
- Delta
- -30.38%
- Verdict
- UNDERPRICED
- Comps
- 20 within 1.0 mi
Show comp detail 12 sales within ~0.75 mi
| Address | Dist | Beds/Ba | Sqft | Sold | Price | $/sf | Match |
|---|---|---|---|---|---|---|---|
| 1596 Poplarwood Ln | 0.07mi | 3/3.0 | 1,780 (-0%) | 5mo | $390,000 | $219 | 90 |
| 1811 Hayden Mill Ct | 0.43mi | 3/2.5 | 1,689 (-5%) | 1mo | $385,000 | $228 | 70 |
| 941 Garden Oak Ct | 0.33mi | 3/2.5 | 1,662 (-7%) | 6mo | $369,000 | $222 | 68 |
| 850 Ashley Laine Walk | 0.38mi | 3/2.5 | 1,911 (+7%) | 5mo | $397,000 | $208 | 66 |
| 568 Russell Rd | 0.52mi | 3/2.0 | 1,704 (-4%) | 6mo | $228,000 | $134 | 61 |
| 1795 Lawrenceville Suwanee Rd | 0.55mi | 3/2.0 | 1,683 (-6%) | 3mo | $335,000 | $199 | 60 |
| 1798 Lawrenceville Suwanee Rd | 0.50mi | 4/2.0 (+1) | 1,878 (+5%) | 4mo | $440,000 | $234 | 57 |
| 1830 Mckendree Lake Dr | 0.44mi | 3/2.0 | 1,584 (-11%) | 5mo | $350,000 | $221 | 54 |
| 805 Meadowsong Cir | 0.49mi | 4/2.5 (+1) | 2,000 (+12%) | 2mo | $375,000 | $188 | 51 |
| 1425 Wheatfield Dr | 0.56mi | 3/2.0 | 1,597 (-10%) | 6mo | $346,000 | $217 | 50 |
| 664 Stampmill Ct | 0.54mi | 3/2.0 | 2,011 (+13%) | 4mo | $420,000 | $209 | 48 |
| 940 Meadowsong Cir | 0.40mi | 4/2.5 (+1) | 2,042 (+14%) | 7mo | $450,000 | $220 | 46 |
Match score weights: distance 35% · size 25% · config 20% · recency 20%. Top-matched comps best support the ARV.
Projected returns pro-forma
-3.0% appreciation · 3.12% rent growth · sell at horizon
- IRR
- -15.5%
- Equity multiple
- 0.45×
- Total profit
- $-41,832
- Equity at exit
- $40,243
- IRR
- -6.8%
- Equity multiple
- 0.56×
- Total profit
- $-33,058
- Equity at exit
- $23,336
Cash invested: $75,572 (down + closing). Projections, not guarantees.
Landlord ↔ Tenant lean methodology
- Overall (STATE)
- 90 Strongly Landlord-Friendly
- State Georgia
- 90 Strongly Landlord-Friendly · R+3
- County
- — inherits STATE
- City
- — inherits STATE
ZIP-level market 30052
- Home prices YoY
- -31.8%
- Rents YoY
- 3.1%
- Active inventory
- 847
- Price-to-rent
- 9.4×
Monthly cashflow live
- Estimated rent
- $2,392 high interval (Pro) →
- Mortgage (P&I)
- −$1,415
- Tax est. 1.5%
- −$337 /mo · $4,048/yr
- Insurance
- −$112
- HOA
- −$0
- Vacancy / Maint / Mgmt
- −$502
- Net cashflow
- $25
Break-even live
UW: 25.0% down · 7.5% · 30yr · 1.5% tax · 5.0% vac · 8.0% maint · 8.0% mgmt
Financing live
Cash to close
- Down payment
- $67,475
- Closing costs
- $8,097
- Reserves months
- —
- Total cash needed
- —
Loan-product check · same deal, 3 products live
Conventional
25% down · 7.5% · 30yr
- Down + closing
- —
- Monthly P&I
- —
- Monthly cashflow
- —
- DSCR
- —
- Eligible?
- —
Personal DTI + credit; lowest rate.
DSCR
20% down · 8.5% · 30yr
- Down + closing
- —
- Monthly P&I
- —
- Monthly cashflow
- —
- DSCR
- —
- Eligible?
- —
No personal income docs; deal must DSCR.
Hard money
10% down · 12.0% · 12mo
- Down + closing
- —
- Monthly P&I
- —
- Monthly cashflow
- —
- DSCR
- —
- Eligible?
- —
Short-term bridge; refi at stabilization.
Rent comps 29 comps
| Address | Beds | Baths | Sqft | Rent | $/sqft | DOM | Units | Dist |
|---|---|---|---|---|---|---|---|---|
| 830 Meadowsong Cir Lawrenceville, GA | 4.0 | 3.5 | 2156 | $2,300 | $1.07 | 12d | 1 | 0.48mi |
| 1570 Swan Valley Ct Lawrenceville, GA | 4.0 | 2.5 | 2380 | $2,600 | $1.09 | 18d | 1 | 0.49mi |
| 652 Overlook Wood Way Lawrenceville, GA | 4.0 | 2.5 | 2080 | $2,400 | $1.15 | 43d | 1 | 0.60mi |
| 1444 Riverwood Ct Lawrenceville, GA | 3.0 | 2.0 | 1436 | $1,799 | $1.25 | 43d | 1 | 0.64mi |
| 1860 Suwanee Ridge Ct Lawrenceville, GA | 3.0 | 2.0 | 1312 | $1,890 | $1.44 | 24d | 1 | 0.66mi |
| 1909 Suwanee Valley Rd Lawrenceville, GA | 4.0 | 2.5 | 1824 | $2,295 | $1.26 | 43d | 1 | 0.67mi |
| 960 Summit Lake Trl Lawrenceville, GA | 3.0 | 2.0 | 1880 | $2,270 | $1.21 | 5d | 1 | 0.68mi |
| 1021 Orchard Mill Ln Lawrenceville, GA | 3.0 | 2.5 | 2190 | $2,300 | $1.05 | 43d | 1 | 0.71mi |
| 930 Misty Creek Ct Lawrenceville, GA | 3.0 | 2.0 | 1608 | $1,850 | $1.15 | 5d | 1 | 0.73mi |
| 434 Ashwood Dr Lawrenceville, GA | 3.0 | 2.0 | 1374 | $1,801 | $1.31 | 24d | 1 | 0.87mi |
| 1264 Gables View Pl Lawrenceville, GA | 3.0 | 2.5 | 2366 | $2,461 | $1.04 | 5d | 1 | 0.87mi |
| 1570 Twin Bridge Ln Lawrenceville, GA | 4.0 | 2.5 | 2498 | $2,550 | $1.02 | 43d | 1 | 0.87mi |
| 524 Meadowfield Ct Lawrenceville, GA | 4.0 | 2.5 | 2240 | $2,375 | $1.06 | 43d | 1 | 0.92mi |
| 577 Woodland Park Ter Lawrenceville, GA | 3.0 | 2.5 | 1940 | $2,000 | $1.03 | 18d | 1 | 0.98mi |
| 1264 Watercrest Cir Lawrenceville, GA | 3.0 | 3.0 | 1700 | $2,250 | $1.32 | 12d | 1 | 1.01mi |
| 1630 Green Oak Cir Lawrenceville, GA | 4.0 | 2.5 | 2602 | $2,800 | $1.08 | 20d | 1 | 1.04mi |
| 1175 McKendree Church Rd Lawrenceville, GA | 1.0–3.0 | 1.0–2.0 | 1087 | $2,085 | $1.92 | 1d | 43 | 1.06mi |
| 1150 River Overlook Dr Lawrenceville, GA | 4.0 | 2.5 | 2338 | $3,250 | $1.39 | 24d | 1 | 1.11mi |
| 1218 Raleigh Way Lawrenceville, GA | 2.0 | 2.5 | 2410 | $2,530 | $1.05 | 16d | 1 | 1.13mi |
| 1033 Haley Woods Ln Lawrenceville, GA | 4.0 | 2.5 | 1912 | $2,330 | $1.22 | 24d | 1 | 1.21mi |
| 1012 Haley Woods Ct Lawrenceville, GA | 3.0 | 2.5 | 1839 | $2,200 | $1.20 | 2d | 1 | 1.24mi |
| 1047 Haley Woods Ct Unit 1 Lawrenceville, GA | 3.0 | 2.5 | 1839 | $2,300 | $1.25 | 19d | 1 | 1.24mi |
| 1023 Habersham Ln Lawrenceville, GA | 3.0 | 2.0 | 1450 | $1,600 | $1.10 | 43d | 1 | 1.25mi |
| 599 Rivulett Ct Lawrenceville, GA | 3.0 | 2.5 | 1705 | $2,200 | $1.29 | 21d | 1 | 1.26mi |
| 1453 Allison Ct Lawrenceville, GA | 3.0 | 2.0 | 1468 | $2,100 | $1.43 | 24d | 1 | 1.33mi |
| 1000 Duluth Hwy Lawrenceville, GA | 1.0–2.0 | 1.0–2.0 | 1001 | $1,599 | $1.60 | 1d | 20 | 1.39mi |
| 1710 Omie Way Lawrenceville, GA | 4.0 | 3.0 | 2400 | $2,450 | $1.02 | 12d | 1 | 1.39mi |
| 345 Oak Dr , GA | 2.0–4.0 | 2.5 | 1797 | $2,650 | $1.47 | 5d | 61 | 1.45mi |
| 980 Walther Blvd Lawrenceville, GA | 1.0–2.0 | 1.0–2.0 | 1033 | $1,702 | $1.65 | 1d | 57 | 1.49mi |
Listing history 11 events
-
2026-06-09days on market $269,900 Active 42 DOM
-
2026-06-08days on market $269,900 Active 41 DOM
-
2026-06-07days on market $269,900 Active 40 DOM
-
2026-06-04days on market $269,900 Active 37 DOM
-
2026-06-03days on market $269,900 Active 36 DOM
-
2026-06-02days on market $269,900 Active 35 DOM
-
2026-06-01days on market $269,900 Active 34 DOM
-
2026-05-31days on market $269,900 Active 33 DOM
-
2026-05-18price $269,900 1386-char remark
-
2026-05-07price $289,900 1386-char remark
-
2026-04-28$291,470 Active 1386-char remark
ⓘ Source: listings_history table (triggers on properties + properties_extension) + one-shot
backfill from property_details.listing_events for pre-trigger history.
Nearby sold comps map
Loading sold comps map…
Walkable amenities ~0.75 mi
Loading nearby amenities…
Taxation est. · year 1
- Rental income
- $28,709
- − Mortgage interest
- −$15,119
- − Property taxes
- −$4,048
- − Insurance
- −$1,350
- − Repairs & maintenance
- −$2,297
- − Management
- −$2,297
- − Depreciation
- −$7,852
- Taxable loss
- −$4,253
- Est. tax savings @ 24.0%
- +$1,021
- After-tax cash flow
- $1,318/yr
For passive investors: Depreciation is non-cash, so a rental often shows a tax loss while cash-flowing — sheltering income. Rental losses are passive: they offset passive income freely, and up to $25,000/yr can offset ordinary (W-2) income if you actively participate and your MAGI is under $100k (phasing out to $0 by $150k); unused losses carry forward. On sale, claimed depreciation is recaptured at up to 25%, and gains may owe capital-gains tax (a 1031 exchange can defer both). Figures are a year-1 estimate at your 24.0% rate — not tax advice; consult a CPA.
Condition & rehab AI · 1 photo
This move-in ready townhome in the Fuller Station community is in excellent condition with no visible repairs needed. It offers a spacious floor plan and upscale finishes, making it an attractive option for both resale and rental.
Value-add opportunities
- Both Painting — Fresh paint can enhance curb appeal and interior aesthetics
- Both Lighting upgrades — Modern lighting can improve the home's ambiance and energy efficiency
- Both Landscaping enhancements — Aesthetic improvements can boost curb appeal and property value
Renovation cost estimate screening
Value-add ROI direction
- Both Painting — Fresh paint can enhance curb appeal and interior aesthetics ↑
- Both Lighting upgrades — Modern lighting can improve the home's ambiance and energy efficiency ↑
- Both Landscaping enhancements — Aesthetic improvements can boost curb appeal and property value ↑
ⓘ Cost ranges are severity-bucket heuristics (US national rule-of-thumb). Get contractor quotes + a written scope before underwriting a rehab budget.
Schools (NCES district)
- District
- Gwinnett County
- NCES district ID
- 1302550
- Math proficiency
- 39% ▼ -15.00%
- Reading proficiency
- 43% ▼ -10.00%
- Median HH income
- $62,416
- Composite
- 36.5/100
- National rank
- #4648
- State rank
- #32 of 174 in GA
Livability — Loganville
- Score
- 74/100
- State rank
- #39
- US rank
- #4689
Category grades
Schools grade is shown separately in the Schools card above.
Census & demographics
- County
- Walton County · 128,246 people
- City population
- 79,811
- Metro
- Atlanta-Sandy Springs-Alpharetta, GA
- Population (ZIP)
- 79,811
- Household income
- $93,764
- Rent vs Own
- Severe rent burden
- 1174.0
Population outlook (Gwinnett County) Hauer SSP2
- Today (2025)
- 1,106,028 people
- By 2030
- 1,211,414 · +9.5%
- By 2040
- 1,422,277 · +28.6%
- By 2050
- 1,623,204 · +46.8%
- By 2075
- 2,105,240 · +90.3%
- By 2100
- 2,443,321 · +120.9%
Race, ethnicity, and origin ACS 2023
- Neighborhood character
- Diverse neighborhood (Simpson 0.64)
- Race & ethnicity
- White 48% Black 33% Hispanic / Latino 13% Two or more races 7% Asian 2%
- Hispanic origin (detail)
- Mexican 7% Puerto Rican 3% Cuban 1%
- Common ancestry
- Slovak 2% Lithuanian 2% Romanian 1%
- Foreign-born
- 13% · Canada, Jamaica, Vietnam
- Languages at home
- 84% English-only · Spanish 10% French/Haitian/Cajun 1% Other Indo-European 1%
Political lean MEDSL · Gwinnett
- 2024 margin
- D (+16.5) · D 57.6% · R 41.1% · Other 1.2%
- 2008→2024 swing
- +26.8pp toward D · 2008: -10.2pp · 2024: 16.5pp
- All cycles
- 2024: D+16.5 2020: D+18.3 2016: D+5.8 2012: R+9.4 2008: R+10.2
Not yet ingested
- Civics
- —
Market trends
- HPI YoY
- ▼ -98.77%
- Current HPI
- 212.1241
- Rent YoY
- ▲ 3.12%
- Metro
- Atlanta-Sandy Springs-Alpharetta, GA
- State GDP YoY
- ▲ 2.66%
- F500 in state
- 28
Industry mix (Fortune 500 HQ in GA)
| Industry | F500 HQs | Revenue |
|---|---|---|
| Paper / Packaging | 2 | $29B |
|
||
| Retail | 1 | $160B |
|
||
| Transportation / Logistics | 1 | $91B |
|
||
| Airlines | 1 | $62B |
|
||
| Consumer Goods | 1 | $47B |
|
||
| Utilities | 1 | $25B |
|
||
Cash-flow waterfall
monthlySold comps — $/sqft
last 12 mo · ≤1 miLoading sold comps…