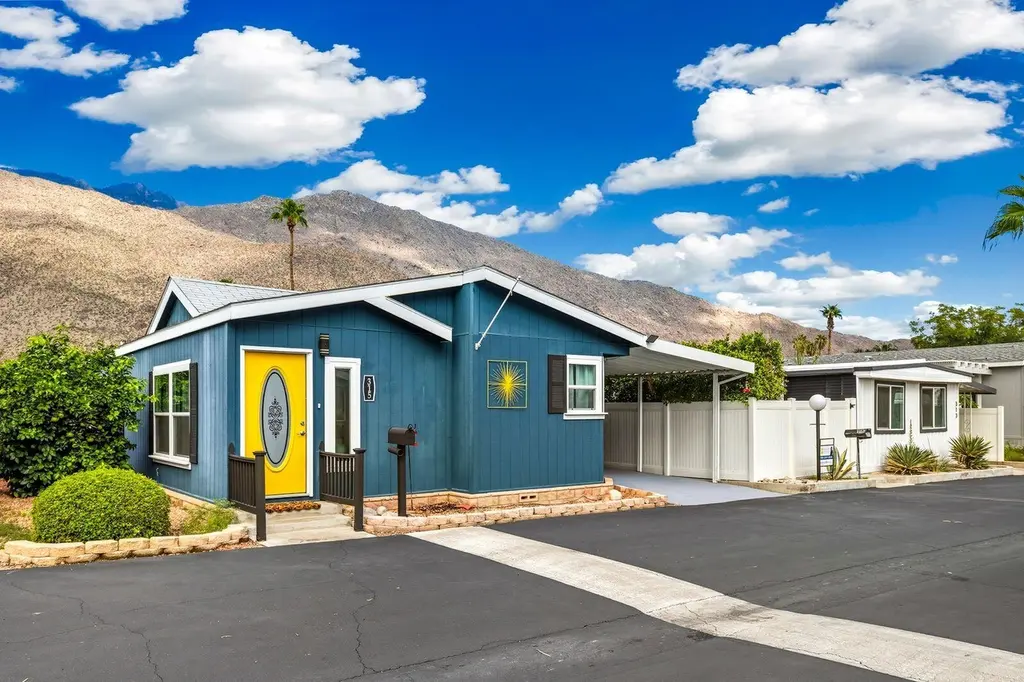
315 Kona Ln · Palm Springs, CA
Flood risk 1/10 · Minimal
- FEMA flood zone
- X (shaded)
- Chance of flooding over 30 yrs
- 0.0%
- Est. flood insurance / yr
- $507 – $1,088
Fire risk 5/10 · Moderate
- Est. fire insurance / yr
- $659 – $1,223
Heat risk 9/10 · Severe
- Hot days now (above 110°F)
- 9 days/yr
- Hot days in 30 yrs
- 27 days/yr
Wind risk 1/10 · Minimal
- Chance of severe wind over 30 yrs
- —
Air-quality risk 5/10 · Moderate
- Unhealthy air days now
- 6 days/yr
- Unhealthy air days in 30 yrs
- 8 days/yr
Risk factors via First Street. Map © Google.
Why this score? — see what drove the B grade
The composite is a weighted blend of 9 inputs, each scored 0–100. Each bar is that input's sub-score; the figure is the points it added to the 100-point composite (weight × sub-score).
- Cash flow +29.4/30.0
- ARV discount +15.0/15.0
- DSCR +10.0/10.0
- 1% rule +7.0/10.0
- Livability +3.3/5.0
- Schools +2.7/10.0
- Condition / age +2.5/5.0
- Rent growth +2.4/5.0
- Appreciation +0.0/10.0
$219,000
🖨 Deal sheet (PDF) 📄 Offer letter ✓ Due diligence
Listing remarks MLS
Lowest-priced and largest home for sale in the park today!- Now $224,000. Best value in Palm Canyon Mobile Club and the surrounding South Palm Springs area! A total of 1,320 renovated sq. ft. ($170 per sq. ft. ), all on ground level. Easy carport home door with ramp, no stairs. Renovated in 2023, 2BR + Bonus Room, all ground level, which lives more like a single-family home. Located in one of Palm Springs' most sought-after manufactured home communities, this updated 2004 property offers both space and style. Spacious layout with a flexible bonus room for office or den. Modern updates: newer windows, flooring, bathrooms, and appliances, plus a freshly painted interior and exterior. Chef's kitchen: Fully renovated open-concept design with a large granite island, a Samsung Bespoke fridge, and a new dishwasher. Bright living area: Southeast-facing with coved ceilings for natural light and airy comfort. Private primary suite: Ensuite tucked away at the end of the hall for peace and privacy. Outdoor retreat: Large, cool covered patio on carport side of home, and mature fruit trees with breathtaking mountain views that could be fenced in as a private side patio. Convenience: Spacious laundry room with newer full-size washer/dryer, plus a Level 2 EV charger. Enjoy resort-style living with a clubhouse, pool, BBQ area, and dog run just around the corner all framed by the dramatic San Jacinto Mountains. Outside the community are iconic multi million-dollar mid-century single family homes. There is only one monthly space lot lease fee of $1,350 that includes all park fees. You only pay for water, gas and electricity. The land lease is between the park owners and the land lease holders, not the private homeowners, and runs through 2081. Don't miss this rare opportunity to own one of the largest homes in Tiny Town. Schedule your showing today and experience the Palm Springs lifestyle firsthand!
Key facts
- Updated property
- Newer flooring
- Flexible bonus room
Tags
Neighborhood map
What this means for you Summary
Snapshot
- This is a 2-bed/2.0-bath manufactured listed at $219k.
Deal economics
- At list price, monthly cash flow is $777 ($9k/yr) — positive.
- The deal already cash-flows at list — no discount required.
- Meets the 1% rule at list price ($3k rent vs $219k).
- Recommended offer: $212k (3.0% below list) — sets the bar for market timing.
- Cap rate 10.5% vs local median 2.7% in Palm Springs — top-decile yield for the area; either an underpriced asset or a hidden risk that comps aren't pricing in. Stress-test before assuming the spread holds.
Location & tenants
- Location reads 66/100 on livability (#348 in CA) — a middle-class / working-renter tenant base. Strengths: amenities A+, commute A+; Watch: schools C-, crime F, cost of living F.
- Palm Springs Unified (suburban): math 21% / reading 42% proficiency, ranked #328 of 517 in CA (top 63%) — families likely to look elsewhere, expect single-tenant / working-renter base with shorter leases; 73% free/reduced lunch — lower-income household profile, screen leases tightly.
- Market conditions: Rents soft (-0.4%/yr); 498 active listings in the ZIP; 40 comparable units currently listed for rent nearby; rentals at typical pace (median 26d on market — plan ~3-4 weeks tenant-placement turnaround); solid renter incomes; 9,195 units permitted in Riverside County in 2024 (1,512 in 5+ unit buildings).
- This rent runs 40% of the median local income ($78k/yr) — at the standard rent-burdened threshold; future hikes will face affordability resistance.
Forward outlook
- Local home prices are declining (-3.0%/yr); year-one equity from $2k of loan paydown is wiped out by about $7k of value loss. Plan a longer hold.
- Riverside County population projected at +22% by 2050 — long-run rental-demand tailwind backs the buy-and-hold thesis.
Negotiation context
- It's been on market 48 days — a 3% lower offer ($212k) is reasonable based on typical stale-listing flexibility.
- 13 sale attempts since 12y ago with the ask held roughly flat each time — persistent listings suggest the price (not the market) is what's stuck; bring a comps-based counter.
Risks & watch-outs
- Climate carrying-cost: moderate wildfire risk; extreme-heat days projected 9→27/yr by 2055 (HVAC capex compounding) — expect insurance premiums to compound above CPI over the hold.
Questions for the listing agent
- It's been on market 48 days. Have you received any prior offers? Is the seller open to a 3% concession, seller financing, or rate buy-down credit?
- Is there a deadline driving the sale (1031 exchange, divorce, estate, relocation)? That informs how much negotiation room exists.
- Crime grade is F in this area — have there been break-ins, vandalism, or insurance claims at this property in the last 3 years? What carrier currently insures it and at what premium?
- What's the average days-on-market for RENTAL listings here right now (not sales)? A rising rental-DOM trend means longer vacancies and softer asking-rent achievability than the comps imply.
- What's the recent tenant-quality profile in this submarket — average credit score on applications, eviction rate, late-payment / NSF rate, and stable-employment percentage? A property-management company in the area should have these aggregated.
- How much new for-sale + rental construction is in the pipeline within 1–3 miles? Heavy new supply typically softens prices + rents 12–24 months out; constrained supply supports both.
Investment metrics
- 1% rule
- 1.20% ✓
- Cap rate
- 10.55%
- Cash-on-cash
- 15.20%
- DSCR
- 1.68
- GRM
- 7.0
CMA / ARV
- ARV (median comp)
- $270,933
- List price
- $219,000
- Delta
- -19.17%
- Verdict
- UNDERPRICED
- Comps
- 17 within 1.0 mi
Show comp detail 12 sales within ~0.75 mi
| Address | Dist | Beds/Ba | Sqft | Sold | Price | $/sf | Match |
|---|---|---|---|---|---|---|---|
| 315 Kona Ln | 0.00mi | 2/2.0 | 1,320 (0%) | 0mo | $215,000 | $163 | 100 |
| 317 Kona Ln | 0.01mi | 3/2.0 (+1) | 1,344 (+2%) | 12mo | $325,000 | $242 | 82 |
| 234 Lei Dr | 0.15mi | 2/2.0 | 1,456 (+10%) | 3mo | $125,000 | $86 | 74 |
| 248 Lei Dr | 0.23mi | 2/2.0 | 1,200 (-9%) | 2mo | $143,000 | $119 | 73 |
| 267 Araby St | 0.30mi | 2/2.0 | 1,440 (+9%) | 2mo | $170,500 | $118 | 69 |
| 3 Bali Dr | 0.11mi | 2/2.0 | 1,440 (+9%) | 13mo | $420,000 | $292 | 69 |
| 145 Morocco St #145 | 0.10mi | 3/2.0 (+1) | 1,164 (-12%) | 4mo | $214,000 | $184 | 68 |
| 17 Araby St | 0.16mi | 2/2.0 | 1,150 (-13%) | 4mo | $450,000 | $391 | 68 |
| 102 Caravan St | 0.20mi | 2/2.0 | 1,152 (-13%) | 3mo | $290,000 | $252 | 67 |
| 252 Suez St | 0.30mi | 2/2.0 | 1,440 (+9%) | 10mo | $275,000 | $191 | 62 |
| 633 Cameo Dr | 0.71mi | 2/2.0 | 1,440 (+9%) | 1mo | $270,000 | $188 | 51 |
| 527 Jade Ln | 0.72mi | 2/2.0 | 1,440 (+9%) | 4mo | $360,000 | $250 | 48 |
Match score weights: distance 35% · size 25% · config 20% · recency 20%. Top-matched comps best support the ARV.
Projected returns pro-forma
-3.0% appreciation · 0.0% rent growth · sell at horizon
- IRR
- 2.7%
- Equity multiple
- 1.10×
- Total profit
- $6,214
- Equity at exit
- $32,654
- IRR
- 9.4%
- Equity multiple
- 1.64×
- Total profit
- $39,051
- Equity at exit
- $18,935
Cash invested: $61,320 (down + closing). Projections, not guarantees.
Landlord ↔ Tenant lean methodology
- Overall (STATE)
- 18 Strongly Tenant-Friendly
- State California
- 18 Strongly Tenant-Friendly · D+13
- County
- — inherits STATE
- City
- — inherits STATE
ZIP-level market 92264
- Rents YoY
- -0.4%
- Active inventory
- 498
- Price-to-rent
- 7.0×
Monthly cashflow live
- Estimated rent
- $2,621 high interval (Pro) →
- Mortgage (P&I)
- −$1,148
- Tax from tax record
- −$54 /mo · $646/yr
- Insurance
- −$91
- HOA
- −$0
- Vacancy / Maint / Mgmt
- −$550
- Net cashflow
- $777
Break-even live
Sensitivity live
| Price | -10% $901 | -5% $839 | +0% $777 | +5% $715 | +10% $653 |
|---|---|---|---|---|---|
| Rent | -10% $570 | -5% $673 | +0% $777 | +5% $880 | +10% $984 |
| Rate | -1.0pp $887 | -0.5pp $833 | base $777 | +0.5pp $720 | +1.0pp $662 |
UW: 25.0% down · 7.5% · 30yr · 1.5% tax · 5.0% vac · 8.0% maint · 8.0% mgmt
Financing live
Cash to close
- Down payment
- $54,750
- Closing costs
- $6,570
- Reserves months
- —
- Total cash needed
- —
Loan-product check · same deal, 3 products live
Conventional
25% down · 7.5% · 30yr
- Down + closing
- —
- Monthly P&I
- —
- Monthly cashflow
- —
- DSCR
- —
- Eligible?
- —
Personal DTI + credit; lowest rate.
DSCR
20% down · 8.5% · 30yr
- Down + closing
- —
- Monthly P&I
- —
- Monthly cashflow
- —
- DSCR
- —
- Eligible?
- —
No personal income docs; deal must DSCR.
Hard money
10% down · 12.0% · 12mo
- Down + closing
- —
- Monthly P&I
- —
- Monthly cashflow
- —
- DSCR
- —
- Eligible?
- —
Short-term bridge; refi at stabilization.
Rent comps 40 comps
| Address | Beds | Baths | Sqft | Rent | $/sqft | DOM | Units | Dist |
|---|---|---|---|---|---|---|---|---|
| 791 E Twin Palms Dr Palm Springs, CA | 3.0 | 2.0 | 1793 | $9,700 | $5.41 | 44d | 1 | 0.15mi |
| 1900 S Palm Canyon Dr #42 Palm Springs, CA | 2.0 | 2.0 | 1024 | $2,500 | $2.44 | 44d | 1 | 0.18mi |
| 500 Paseo Soleado Unit 497 Palm Springs, CA | 3.0 | 2.5 | 1812 | $3,000 | $1.66 | 44d | 1 | 0.20mi |
| 500 Paseo Soleado Unit 485 Palm Springs, CA | 2.0 | 2.5 | 1712 | $2,800 | $1.64 | 44d | 1 | 0.20mi |
| 780 E Palm Canyon Dr #202 Palm Springs, CA | 2.0 | 2.0 | 1305 | $2,950 | $2.26 | 25d | 1 | 0.22mi |
| 1950 S Palm Canyon Dr Palm Springs, CA | 1.0–2.0 | 1.0–2.0 | 902 | $2,645 | $2.93 | 3d | 3 | 0.24mi |
| 1950 S Palm Canyon Dr Palm Springs, CA | 1.0–2.0 | 1.0–2.0 | 902 | $2,500 | $2.77 | 44d | 2 | 0.24mi |
| 965 E Twin Palms Dr Palm Springs, CA | 3.0 | 2.0 | 1600 | $15,000 | $9.38 | 44d | 1 | 0.25mi |
| 157 Calle Bravo Palm Springs, CA | 2.0 | 3.0 | 1694 | $2,950 | $1.74 | 0d | 1 | 0.26mi |
| 1425 Via Soledad Unit 1 Palm Springs, CA | 2.0 | 2.0 | 1050 | $2,500 | $2.38 | 44d | 1 | 0.41mi |
| 1425 Via Soledad Unit 1 Palm Springs, CA | 2.0 | 2.0 | 1050 | $2,500 | $2.38 | 25d | 1 | 0.41mi |
| 1428 S Camino Real Palm Springs, CA | 2.0 | 2.0 | 1054 | $2,300 | $2.18 | 44d | 1 | 0.43mi |
| 251 E La Verne Way Unit F Palm Springs, CA | 2.0 | 2.0 | 1345 | $2,550 | $1.90 | 25d | 1 | 0.43mi |
| 451 E Via Carisma #72 Palm Springs, CA | 2.0 | 2.0 | 1170 | $2,200 | $1.88 | 25d | 1 | 0.48mi |
| 2220 S Calle Palo Fierro #23 Palm Springs, CA | 2.0 | 2.0 | 1200 | $2,995 | $2.50 | 12d | 1 | 0.48mi |
| 1150 E Palm Canyon Dr #60 Palm Springs, CA | 2.0 | 2.0 | 1240 | $2,595 | $2.09 | 25d | 1 | 0.49mi |
| 1041 S La Verne Way Palm Springs, CA | 2.0 | 2.0 | 1325 | $2,800 | $2.11 | 25d | 1 | 0.50mi |
| 250 E San Jose Rd Palm Springs, CA | 2.0–3.0 | 2.0 | 1187 | $2,199 | $1.85 | 44d | 2 | 0.59mi |
| 250 E San Jose Rd #63 Palm Springs, CA | 2.0 | 2.0 | 1152 | $2,400 | $2.08 | 25d | 1 | 0.59mi |
| 1486 E Palm Tree Dr Palm Springs, CA | 2.0 | 2.0 | 1300 | $3,000 | $2.31 | 44d | 1 | 0.66mi |
| 722 E San Lorenzo Rd Palm Springs, CA | 3.0 | 1.0–2.0 | 750 | $2,015 | $2.69 | 8d | 3 | 0.73mi |
| 722 E San Lorenzo Rd Unit 02 Palm Springs, CA | 3.0 | 2.0 | 1200 | $2,425 | $2.02 | 5d | 1 | 0.73mi |
| 671 S Riverside Dr Unit 6 Palm Springs, CA | 2.0 | 2.0 | 900 | $1,985 | $2.21 | 25d | 1 | 0.76mi |
| 1710 E Sonora Rd Palm Springs, CA | 2.0 | 2.0 | 1391 | $2,800 | $2.01 | 25d | 1 | 0.93mi |
| 255 E Avenida Granada #525 Palm Springs, CA | 2.0 | 2.0 | 1198 | $2,195 | $1.83 | 19d | 1 | 0.95mi |
| 255 E Avenida Granada #324 Palm Springs, CA | 2.0 | 2.0 | 1198 | $2,100 | $1.75 | 8d | 1 | 0.95mi |
| 1745 Capri Cir Palm Springs, CA | 2.0 | 2.0 | 1200 | $2,495 | $2.08 | 25d | 1 | 0.96mi |
| 2600 S Palm Canyon Dr Palm Springs, CA | 2.0 | 1.5–2.0 | 1392 | $2,700 | $1.94 | 12d | 2 | 1.05mi |
| 1111 E Ramon Rd #87 Palm Springs, CA | 3.0 | 2.0 | 1313 | $4,500 | $3.43 | 18d | 1 | 1.07mi |
| 2727 S Sierra Madre #5 Palm Springs, CA | 2.0 | 2.5 | 1616 | $3,100 | $1.92 | 44d | 1 | 1.13mi |
| 1111 E Ramon Rd Palm Springs, CA | 2.0–3.0 | 2.0 | 1191 | $2,800 | $2.35 | 17d | 2 | 1.23mi |
| 1111 E Ramon Rd Palm Springs, CA | 2.0–3.0 | 2.0 | 1191 | $2,000 | $1.68 | 25d | 2 | 1.23mi |
| 520 E Murray Canyon Dr Palm Springs, CA | 1.0–3.0 | 2.0–2.5 | 1885 | $2,595 | $1.38 | 0d | 1 | 1.24mi |
| 453 Village Square E Palm Springs, CA | 2.0 | 2.0 | 1400 | $3,000 | $2.14 | 17d | 1 | 1.26mi |
| 1050 E Ramon Rd Palm Springs, CA | 2.0 | 2.0 | 1253 | $3,815 | $3.04 | 44d | 2 | 1.29mi |
| 1050 E Ramon Rd Palm Springs, CA | 2.0 | 2.0 | 1135 | $3,264 | $2.88 | 0d | 3 | 1.29mi |
| 874 Village Square N Palm Springs, CA | 2.0 | 2.0 | 1680 | $3,000 | $1.79 | 19d | 1 | 1.30mi |
| 998 Village Square N Palm Springs, CA | 2.0 | 2.0 | 1588 | $3,000 | $1.89 | 25d | 1 | 1.30mi |
| 211 Canyon Cir N Palm Springs, CA | 2.0 | 2.0 | 1678 | $3,900 | $2.32 | 4d | 1 | 1.35mi |
| 211 Canyon Cir N Palm Springs, CA | 2.0 | 2.0 | 1678 | $3,900 | $2.32 | 17d | 1 | 1.35mi |
Listing history 40 events
-
2026-06-02status $219,000 Pending 48 DOM
-
2026-06-01days on market $219,000 Active 48 DOM
-
2026-05-31days on market $219,000 Active 47 DOM
-
2026-04-30price $224,000 1916-char remark
Show marketing remark (1916 chars)
Lowest-priced and largest home for sale in the park today!- Now $224,000. Best value in Palm Canyon Mobile Club and the surrounding South Palm Springs area! A total of 1,320 renovated sq. ft. ($170 per sq. ft. ), all on ground level. Easy carport home door with ramp, no stairs. Renovated in 2023, 2BR + Bonus Room, all ground level, which lives more like a single-family home. Located in one of Palm Springs' most sought-after manufactured home communities, this updated 2004 property offers both space and style. Spacious layout with a flexible bonus room for office or den. Modern updates: newer windows, flooring, bathrooms, and appliances, plus a freshly painted interior and exterior. Chef's kitchen: Fully renovated open-concept design with a large granite island, a Samsung Bespoke fridge, and a new dishwasher. Bright living area: Southeast-facing with coved ceilings for natural light and airy comfort. Private primary suite: Ensuite tucked away at the end of the hall for peace and privacy. Outdoor retreat: Large, cool covered patio on carport side of home, and mature fruit trees with breathtaking mountain views that could be fenced in as a private side patio. Convenience: Spacious laundry room with newer full-size washer/dryer, plus a Level 2 EV charger. Enjoy resort-style living with a clubhouse, pool, BBQ area, and dog run just around the corner all framed by the dramatic San Jacinto Mountains. Outside the community are iconic multi million-dollar mid-century single family homes. There is only one monthly space lot lease fee of $1,350 that includes all park fees. You only pay for water, gas and electricity. The land lease is between the park owners and the land lease holders, not the private homeowners, and runs through 2081. Don't miss this rare opportunity to own one of the largest homes in Tiny Town. Schedule your showing today and experience the Palm Springs lifestyle firsthand!
-
2026-04-14$228,000 Active 1916-char remark
Show marketing remark (1916 chars)
Lowest-priced and largest home for sale in the park today!- Now $224,000. Best value in Palm Canyon Mobile Club and the surrounding South Palm Springs area! A total of 1,320 renovated sq. ft. ($170 per sq. ft. ), all on ground level. Easy carport home door with ramp, no stairs. Renovated in 2023, 2BR + Bonus Room, all ground level, which lives more like a single-family home. Located in one of Palm Springs' most sought-after manufactured home communities, this updated 2004 property offers both space and style. Spacious layout with a flexible bonus room for office or den. Modern updates: newer windows, flooring, bathrooms, and appliances, plus a freshly painted interior and exterior. Chef's kitchen: Fully renovated open-concept design with a large granite island, a Samsung Bespoke fridge, and a new dishwasher. Bright living area: Southeast-facing with coved ceilings for natural light and airy comfort. Private primary suite: Ensuite tucked away at the end of the hall for peace and privacy. Outdoor retreat: Large, cool covered patio on carport side of home, and mature fruit trees with breathtaking mountain views that could be fenced in as a private side patio. Convenience: Spacious laundry room with newer full-size washer/dryer, plus a Level 2 EV charger. Enjoy resort-style living with a clubhouse, pool, BBQ area, and dog run just around the corner all framed by the dramatic San Jacinto Mountains. Outside the community are iconic multi million-dollar mid-century single family homes. There is only one monthly space lot lease fee of $1,350 that includes all park fees. You only pay for water, gas and electricity. The land lease is between the park owners and the land lease holders, not the private homeowners, and runs through 2081. Don't miss this rare opportunity to own one of the largest homes in Tiny Town. Schedule your showing today and experience the Palm Springs lifestyle firsthand!
-
2026-04-12historical
-
2026-03-21price $235,000
-
2026-01-07price $245,000
-
2025-11-25price $255,000
-
2025-11-13historical
-
2025-10-22price $279,000
-
2025-10-02$289,000 Active
-
2025-09-26historical
-
2025-09-25$269,000 Active
-
2021-12-17soldstatus $197,000 Sold
-
2021-12-02historical Backup Offers Accepted
-
2021-11-05status Active
-
2021-10-11$210,000 Active
-
2021-07-31status Active
-
2021-06-22status Active
-
2021-05-31historical Backup Offers Accepted
-
2021-05-28price
-
2021-05-08status Active
-
2021-05-06status Backup Offers Accepted
-
2021-05-03Active
-
2019-10-01status Pending
-
2019-09-30soldstatus $103,500 Sold
-
2019-09-30soldstatus $103,500 Closed
-
2019-09-06historical Backup Offers Accepted
-
2019-08-21$98,500 Active
-
2015-02-25soldstatus $40,000 Closed
-
2015-02-25soldstatus $40,000 Closed
-
2015-02-23historical
-
2015-02-05status Backup Offers Accepted
-
2015-01-11status Active
-
2015-01-08status Backup Offers Accepted
-
2015-01-05price $47,000
-
2014-12-04price $57,000
-
2014-11-01price $62,000
-
2014-09-02$67,000 Active
ⓘ Source: listings_history table (triggers on properties + properties_extension) + one-shot
backfill from property_details.listing_events for pre-trigger history.
Tax reassessment forecast CA · Resets to sale price
- Current annual tax
- $646 · $54/mo
- Projected year-2 tax
- $1,664 · $139/mo
- Expected delta
- +$1,019/yr (+$85/mo · 157.8%)
ⓘ Screening estimate from a state-policy table — verify with the county assessor before closing.
Climate risk First Street
- Flood 1/10 Low FEMA zone X (shaded) · 0% chance over 30 yrs
- Wildfire 5/10 Major
- Heat 9/10 Extreme 9 d/yr ≥110°F today · 27 d/yr by 30 yrs out
- Wind 1/10 Low
- Air quality 5/10 Major 6 unhealthy d/yr today · 8 by 30 yrs out
Nearby sold comps map
Loading sold comps map…
Walkable amenities ~0.75 mi
Loading nearby amenities…
Taxation est. · year 1
- Rental income
- $31,448
- − Mortgage interest
- −$12,267
- − Property taxes
- −$646
- − Insurance
- −$1,095
- − Repairs & maintenance
- −$2,516
- − Management
- −$2,516
- − Depreciation
- −$6,371
- Taxable income
- $6,038
- Est. tax owed @ 24.0%
- −$1,449
- After-tax cash flow
- $7,873/yr
For passive investors: Depreciation is non-cash, so a rental often shows a tax loss while cash-flowing — sheltering income. Rental losses are passive: they offset passive income freely, and up to $25,000/yr can offset ordinary (W-2) income if you actively participate and your MAGI is under $100k (phasing out to $0 by $150k); unused losses carry forward. On sale, claimed depreciation is recaptured at up to 25%, and gains may owe capital-gains tax (a 1031 exchange can defer both). Figures are a year-1 estimate at your 24.0% rate — not tax advice; consult a CPA.
Schools (NCES district)
- District
- Palm Springs Unified
- NCES district ID
- 0629550
- Math proficiency
- 21% ▼ -7.00%
- Reading proficiency
- 42% ▬ 0.00%
- Median HH income
- $43,638
- Composite
- 26.76/100
- National rank
- #7131
- State rank
- #328 of 517 in CA
Livability — Palm Springs
- Score
- 66/100
- State rank
- #348
- US rank
- #11850
Category grades
Schools grade is shown separately in the Schools card above.
Census & demographics
- Census place
- Palm Springs, CA
- County
- Riverside County · 2,287,001 people
- City population
- 46,786
- Metro
- Riverside-San Bernardino-Ontario, CA
- Population (ZIP)
- 19,899
- Household income
- $77,688
- Rent vs Own
- Severe rent burden
- 1215.0
Population outlook (Riverside County) Hauer SSP2
- Today (2025)
- 2,664,475 people
- By 2030
- 2,802,692 · +5.2%
- By 2040
- 3,050,904 · +14.5%
- By 2050
- 3,256,783 · +22.2%
- By 2075
- 3,655,058 · +37.2%
- By 2100
- 3,766,594 · +41.4%
Race, ethnicity, and origin ACS 2023
- Neighborhood character
- Predominantly White (68%)
- Race & ethnicity
- White 68% Hispanic / Latino 20% Two or more races 12% Asian 6% Black 2% Native American 1%
- Hispanic origin (detail)
- Mexican 16%
- Common ancestry
- Lithuanian 4% Romanian 3% Slovak 3%
- Foreign-born
- 16% · Canada, China, South Korea
- Languages at home
- 81% English-only · Spanish 13% Tagalog/Filipino 2% Other Asian/Pacific 1%
Political lean MEDSL · Riverside
- 2024 margin
- Toss-up / Even · D 48.0% · R 49.3% · Other 2.6%
- 2008→2024 swing
- -3.6pp toward R · 2008: 2.3pp · 2024: -1.3pp
- All cycles
- 2024: R+1.3 2020: D+8.0 2016: D+4.3 2012: R+0.4 2008: D+2.3
Not yet ingested
- Civics
- —
Market trends
- HPI YoY
- ▼ -489.04%
- Current HPI
- 357.0969
- Rent YoY
- ▼ -0.43%
- Metro
- Riverside-San Bernardino-Ontario, CA
- State GDP YoY
- ▲ 3.21%
- F500 in state
- 116
Industry mix (Fortune 500 HQ in CA)
| Industry | F500 HQs | Revenue |
|---|---|---|
| Technology | 27 | $1,492B |
|
||
| Financial Services | 3 | $174B |
|
||
| Retail | 3 | $44B |
|
||
| Insurance | 3 | $26B |
|
||
| Media / Entertainment | 2 | $115B |
|
||
| Pharmaceuticals / Biotech | 2 | $62B |
|
||
Price history
+234.3% since first listed37 events — show timeline
- 2026-04-30 Price Changed $224,000 GPSMLS
- 2026-04-14 Listed $228,000 GPSMLS
- 2026-04-12 Listing Removed — GPSMLS
- 2026-03-21 Price Changed $235,000 GPSMLS
- 2026-01-07 Price Changed $245,000 GPSMLS
- 2025-11-25 Price Changed $255,000 GPSMLS
- 2025-11-13 Listing Removed — GPSMLS
- 2025-10-22 Price Changed $279,000 GPSMLS
- 2025-10-02 Listed $289,000 GPSMLS
- 2025-09-26 Coming Soon — GPSMLS
- 2025-09-25 Listed $269,000 GPSMLS
- 2021-12-17 Sold (MLS) $197,000 TheMLS
- 2021-12-02 Contingent — TheMLS
- 2021-11-05 Relisted — TheMLS
- 2021-10-11 Listed $210,000 TheMLS
- 2021-07-31 Relisted — TheMLS
- 2021-06-22 Relisted — TheMLS
- 2021-05-31 Contingent — TheMLS
- 2021-05-28 Price Changed — TheMLS
- 2021-05-08 Relisted — TheMLS
- 2021-05-06 Relisted — TheMLS
- 2021-05-03 Listed — TheMLS
- 2019-10-01 Pending — GPSMLS
- 2019-09-30 Sold (MLS) $103,500 GPSMLS
- 2019-09-30 Sold (MLS) $103,500 GPSMLS
- 2019-09-06 Contingent — GPSMLS
- 2019-08-21 Listed $98,500 GPSMLS
- 2015-02-25 Sold (MLS) $40,000 GPSMLS
- 2015-02-25 Sold (MLS) $40,000 GPSMLS
- 2015-02-23 Listing Removed — GPSMLS
- 2015-02-05 Pending — GPSMLS
- 2015-01-11 Relisted — GPSMLS
- 2015-01-08 Pending — GPSMLS
- 2015-01-05 Price Changed $47,000 GPSMLS
- 2014-12-04 Price Changed $57,000 GPSMLS
- 2014-11-01 Price Changed $62,000 GPSMLS
- 2014-09-02 Listed $67,000 GPSMLS
Property tax history
-3.4%/yrLatest (2025): $646 · -2.1% YoY. Source: county tax records.
Cash-flow waterfall
monthlySold comps — $/sqft
last 12 mo · ≤1 miLoading sold comps…