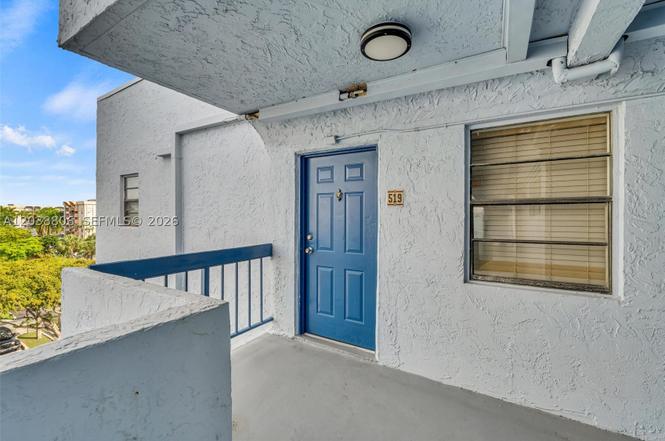
9460 Fontainebleau Blvd #519 · Fountainebleau, FL
Flood risk 3/10 · Minor
- FEMA flood zone
- AH
- Chance of flooding over 30 yrs
- 0.2%
- Est. flood insurance / yr
- $1,142 – $2,507
Fire risk 1/10 · Minimal
- Est. fire insurance / yr
- $947 – $1,759
Heat risk 10/10 · Severe
- Hot days now (above 105°F)
- 6 days/yr
- Hot days in 30 yrs
- 24 days/yr
Wind risk 10/10 · Severe
- Chance of severe wind over 30 yrs
- 99.0%
Air-quality risk 2/10 · Minimal
- Unhealthy air days now
- 1 days/yr
- Unhealthy air days in 30 yrs
- 1 days/yr
Risk factors via First Street. Map © Google.
Why this score? — see what drove the D+ grade
The composite is a weighted blend of 9 inputs, each scored 0–100. Each bar is that input's sub-score; the figure is the points it added to the 100-point composite (weight × sub-score).
- Cash flow +13.7/30.0
- ARV discount +7.5/15.0
- Schools +4.2/10.0
- 1% rule +4.1/10.0
- DSCR +4.1/10.0
- Livability +4.0/5.0
- Appreciation +3.1/10.0
- Condition / age +2.5/5.0
- Rent growth +2.1/5.0
$250,000
🖨 Deal sheet 📄 Offer letter ✓ Due diligence
Listing remarks MLS
BEAUTIFUL CONDO, EXCELLENT CONDITIONS, WITH BALCONY AND INCREIBLE VIEW, DONT MISS THIS OPPORTUNITY, READY TO MOVE IN !!!!!
Key facts
- Corner condo unit
- Clubhouse
- Double balcony
Tags
Property features AI
Finance
- Financial info: Pets allowed
- HOA & community: Annual association fee of $150; Community amenities: Pool, Tennis courts
Exterior
- Parking: Assigned parking
- Utilities: Has cooling; Has heating
- Home design: Attached property; 5 stories
- Construction: Block construction; Effective year built
Interior
- Kitchen: Electric range; Refrigerator
- Bedrooms: Bedroom on main level
- Flooring: Tile
- Bathrooms: 2 full bathrooms
- Heating & cooling: Central air conditioning; Electric heating
- Interior features: First-floor entry; Bedroom on main level
Neighborhood map
What this means for you Summary
Snapshot
- This is a 2-bed/2.0-bath condo listed at $250k.
Deal economics
- At list price, monthly cash flow is $-135 ($-2k/yr) — negative.
- To cash-flow at today's rent, offer at most $226k (9.5% below list).
- To meet the 1% rule (rent ≥ 1% of price), the offer needs to be $227k (9.4% below list).
- Recommended offer: $226k (9.5% below list) — sets the bar for cash-flow.
- Cap rate 6.4% vs local median 3.8% in Fountainebleau — top-decile yield for the area; either an underpriced asset or a hidden risk that comps aren't pricing in. Stress-test before assuming the spread holds.
Location & tenants
- Location reads 81/100 on livability (#87 in FL, #1,407 nationally) — a professional / high-income tenant draw. Strengths: commute A+, housing A+, health & safety A+; Watch: schools C-, amenities F.
- Miami-Dade (suburban): math 45% / reading 54% proficiency, ranked #40 of 73 in FL (top 55%) — families likely to look elsewhere, expect single-tenant / working-renter base with shorter leases; 64% free/reduced lunch — lower-income household profile, screen leases tightly.
- Market conditions: Rents soft (-1.5%/yr); 157 active listings in the ZIP; 40 comparable units currently listed for rent nearby; rentals at typical pace (median 15d on market — plan ~3-4 weeks tenant-placement turnaround); 10,051 units permitted in Miami-Dade County in 2024 (7,758 in 5+ unit buildings).
- This rent runs 43% of the median local income ($63k/yr) — at the standard rent-burdened threshold; future hikes will face affordability resistance.
Forward outlook
- Local home prices are declining (-3.0%/yr); year-one equity from $2k of loan paydown is wiped out by about $8k of value loss. Plan a longer hold.
- Miami-Dade County population projected at +28% by 2050 — long-run rental-demand tailwind backs the buy-and-hold thesis.
Negotiation context
- Only 1 days on market — expect competitive offers; lowballing is unlikely to land.
Risks & watch-outs
- Watch-outs: flood insurance adds $152/mo.
- Climate carrying-cost: in FEMA flood zone AH (mandatory federal flood insurance); severe wind risk, 99% chance of damaging wind over 30y; extreme-heat days projected 6→24/yr by 2055 (HVAC capex compounding) — expect insurance premiums to compound above CPI over the hold.
Questions for the listing agent
- What do current leases actually rent for vs. the listed asking? Can we see a recent rent roll and the last 12 months of T-12 income?
- Built in 1972 — when were the roof, HVAC, electrical panel, plumbing, and water heater last replaced?
- What's the actual annual flood-insurance premium (NFIP or private), and is the property in a SFHA with mandatory coverage?
- What does the HOA fee cover, when was the last increase, and are there any pending special assessments or reserve-fund shortfalls?
- Any open or pending special assessments — roof, HVAC, plumbing, elevator, façade? What's the per-unit balance and payoff schedule, and is the seller paying it off at close or rolling it to the buyer?
- Is there a deadline driving the sale (1031 exchange, divorce, estate, relocation)? That informs how much negotiation room exists.
- The area grade is low — what's the realistic commute time and amenity access for the typical tenant pool here? Any planned neighborhood developments (good or bad) we should know about?
- What's the average days-on-market for RENTAL listings here right now (not sales)? A rising rental-DOM trend means longer vacancies and softer asking-rent achievability than the comps imply.
- What's the recent tenant-quality profile in this submarket — average credit score on applications, eviction rate, late-payment / NSF rate, and stable-employment percentage? A property-management company in the area should have these aggregated.
- How much new apartment / multifamily construction is in the pipeline within 1–3 miles? Heavy new supply (>2% of stock underway) typically softens rents 12–24 months out; light construction supports rent growth.
Investment metrics
- 1% rule
- 0.91% ✗
- Cap rate
- 6.38%
- Cash-on-cash
- 0.30%
- DSCR
- 1.01
- GRM
- 9.2
CMA / ARV
No comps found within radius.
Projected returns pro-forma
-3.0% appreciation · 0.0% rent growth · sell at horizon
- IRR
- -23.9%
- Equity multiple
- 0.21×
- Total profit
- $-55,578
- Equity at exit
- $37,276
- IRR
- -32.5%
- Equity multiple
- -0.21×
- Total profit
- $-84,475
- Equity at exit
- $21,615
Cash invested: $70,000 (down + closing). Projections, not guarantees.
Landlord ↔ Tenant lean methodology
- Overall (STATE)
- 87 Strongly Landlord-Friendly
- State Florida
- 87 Strongly Landlord-Friendly · R+3
- County
- — inherits STATE
- City
- — inherits STATE
ZIP-level market 33172
- Home prices YoY
- -1.1%
- Rents YoY
- -1.5%
- Active inventory
- 157
- Price-to-rent
- 9.2×
Monthly cashflow live
- Estimated rent
- $2,265 high interval (Pro) →
- Mortgage (P&I)
- −$1,311
- Tax from tax record
- −$323 /mo · $3,877/yr
- Insurance
- −$104
- Flood insurance flood zone
- −$152 /mo · $1,824/yr
- HOA
- −$34
- Vacancy / Maint / Mgmt
- −$476
- Net cashflow
- $-135
Break-even live
UW: 25.0% down · 7.5% · 30yr · 1.5% tax · 5.0% vac · 8.0% maint · 8.0% mgmt
Financing live
Cash to close
- Down payment
- $62,500
- Closing costs
- $7,500
- Reserves months
- —
- Total cash needed
- —
Loan-product check · same deal, 3 products live
Conventional
25% down · 7.5% · 30yr
- Down + closing
- —
- Monthly P&I
- —
- Monthly cashflow
- —
- DSCR
- —
- Eligible?
- —
Personal DTI + credit; lowest rate.
DSCR
20% down · 8.5% · 30yr
- Down + closing
- —
- Monthly P&I
- —
- Monthly cashflow
- —
- DSCR
- —
- Eligible?
- —
No personal income docs; deal must DSCR.
Hard money
10% down · 12.0% · 12mo
- Down + closing
- —
- Monthly P&I
- —
- Monthly cashflow
- —
- DSCR
- —
- Eligible?
- —
Short-term bridge; refi at stabilization.
Rent comps 40 comps
| Address | Beds | Baths | Sqft | Rent | $/sqft | DOM | Units | Dist |
|---|---|---|---|---|---|---|---|---|
| 9440 Fontainebleau Blvd #406 Miami, FL | 1.0 | 1.0 | 676 | $1,750 | $2.59 | 2d | 1 | 0.07mi |
| 9440 Fontainebleau Blvd #406 Miami, FL | 1.0 | 1.0 | 676 | $1,750 | $2.59 | 3d | 1 | 0.07mi |
| 9360 Fontainebleau Blvd #309 Miami, FL | 2.0 | 1.0 | 690 | $1,950 | $2.83 | 3d | 1 | 0.11mi |
| 9443 Fontainebleau Blvd #209 Miami, FL | 2.0 | 2.0 | 1000 | $2,400 | $2.40 | 24d | 1 | 0.12mi |
| 9443 Fontainebleau Blvd Unit 2 Miami, FL | 2.0 | 2.0 | 1000 | $2,400 | $2.40 | 5d | 1 | 0.12mi |
| 9350 Fontainebleau Blvd Miami, FL | 1.0–2.0 | 1.0–2.0 | 780 | $2,400 | $3.08 | 24d | 2 | 0.13mi |
| 9350 Fontainebleau Blvd #513 Miami, FL | 2.0 | 1.0 | 690 | $1,700 | $2.46 | 24d | 1 | 0.14mi |
| 9445 Fontainebleau Blvd #201 Miami, FL | 2.0 | 2.0 | 1000 | $2,300 | $2.30 | 10d | 1 | 0.15mi |
| 9445 Fontainebleau Blvd #201 Miami, FL | 2.0 | 2.0 | 1000 | $2,300 | $2.30 | 19d | 1 | 0.15mi |
| 9682 Fontainebleau Blvd #603 Miami, FL | 2.0 | 2.0 | 914 | $2,295 | $2.51 | 13d | 1 | 0.15mi |
| 9688 Fontainebleau Blvd #706 Miami, FL | 1.0 | 1.0 | 813 | $1,925 | $2.37 | 24d | 1 | 0.18mi |
| 9405 Fontainebleau Blvd #205 Miami, FL | 2.0 | 2.0 | 1000 | $2,350 | $2.35 | 7d | 1 | 0.18mi |
| 9517 Fontainebleau Blvd Miami, FL | 3.0 | 1.0–2.0 | 875 | $2,513 | $2.87 | 1d | 34 | 0.18mi |
| 9686 Fontainebleau Blvd #301 Miami, FL | 2.0 | 2.0 | 914 | $2,000 | $2.19 | 7d | 1 | 0.18mi |
| 9686 Fontainebleau Blvd #301 Miami, FL | 2.0 | 2.0 | 914 | $2,150 | $2.35 | 17d | 1 | 0.18mi |
| 9688 Fontainebleau Blvd Miami, FL | 1.0 | 1.0 | 813 | $1,862 | $2.29 | 22d | 2 | 0.18mi |
| 9407 Fontainebleau Blvd #106 Miami, FL | 2.0 | 2.0 | 1000 | $2,500 | $2.50 | 24d | 1 | 0.21mi |
| 9320 Fontainebleau Blvd #301 Miami, FL | 2.0 | 2.0 | 870 | $2,300 | $2.64 | 24d | 1 | 0.22mi |
| 9320 Fontainebleau Blvd Miami, FL | 2.0 | 2.0 | 940 | $2,250 | $2.39 | 2d | 3 | 0.23mi |
| 9320 Fontainebleau Blvd Miami, FL | 2.0 | 2.0 | 940 | $2,275 | $2.42 | 20d | 2 | 0.23mi |
| 9310 Fontainebleau Blvd Miami, FL | 1.0 | 1.0 | 690 | $2,200 | $3.19 | 24d | 1 | 0.26mi |
| 9310 Fontainebleau Blvd Miami, FL | 1.0–2.0 | 1.0 | 690 | $2,200 | $3.19 | 14d | 2 | 0.26mi |
| 9411 Fontainebleau Blvd #108 Miami, FL | 2.0 | 2.0 | 1000 | $2,450 | $2.45 | 2d | 1 | 0.26mi |
| 9411 Fontainebleau Blvd #108 Miami, FL | 2.0 | 2.0 | 1000 | $2,450 | $2.45 | 22d | 1 | 0.26mi |
| 9150 Fontainebleau Blvd Unit 203-2 Miami, FL | 1.0 | 1.0 | 776 | $1,875 | $2.42 | 24d | 1 | 0.26mi |
| 9701 Fontainebleau Blvd Unit C203 Miami, FL | 2.0 | 2.0 | 1067 | $2,400 | $2.25 | 7d | 1 | 0.30mi |
| 9701 Fontainebleau Blvd Unit C203 Miami, FL | 2.0 | 2.0 | 1067 | $2,500 | $2.34 | 24d | 1 | 0.30mi |
| 9711 Fontainebleau Blvd Unit D203 Miami, FL | 2.0 | 2.0 | 1067 | $2,400 | $2.25 | 14d | 1 | 0.33mi |
| 9711 Fontainebleau Blvd Unit D101 Miami, FL | 2.0 | 1.0 | 999 | $2,400 | $2.40 | 24d | 1 | 0.33mi |
| 9711 Fontainebleau Blvd Unit 105D Miami, FL | 2.0 | 1.0 | 999 | $2,350 | $2.35 | 5d | 1 | 0.33mi |
| 9711 Fontainebleau Blvd Unit 105D Miami, FL | 2.0 | 1.0 | 999 | $2,350 | $2.35 | 14d | 1 | 0.33mi |
| 9429 Fontainebleau Blvd Unit 201-33 Miami, FL | 2.0 | 2.0 | 1000 | $2,500 | $2.50 | 14d | 1 | 0.34mi |
| 9429 Fontainebleau Blvd Unit 201-33 Miami, FL | 2.0 | 2.0 | 1000 | $2,400 | $2.40 | 5d | 1 | 0.34mi |
| 9371 Fontainebleau Blvd Unit I205 Miami, FL | 1.0 | 1.5 | 1125 | $2,100 | $1.87 | 20d | 1 | 0.34mi |
| 9250 Fontainebleau Blvd #202 Miami, FL | 2.0 | 2.0 | 1113 | $2,200 | $1.98 | 12d | 1 | 0.35mi |
| 9705 Fontainebleau Blvd Unit B108 Miami, FL | 1.0 | 1.0 | 964 | $2,000 | $2.07 | 11d | 1 | 0.35mi |
| 9210 Fontainebleau Blvd #506 Miami, FL | 2.0 | 2.0 | 1113 | $2,200 | $1.98 | 24d | 1 | 0.36mi |
| 9715 Fontainebleau Blvd Unit E209 Miami, FL | 2.0 | 2.0 | 1067 | $2,450 | $2.30 | 7d | 1 | 0.36mi |
| 9120 Fontainebleau Blvd Miami, FL | 1.0–2.0 | 1.0–2.0 | 988 | $2,250 | $2.28 | 18d | 2 | 0.36mi |
| 901 NW 97th Ave Miami, FL | 1.0–3.0 | 1.0–2.0 | 981 | $2,836 | $2.89 | 1d | 31 | 0.37mi |
HOA detail condo
- Monthly dues
- $34 · $408/yr
- Assessments
- None detected in remarks — confirm with the listing agent.
Listing history 2 events
-
2026-06-17remarks 352-char remark
-
2026-06-17$250,000 Active 1 DOM
ⓘ Source: listings_history table (triggers on properties + properties_extension) + one-shot
backfill from property_details.listing_events for pre-trigger history.
Tax reassessment forecast FL · Resets to sale price
- Current annual tax
- $3,877 · $323/mo
- Projected year-2 tax
- $3,877 · $323/mo
- Expected delta
- $0/yr ($0/mo · 0.0%)
ⓘ Screening estimate from a state-policy table — verify with the county assessor before closing.
Climate risk First Street
- Flood 3/10 Moderate FEMA zone AH · 20% chance over 30 yrs
- Wildfire 1/10 Low
- Heat 10/10 Extreme 6 d/yr ≥105°F today · 24 d/yr by 30 yrs out
- Wind 10/10 Extreme 99% chance of damaging wind over 30 yrs
- Air quality 2/10 Low 1 unhealthy d/yr today · 1 by 30 yrs out
Nearby sold comps map
Loading sold comps map…
Walkable amenities ~0.75 mi
Loading nearby amenities…
Taxation est. · year 1
- Rental income
- $27,182
- − Mortgage interest
- −$14,004
- − Property taxes
- −$3,877
- − Insurance
- −$3,074
- − Repairs & maintenance
- −$2,175
- − Management
- −$2,175
- − HOA
- −$408
- − Depreciation
- −$7,273
- Taxable loss
- −$5,803
- Est. tax savings @ 24.0%
- +$1,393
- After-tax cash flow
- $-225/yr
For passive investors: Depreciation is non-cash, so a rental often shows a tax loss while cash-flowing — sheltering income. Rental losses are passive: they offset passive income freely, and up to $25,000/yr can offset ordinary (W-2) income if you actively participate and your MAGI is under $100k (phasing out to $0 by $150k); unused losses carry forward. On sale, claimed depreciation is recaptured at up to 25%, and gains may owe capital-gains tax (a 1031 exchange can defer both). Figures are a year-1 estimate at your 24.0% rate — not tax advice; consult a CPA.
Schools (NCES district)
- District
- Miami-Dade
- NCES district ID
- 1200390
- Math proficiency
- 45% ▼ -16.00%
- Reading proficiency
- 54% ▼ -5.00%
- Median HH income
- $43,928
- Composite
- 41.76/100
- National rank
- #3397
- State rank
- #40 of 73 in FL
Livability — Fountainebleau
- Score
- 81/100
- State rank
- #87
- US rank
- #1407
Category grades
Schools grade is shown separately in the Schools card above.
Census & demographics
- Census place
- Fountainebleau, FL
- County
- Miami-Dade County · 2,697,751 people
- City population
- 35,056
- Metro
- Miami-Fort Lauderdale-Pompano Beach, FL
- Population (ZIP)
- 39,101
- Household income
- $63,023
- Rent vs Own
- Severe rent burden
- 2678.0
Population outlook (Miami-Dade County) Hauer SSP2
- Today (2025)
- 3,126,439 people
- By 2030
- 3,325,765 · +6.4%
- By 2040
- 3,697,561 · +18.3%
- By 2050
- 4,012,134 · +28.3%
- By 2075
- 4,605,612 · +47.3%
- By 2100
- 4,866,598 · +55.7%
Race, ethnicity, and origin ACS 2023
- Neighborhood character
- Predominantly Hispanic (91%)
- Race & ethnicity
- Hispanic / Latino 91% Two or more races 41% White 4% Asian 3%
- Hispanic origin (detail)
- Mexican 1% Puerto Rican 3% Cuban 41% Dominican 3% Salvadoran 1%
- Foreign-born
- 72% · Canada, Jamaica, Dominican Republic
- Languages at home
- 11% English-only · Spanish 85% Other Indo-European 2% Other Asian/Pacific 1%
Political lean MEDSL · Miami-Dade
- 2024 margin
- R (+11.4) · D 43.9% · R 55.4%
- 2008→2024 swing
- -27.6pp toward R · 2008: 16.1pp · 2024: -11.4pp
- All cycles
- 2024: R+11.4 2020: D+7.3 2016: D+29.6 2012: D+23.7 2008: D+16.1
Not yet ingested
- Civics
- —
Market trends
- HPI YoY
- ▼ -3.72%
- Current HPI
- 324.8183
- Rent YoY
- ▼ -1.51%
- Metro
- Miami-Fort Lauderdale-Pompano Beach, FL
- State GDP YoY
- ▲ 3.28%
- F500 in state
- 36
Industry mix (Fortune 500 HQ in FL)
| Industry | F500 HQs | Revenue |
|---|---|---|
| Industrial Technology | 2 | $29B |
|
||
| Insurance | 2 | $17B |
|
||
| Retail | 1 | $60B |
|
||
| Technology Distribution | 1 | $58B |
|
||
| Homebuilding | 1 | $35B |
|
||
| Technology Manufacturing | 1 | $35B |
|
||
Price history
+11.1% since first listed3 events — show timeline
- 2026-06-17 Listed $250,000 MARMLS
- 2007-01-24 Sold (Public Records) $225,000 Public Records
- 2007-01-05 Sold (MLS) $225,000 MARMLS
Property tax history
+13.9%/yrLatest (2025): $3,877 · +2.9% YoY. Source: county tax records.
Cash-flow waterfall
monthlySold comps — $/sqft
last 12 mo · ≤1 miLoading sold comps…