1820 Madison Ave Unit 7C · New York, NY
Flood risk 1/10 · Minimal
- FEMA flood zone
- X (unshaded)
- Chance of flooding over 30 yrs
- 0.0%
- Est. flood insurance / yr
- $507 – $1,088
Fire risk 1/10 · Minimal
- Est. fire insurance / yr
- $691 – $1,283
Heat risk 7/10 · Major
- Hot days now (above 99°F)
- 7 days/yr
- Hot days in 30 yrs
- 15 days/yr
Wind risk 6/10 · Moderate
- Chance of severe wind over 30 yrs
- 27.0%
Air-quality risk 4/10 · Minor
- Unhealthy air days now
- 5 days/yr
- Unhealthy air days in 30 yrs
- 6 days/yr
Risk factors via First Street. Map © Google.
Why this score? — see what drove the D- grade
The composite is a weighted blend of 9 inputs, each scored 0–100. Each bar is that input's sub-score; the figure is the points it added to the 100-point composite (weight × sub-score).
- ARV discount +7.5/15.0
- Appreciation +6.6/10.0
- Cash flow +6.0/30.0
- Schools +5.0/10.0
- Rent growth +3.9/5.0
- Livability +3.8/5.0
- 1% rule +3.7/10.0
- Condition / age +2.5/5.0
- DSCR +0.4/10.0
$650,000
🖨 Deal sheet 📄 Offer letter ✓ Due diligence
Listing remarks
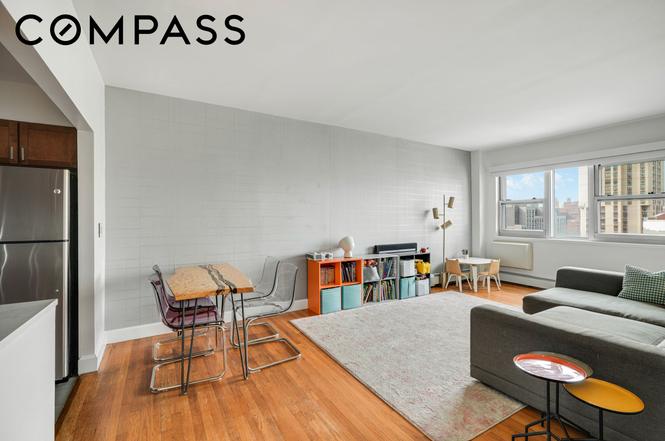
West-Facing 2BR Overlooking Treetops Toward Columbia, Tax-Abated Through 2037 988 SF - $1,203/mo maintenance - Boutique 2012 co-op on Madison Avenue Sun-filled, quiet, and thoughtfully designed, this west-facing two-bedroom offers exceptional space, light, and value in a boutique 2012 co-op along the Madison Avenue corridor in South Harlem. Spanning approximately 988 square feet, the home features a wall of triple-pane windows with open treetop views stretching toward Columbia University’s Morningside campus. Enjoy radiant afternoon light, beautiful sunsets, and a remarkably peaceful interior thanks to superior soundproofing. With a 421a tax abatement in place through 2037, the mont
Key facts
- Rich maple cabinets
- Toto washlet
- $1,203 HOA
Tags
Property features AI
Finance
- Other: Multi-unit building with 28 total units
- HOA & community: Monthly association fee of $1,203
Exterior
- Home design: Located on 7th floor; Building has 7 stories; Lancaster Madison building
- Exterior features: West-facing exposure; Has view
Interior
- Kitchen: Dishwasher
- Bedrooms: 4 total rooms (includes bedrooms and living areas)
- Flooring: Hardwood
- Bathrooms: 1 full bathroom
- Heating & cooling: Wall furnace heating; Wall unit cooling
- Interior features: Entrance foyer; Walk-in closet(s); Unfurnished
- Laundry & utility: In-unit washer and dryer
Neighborhood map
What this means for you Summary
Snapshot
- This is a 2-bed/1.0-bath condo listed at $650k.
Deal economics
- At list price, monthly cash flow is $-1k ($-15k/yr) — negative.
- To cash-flow at today's rent, offer at most $472k (27.4% below list).
- To meet the 1% rule (rent ≥ 1% of price), the offer needs to be $565k (13.0% below list).
- Recommended offer: $472k (27.4% below list) — sets the bar for cash-flow.
- Cap rate 4.0% vs local median 2.6% in New York — top-decile yield for the area; either an underpriced asset or a hidden risk that comps aren't pricing in. Stress-test before assuming the spread holds.
Location & tenants
- Location reads 75/100 on livability (#268 in NY, #4,188 nationally) — a middle-class / working-renter tenant base. Strengths: amenities A+, commute A+, health & safety A; Watch: crime F, cost of living F.
- Market conditions: Rents rising fast (+5.6%/yr); 71 active listings in the ZIP; 34 comparable units currently listed for rent nearby; rentals leasing fast (median 12d on market — plan ~1-2 weeks tenant-placement turnaround); 4,467 units permitted in New York County in 2024 (4,463 in 5+ unit buildings).
- At $5,652/mo this rent would consume 150% of the median local household income ($45k/yr) (locally 3992% of renters already pay >50% of income on rent) — very limited rent-growth headroom before tenants either downsize or default.
Forward outlook
- In year one you build about $25k of equity ($4k loan paydown + $21k appreciation (3.2% local appreciation)).
- New York County population projected at +21% by 2050 — long-run rental-demand tailwind backs the buy-and-hold thesis.
- By year 2, paydown + projected appreciation supports a ~$41k cash-out refi (75% LTV) — recoverable capital for the next deal without selling this one.
Negotiation context
- It's been on market 113 days — a 9% lower offer ($592k) is reasonable based on typical stale-listing flexibility.
- 2 sale attempts since 11y ago; this cycle's ask has dropped $50k (7%) from the opening price — seller is motivated, your offer sets the floor, not the list.
Risks & watch-outs
- Watch-outs: HOA is 21% of rent.
- Climate carrying-cost: major wind risk, 27% chance of damaging wind over 30y; extreme-heat days projected 7→15/yr by 2055 (HVAC capex compounding) — expect insurance premiums to compound above CPI over the hold.
Questions for the listing agent
- What do current leases actually rent for vs. the listed asking? Can we see a recent rent roll and the last 12 months of T-12 income?
- It's been on market 113 days. Have you received any prior offers? Is the seller open to a 27% concession, seller financing, or rate buy-down credit?
- What does the HOA fee cover, when was the last increase, and are there any pending special assessments or reserve-fund shortfalls?
- Any open or pending special assessments — roof, HVAC, plumbing, elevator, façade? What's the per-unit balance and payoff schedule, and is the seller paying it off at close or rolling it to the buyer?
- Why hasn't it sold? Are there any deal-killer items the seller is aware of (foundation, flood, title, zoning, code violations)?
- Is there a deadline driving the sale (1031 exchange, divorce, estate, relocation)? That informs how much negotiation room exists.
- Schools are B-rated — typically a magnet for longer-tenancy family renters. What's the average tenant stay here, and is there a school-zone premium baked into asking?
- Crime grade is F in this area — have there been break-ins, vandalism, or insurance claims at this property in the last 3 years? What carrier currently insures it and at what premium?
- The area grade is low — what's the realistic commute time and amenity access for the typical tenant pool here? Any planned neighborhood developments (good or bad) we should know about?
- What's the average days-on-market for RENTAL listings here right now (not sales)? A rising rental-DOM trend means longer vacancies and softer asking-rent achievability than the comps imply.
- What's the recent tenant-quality profile in this submarket — average credit score on applications, eviction rate, late-payment / NSF rate, and stable-employment percentage? A property-management company in the area should have these aggregated.
- How much new apartment / multifamily construction is in the pipeline within 1–3 miles? Heavy new supply (>2% of stock underway) typically softens rents 12–24 months out; light construction supports rent growth.
Investment metrics
- 1% rule
- 0.87% ✗
- Cap rate
- 4.02%
- Cash-on-cash
- -8.11%
- DSCR
- 0.64
- GRM
- 9.6
CMA / ARV
No comps found within radius.
Projected returns pro-forma
3.23% appreciation · 5.62% rent growth · sell at horizon
- IRR
- 2.2%
- Equity multiple
- 1.13×
- Total profit
- $24,084
- Equity at exit
- $300,774
- IRR
- 7.1%
- Equity multiple
- 2.16×
- Total profit
- $212,012
- Equity at exit
- $470,253
Cash invested: $182,000 (down + closing). Projections, not guarantees.
Landlord ↔ Tenant lean methodology
- Overall (CITY)
- 0 Strongly Tenant-Friendly
- State New York
- 15 Strongly Tenant-Friendly · D+10
- County
- — inherits STATE
- City New York
- 0 Strongly Tenant-Friendly · D+34
ZIP-level market 10035
- Home prices YoY
- 1.0%
- Rents YoY
- 5.6%
- Active inventory
- 71
- Price-to-rent
- 9.6×
Monthly cashflow live
- Estimated rent
- $5,652 high interval (Pro) →
- Mortgage (P&I)
- −$3,409
- Tax est. 1.5%
- −$812 /mo · $9,750/yr
- Insurance
- −$271
- HOA
- −$1,203
- Vacancy / Maint / Mgmt
- −$1,187
- Net cashflow
- $-1,230
Break-even live
UW: 25.0% down · 7.5% · 30yr · 1.5% tax · 5.0% vac · 8.0% maint · 8.0% mgmt
Financing live
Cash to close
- Down payment
- $162,500
- Closing costs
- $19,500
- Reserves months
- —
- Total cash needed
- —
Loan-product check · same deal, 3 products live
Conventional
25% down · 7.5% · 30yr
- Down + closing
- —
- Monthly P&I
- —
- Monthly cashflow
- —
- DSCR
- —
- Eligible?
- —
Personal DTI + credit; lowest rate.
DSCR
20% down · 8.5% · 30yr
- Down + closing
- —
- Monthly P&I
- —
- Monthly cashflow
- —
- DSCR
- —
- Eligible?
- —
No personal income docs; deal must DSCR.
Hard money
10% down · 12.0% · 12mo
- Down + closing
- —
- Monthly P&I
- —
- Monthly cashflow
- —
- DSCR
- —
- Eligible?
- —
Short-term bridge; refi at stabilization.
Rent comps 34 comps
| Address | Beds | Baths | Sqft | Rent | $/sqft | DOM | Units | Dist |
|---|---|---|---|---|---|---|---|---|
| 77 E 110th St Unit 1322508P New York, NY | 2.0 | 1.5 | 990 | $6,360 | $6.42 | 24d | 1 | 0.44mi |
| 230 W 126th St Unit 20C New York, NY | 2.0 | 1.0 | 860 | $4,555 | $5.30 | 24d | 1 | 0.62mi |
| 312 W 121st St Unit 5-A New York, NY | 3.0 | 1.0 | 800 | $4,655 | $5.82 | 11d | 1 | 0.67mi |
| 508 Manhattan Ave Unit 2C New York, NY | 3.0 | 1.0 | 800 | $4,699 | $5.87 | 11d | 1 | 0.68mi |
| 312 W 121st St Unit 4C New York, NY | 3.0 | 2.0 | 900 | $4,854 | $5.39 | 7d | 1 | 0.68mi |
| 506 Manhattan Ave Unit 1A New York, NY | 3.0 | 1.0 | 800 | $4,699 | $5.87 | 11d | 1 | 0.69mi |
| 319 E 109th St Unit 1021947P New York, NY | 3.0 | 1.0 | 818 | $7,260 | $8.88 | 5d | 1 | 0.70mi |
| 5 Lincoln Ave Bronx, NY | 1.0–3.0 | 1.0–2.5 | 1011 | $5,134 | $5.08 | 1d | 183 | 0.79mi |
| 2413 3rd Ave Bronx, NY | 1.0–3.0 | 1.0–2.0 | 857 | $3,948 | $4.60 | 11d | 23 | 0.80mi |
| 1635 Lexington Ave Unit 6D New York, NY | 2.0 | 2.0 | 1112 | $6,000 | $5.40 | 24d | 1 | 0.80mi |
| 132 W 134th St New York, NY | 2.0 | 1.0 | 750 | $4,500 | $6.00 | 24d | 1 | 0.84mi |
| 30 Morningside Dr #2096 New York, NY | 1.0–2.0 | 1.0–2.0 | 780 | $9,000 | $11.53 | 3d | 2 | 0.88mi |
| 122 E 102nd St Unit 1021896P New York, NY | 2.0 | 1.0 | 742 | $5,429 | $7.32 | 16d | 1 | 0.88mi |
| 1 Morningside Dr New York, NY | 3.0 | 1.0–2.0 | 1655 | $8,145 | $4.92 | 1d | 1 | 0.93mi |
| 300 W 135th St Unit 9G New York, NY | 3.0 | 2.0 | 1032 | $5,500 | $5.33 | 5d | 1 | 1.01mi |
| 420 Central Park W Unit 6K New York, NY | 2.0 | 2.0 | 1060 | $8,000 | $7.55 | 22d | 1 | 1.04mi |
| 543 W 122nd St New York, NY | 2.0 | 1.0–2.0 | 1057 | $10,995 | $10.40 | 2d | 7 | 1.06mi |
| 1501 Lexington Ave #932 New York, NY | 1.0 | 1.0 | 583 | $5,580 | $9.56 | 3d | 2 | 1.13mi |
| 175 E 96th St Unit 1251683P New York, NY | 2.0 | 1.0 | 600 | $6,380 | $10.63 | 2d | 2 | 1.17mi |
| 215 E 96th St Unit 688 New York, NY | 1.0 | 1.0 | 717 | $7,960 | $11.10 | 3d | 1 | 1.19mi |
| 53-55 E 95th St Unit 4A New York, NY | 3.0 | 2.0 | 803 | $7,495 | $9.33 | 7d | 1 | 1.19mi |
| 215 E 95th St #1293 New York, NY | 1.0–2.0 | 1.0–1.5 | 740 | $6,100 | $8.24 | 1d | 2 | 1.24mi |
| 202 W 102nd St Unit 1053014P New York, NY | 2.0 | 2.0 | 538 | $10,000 | $18.59 | 22d | 1 | 1.30mi |
| 808 Columbus Ave New York, NY | 2.0 | 1.0–2.0 | 773 | $9,876 | $12.78 | 1d | 31 | 1.30mi |
| 308 W 107th St Unit 1239985P New York, NY | 1.0 | 1.0 | 559 | $8,500 | $15.21 | 22d | 1 | 1.30mi |
| 50 W 97th St #1739 New York, NY | 2.0 | 1.0 | 800 | $6,560 | $8.20 | 6d | 1 | 1.31mi |
| 788 Columbus Ave #1323 New York, NY | 1.0–3.0 | 1.0–1.5 | 900 | $6,320 | $7.02 | 24d | 2 | 1.33mi |
| 915 W End Ave #1020 New York, NY | 1.0–3.0 | 1.0–2.0 | 851 | $7,375 | $8.67 | 1d | 2 | 1.34mi |
| 814 Amsterdam Ave #1019 New York, NY | 1.0–2.0 | 1.0–2.0 | 800 | $5,270 | $6.59 | 24d | 2 | 1.36mi |
| 345 E 94th St #1470 New York, NY | 2.0 | 1.0–2.0 | 710 | $7,570 | $10.65 | 3d | 3 | 1.36mi |
| 70 W 95th St New York, NY | 1.0–4.0 | 1.0–2.0 | 1095 | $13,166 | $12.02 | 17d | 1 | 1.42mi |
| 160 W 97th St #1101 New York, NY | 2.0 | 1.0 | 850 | $6,050 | $7.12 | 14d | 1 | 1.42mi |
| 118 E 91st St Unit 1022052P New York, NY | 3.0 | 1.0 | 592 | $6,180 | $10.44 | 7d | 1 | 1.42mi |
| 1377 Lexington Ave Unit 5CC New York, NY | 2.0 | 1.0 | 796 | $5,100 | $6.41 | 20d | 1 | 1.44mi |
HOA detail condo
- Monthly dues
- $1,203 · $14,436/yr
- Assessments
- None detected in remarks — confirm with the listing agent.
Listing history 14 events
-
2026-06-18days on market $650,000 Active 113 DOM
-
2026-06-17days on market $650,000 Active 112 DOM
-
2026-06-15days on market $650,000 Active 110 DOM
-
2026-06-13days on market $650,000 Active 108 DOM
-
2026-06-10days on market $650,000 Active 104 DOM
-
2026-06-08days on market $650,000 Active 103 DOM
-
2026-06-08days on market $650,000 Active 102 DOM
-
2026-06-04days on market $650,000 Active 99 DOM
-
2026-06-03days on market $650,000 Active 98 DOM
-
2026-06-01days on market $650,000 Active 96 DOM
-
2026-05-31days on market $650,000 Active 95 DOM
-
2026-04-29price $650,000
-
2026-02-22$700,000 Active
-
2015-08-21$659,000
ⓘ Source: listings_history table (triggers on properties + properties_extension) + one-shot
backfill from property_details.listing_events for pre-trigger history.
Climate risk First Street
- Flood 1/10 Low FEMA zone X (unshaded) · 0% chance over 30 yrs
- Wildfire 1/10 Low
- Heat 7/10 Severe 7 d/yr ≥99°F today · 15 d/yr by 30 yrs out
- Wind 6/10 Major 27% chance of damaging wind over 30 yrs
- Air quality 4/10 Moderate 5 unhealthy d/yr today · 6 by 30 yrs out
Nearby sold comps map
Loading sold comps map…
Walkable amenities ~0.75 mi
Loading nearby amenities…
Taxation est. · year 1
- Rental income
- $67,826
- − Mortgage interest
- −$36,410
- − Property taxes
- −$9,750
- − Insurance
- −$3,250
- − Repairs & maintenance
- −$5,426
- − Management
- −$5,426
- − HOA
- −$14,436
- − Depreciation
- −$18,909
- Taxable loss
- −$25,782
- Est. tax savings @ 24.0%
- +$6,188
- After-tax cash flow
- $-8,570/yr
For passive investors: Depreciation is non-cash, so a rental often shows a tax loss while cash-flowing — sheltering income. Rental losses are passive: they offset passive income freely, and up to $25,000/yr can offset ordinary (W-2) income if you actively participate and your MAGI is under $100k (phasing out to $0 by $150k); unused losses carry forward. On sale, claimed depreciation is recaptured at up to 25%, and gains may owe capital-gains tax (a 1031 exchange can defer both). Figures are a year-1 estimate at your 24.0% rate — not tax advice; consult a CPA.
Schools (NCES district)
No district data.
Livability — New York
- Score
- 75/100
- State rank
- #268
- US rank
- #4188
Category grades
Schools grade is shown separately in the Schools card above.
Census & demographics
- Census place
- New York, NY
- County
- New York County · 1,599,927 people
- City population
- 7,731,280
- Metro
- New York-Newark-Jersey City, NY-NJ-PA
- Population (ZIP)
- 38,862
- Household income
- $45,121
- Rent vs Own
- Severe rent burden
- 3992.0
Population outlook (New York County) Hauer SSP2
- Today (2025)
- 1,825,725 people
- By 2030
- 1,904,611 · +4.3%
- By 2040
- 2,052,719 · +12.4%
- By 2050
- 2,206,601 · +20.9%
- By 2075
- 2,509,427 · +37.4%
- By 2100
- 2,702,933 · +48.0%
Race, ethnicity, and origin ACS 2023
- Neighborhood character
- Diverse neighborhood (Simpson 0.68)
- Race & ethnicity
- Hispanic / Latino 42% Black 35% White 14% Two or more races 13% Asian 6% Native American 2%
- Hispanic origin (detail)
- Mexican 5% Puerto Rican 16% Dominican 10%
- Common ancestry
- Lithuanian 2% Romanian 1% Scotch-Irish 1%
- Foreign-born
- 23% · Canada, China, Jamaica
- Languages at home
- 54% English-only · Spanish 34% Other Indo-European 3% Russian/Polish/Slavic 2%
Political lean MEDSL · New York
- 2024 margin
- Solid D (+64.8) · D 82.4% · R 17.6%
- 2008→2024 swing
- -7.4pp toward R · 2008: 72.2pp · 2024: 64.8pp
- All cycles
- 2024: D+64.8 2020: D+74.5 2016: D+77.2 2012: D+69.6 2008: D+72.2
Not yet ingested
- Civics
- —
Market trends
- HPI YoY
- ▲ 3.23%
- Current HPI
- 317.1637
- Rent YoY
- ▲ 5.62%
- Metro
- New York-Newark-Jersey City, NY-NJ-PA
- State GDP YoY
- ▲ 2.60%
- F500 in state
- 92
Industry mix (Fortune 500 HQ in NY)
| Industry | F500 HQs | Revenue |
|---|---|---|
| Financial Services | 10 | $950B |
|
||
| Consumer Goods | 9 | $162B |
|
||
| Insurance | 4 | $225B |
|
||
| Telecommunications | 2 | $144B |
|
||
| Pharmaceuticals | 2 | $112B |
|
||
| Media / Entertainment | 2 | $69B |
|
||
Price history
-1.4% since first listed3 events — show timeline
- 2026-04-29 Price Changed $650,000 RLS at REBNY
- 2026-02-22 Listed $700,000 RLS at REBNY
- 2015-08-21 Listed $659,000 RLS at REBNY
Cash-flow waterfall
monthlySold comps — $/sqft
last 12 mo · ≤1 miLoading sold comps…