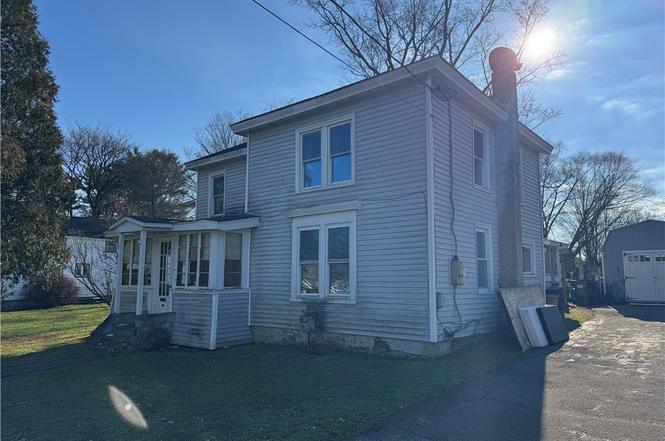
31 Grove St · Homer, NY
Flood risk 1/10 · Minimal
- FEMA flood zone
- X (unshaded)
- Chance of flooding over 30 yrs
- 0.0%
- Est. flood insurance / yr
- $473 – $860
Fire risk 1/10 · Minimal
- Est. fire insurance / yr
- $691 – $1,283
Heat risk 2/10 · Minimal
- Hot days now (above 95°F)
- 7 days/yr
- Hot days in 30 yrs
- 15 days/yr
Wind risk 2/10 · Minimal
- Chance of severe wind over 30 yrs
- 1.0%
Air-quality risk 2/10 · Minimal
- Unhealthy air days now
- 0 days/yr
- Unhealthy air days in 30 yrs
- 1 days/yr
Risk factors via First Street. Map © Google.
Why this score? — see what drove the B grade
The composite is a weighted blend of 9 inputs, each scored 0–100. Each bar is that input's sub-score; the figure is the points it added to the 100-point composite (weight × sub-score).
- Cash flow +25.1/30.0
- 1% rule +9.6/10.0
- Appreciation +8.4/10.0
- DSCR +8.2/10.0
- ARV discount +7.5/15.0
- Schools +4.7/10.0
- Livability +3.8/5.0
- Rent growth +2.5/5.0
- Condition / age +2.5/5.0
$95,000
🖨 Deal sheet 📄 Offer letter ✓ Due diligence
Listing remarks
Three-bedroom, two-bath, two-story single-family home located within the Village of Homer. The property offers a functional layout and a backyard suitable for various outdoor uses. A large exterior shed provides additional storage space. The home will require updates and is well-suited for buyers looking for a project or renovation opportunity. Convenient village location with access to local services and amenities.
Key facts
- Large exterior shed
- 9,583 sq ft lot
- Built 1874
Tags
Neighborhood map
What this means for you Summary
Snapshot
- This is a 3-bed/2.0-bath single-family listed at $95k.
Deal economics
- At list price, monthly cash flow is $210 ($3k/yr) — positive.
- The deal already cash-flows at list — no discount required.
- Meets the 1% rule at list price ($1k rent vs $95k).
- Cap rate 9.0% vs local median 3.4% in Homer — top-decile yield for the area; either an underpriced asset or a hidden risk that comps aren't pricing in. Stress-test before assuming the spread holds.
Location & tenants
- Location reads 76/100 on livability (#229 in NY, #3,609 nationally) — a middle-class / working-renter tenant base. Strengths: housing A+, health & safety A+, cost of living A; Watch: amenities F, commute F.
- Homer Central School District (town): math 49% / reading 59% proficiency, ranked #306 of 590 in NY (top 52%) — acceptable for families but not a draw, mixed tenant base, ~2y average lease.
- Market conditions: 39 active listings in the ZIP; 45 units permitted in Cortland County in 2024 (12 in 5+ unit buildings).
Forward outlook
- In year one you build about $7k of equity ($657 loan paydown + $7k appreciation (6.9% local appreciation)).
- Cortland County population projected at -15% by 2050 — secular population decline; favor cash flow + early exit over multi-decade hold.
- At projected returns (6.9% appreciation + 3.0% rent growth), your $27k cash investment doubles in ~3 years — after that, you're playing with house money.
- By year 5, paydown + projected appreciation supports a ~$32k cash-out refi (75% LTV) — recoverable capital for the next deal without selling this one.
Negotiation context
- Only 2 days on market — expect competitive offers; lowballing is unlikely to land.
Risks & watch-outs
- Watch-outs: property tax is 4.3% of price; built in 1874 — expect roof / HVAC / electrical / plumbing capex.
Questions for the listing agent
- Built in 1874 — when were the roof, HVAC, electrical panel, plumbing, and water heater last replaced?
- Property tax is high relative to price — has the assessment been appealed recently, and will the sale trigger a re-assessment?
- Is there a deadline driving the sale (1031 exchange, divorce, estate, relocation)? That informs how much negotiation room exists.
- Schools are B-rated — typically a magnet for longer-tenancy family renters. What's the average tenant stay here, and is there a school-zone premium baked into asking?
- What's the average days-on-market for RENTAL listings here right now (not sales)? A rising rental-DOM trend means longer vacancies and softer asking-rent achievability than the comps imply.
- What's the recent tenant-quality profile in this submarket — average credit score on applications, eviction rate, late-payment / NSF rate, and stable-employment percentage? A property-management company in the area should have these aggregated.
- How much new for-sale + rental construction is in the pipeline within 1–3 miles? Heavy new supply typically softens prices + rents 12–24 months out; constrained supply supports both.
Investment metrics
- 1% rule
- 1.46% ✓
- Cap rate
- 8.95%
- Cash-on-cash
- 9.49%
- DSCR
- 1.42
- GRM
- 5.7
CMA / ARV
- ARV (on-the-fly)
- $191,360
- Comps found
- 12
Show comp detail 12 sales within ~0.75 mi
| Address | Dist | Beds/Ba | Sqft | Sold | Price | $/sf | Match |
|---|---|---|---|---|---|---|---|
| 94 Cayuga St | 0.21mi | 3/1.0 | 1,378 (-6%) | 4mo | $188,000 | $136 | 72 |
| 21 Prospect St | 0.28mi | 3/1.5 | 1,344 (-9%) | 3mo | $250,000 | $186 | 68 |
| 11 Grove St | 0.14mi | 3/1.5 | 1,526 (+4%) | 22mo | $150,000 | $98 | 67 |
| 60 N West St | 0.31mi | 3/1.5 | 1,504 (+2%) | 19mo | $115,000 | $76 | 64 |
| 44 Center St | 0.39mi | 3/1.0 | 1,358 (-8%) | 16mo | $145,000 | $107 | 51 |
| 53 Clinton St | 0.40mi | 4/1.5 (+1) | 1,612 (+10%) | 10mo | $269,000 | $167 | 50 |
| 9 King St | 0.15mi | 4/1.0 (+1) | 1,344 (-9%) | 23mo | $175,000 | $130 | 50 |
| 41 Hudson St | 0.37mi | 3/1.0 | 1,260 (-14%) | 10mo | $209,000 | $166 | 46 |
| 1 Suits Ave | 0.65mi | 3/2.0 | 1,540 (+5%) | 21mo | $220,000 | $143 | 44 |
| 28 Warren St | 0.46mi | 3/2.0 | 1,628 (+11%) | 23mo | $179,220 | $110 | 41 |
| 96 Clinton St | 0.56mi | 3/1.5 | 1,269 (-14%) | 21mo | $138,000 | $109 | 31 |
| 4 Copeland Ave | 0.68mi | 4/1.5 (+1) | 1,584 (+8%) | 24mo | $201,500 | $127 | 29 |
Match score weights: distance 35% · size 25% · config 20% · recency 20%. Top-matched comps best support the ARV.
Projected returns pro-forma
6.86% appreciation · 3.0% rent growth · sell at horizon
- IRR
- 25.1%
- Equity multiple
- 2.73×
- Total profit
- $45,889
- Equity at exit
- $64,937
- IRR
- 23.2%
- Equity multiple
- 5.65×
- Total profit
- $123,775
- Equity at exit
- $122,548
Cash invested: $26,600 (down + closing). Projections, not guarantees.
Landlord ↔ Tenant lean methodology
- Overall (STATE)
- 15 Strongly Tenant-Friendly
- State New York
- 15 Strongly Tenant-Friendly · D+10
- County
- — inherits STATE
- City
- — inherits STATE
ZIP-level market 13077
- Home prices YoY
- 2.4%
- Active inventory
- 39
- Price-to-rent
- 5.7×
Monthly cashflow live
- Estimated rent
- $1,383 medium interval (Pro) →
- Mortgage (P&I)
- −$498
- Tax from tax record
- −$344 /mo · $4,131/yr
- Insurance
- −$40
- HOA
- −$0
- Vacancy / Maint / Mgmt
- −$290
- Net cashflow
- $210
Break-even live
UW: 25.0% down · 7.5% · 30yr · 1.5% tax · 5.0% vac · 8.0% maint · 8.0% mgmt
Financing live
Cash to close
- Down payment
- $23,750
- Closing costs
- $2,850
- Reserves months
- —
- Total cash needed
- —
Loan-product check · same deal, 3 products live
Conventional
25% down · 7.5% · 30yr
- Down + closing
- —
- Monthly P&I
- —
- Monthly cashflow
- —
- DSCR
- —
- Eligible?
- —
Personal DTI + credit; lowest rate.
DSCR
20% down · 8.5% · 30yr
- Down + closing
- —
- Monthly P&I
- —
- Monthly cashflow
- —
- DSCR
- —
- Eligible?
- —
No personal income docs; deal must DSCR.
Hard money
10% down · 12.0% · 12mo
- Down + closing
- —
- Monthly P&I
- —
- Monthly cashflow
- —
- DSCR
- —
- Eligible?
- —
Short-term bridge; refi at stabilization.
Listing history 2 events
-
2025-12-04status Pending
-
2025-12-02$95,000 Active
ⓘ Source: listings_history table (triggers on properties + properties_extension) + one-shot
backfill from property_details.listing_events for pre-trigger history.
Tax reassessment forecast NY · Partial reset (capped growth)
- Current annual tax
- $4,131 · $344/mo
- Projected year-2 tax
- $4,131 · $344/mo
- Expected delta
- $0/yr ($0/mo · 0.0%)
ⓘ Screening estimate from a state-policy table — verify with the county assessor before closing.
Climate risk First Street
- Flood 1/10 Low FEMA zone X (unshaded) · 0% chance over 30 yrs
- Wildfire 1/10 Low
- Heat 2/10 Low 7 d/yr ≥95°F today · 15 d/yr by 30 yrs out
- Wind 2/10 Low 100% chance of damaging wind over 30 yrs
- Air quality 2/10 Low 0 unhealthy d/yr today · 1 by 30 yrs out
Nearby sold comps map
Loading sold comps map…
Walkable amenities ~0.75 mi
Loading nearby amenities…
Taxation est. · year 1
- Rental income
- $16,594
- − Mortgage interest
- −$5,321
- − Property taxes
- −$4,131
- − Insurance
- −$475
- − Repairs & maintenance
- −$1,327
- − Management
- −$1,327
- − Depreciation
- −$2,764
- Taxable income
- $1,247
- Est. tax owed @ 24.0%
- −$299
- After-tax cash flow
- $2,225/yr
For passive investors: Depreciation is non-cash, so a rental often shows a tax loss while cash-flowing — sheltering income. Rental losses are passive: they offset passive income freely, and up to $25,000/yr can offset ordinary (W-2) income if you actively participate and your MAGI is under $100k (phasing out to $0 by $150k); unused losses carry forward. On sale, claimed depreciation is recaptured at up to 25%, and gains may owe capital-gains tax (a 1031 exchange can defer both). Figures are a year-1 estimate at your 24.0% rate — not tax advice; consult a CPA.
Schools (NCES district)
- District
- Homer Central School District
- NCES district ID
- 3614640
- Math proficiency
- 49% ▼ -1.00%
- Reading proficiency
- 59% ▲ 9.00%
- Median HH income
- $60,122
- Composite
- 47.03/100
- National rank
- #2342
- State rank
- #306 of 590 in NY
Livability — Homer
- Score
- 76/100
- State rank
- #229
- US rank
- #3609
Category grades
Schools grade is shown separately in the Schools card above.
Census & demographics
- Census place
- Homer, NY
- Population (ZIP)
- 6,567
Population outlook (Cortland County) Hauer SSP2
- Today (2025)
- 47,543 people
- By 2030
- 46,107 · -3.0%
- By 2040
- 43,122 · -9.3%
- By 2050
- 40,216 · -15.4%
- By 2075
- 34,717 · -27.0%
- By 2100
- 28,953 · -39.1%
Race, ethnicity, and origin ACS 2023
- Neighborhood character
- Predominantly White (95%)
- Race & ethnicity
- White 95% Two or more races 3% Asian 2%
- Common ancestry
- Romanian 3% Slovak 3% Serbian 2%
- Foreign-born
- 2% · China
- Languages at home
- 94% English-only · Other Indo-European 2% French/Haitian/Cajun 2% Chinese 2%
Political lean MEDSL · Cortland
- 2024 margin
- Lean R (+6.4) · D 46.8% · R 53.2%
- 2008→2024 swing
- -16.4pp toward R · 2008: 10.0pp · 2024: -6.4pp
- All cycles
- 2024: R+6.4 2020: R+1.9 2016: R+6.7 2012: D+8.8 2008: D+10.0
Not yet ingested
- Civics
- —
Market trends
- HPI YoY
- ▲ 6.86%
- Current HPI
- 298.7707
- Rent YoY
- —
- Metro
- —
- State GDP YoY
- ▲ 2.60%
- F500 in state
- 92
Industry mix (Fortune 500 HQ in NY)
| Industry | F500 HQs | Revenue |
|---|---|---|
| Financial Services | 10 | $950B |
|
||
| Consumer Goods | 9 | $162B |
|
||
| Insurance | 4 | $225B |
|
||
| Telecommunications | 2 | $144B |
|
||
| Pharmaceuticals | 2 | $112B |
|
||
| Media / Entertainment | 2 | $69B |
|
||
Price history
2 events — show timeline
- 2025-12-04 Pending — CNYIS
- 2025-12-02 Listed $95,000 CNYIS
Property tax history
-0.7%/yrLatest (2025): $4,131 · +5.4% YoY. Source: county tax records.
Cash-flow waterfall
monthlySold comps — $/sqft
last 12 mo · ≤1 miLoading sold comps…