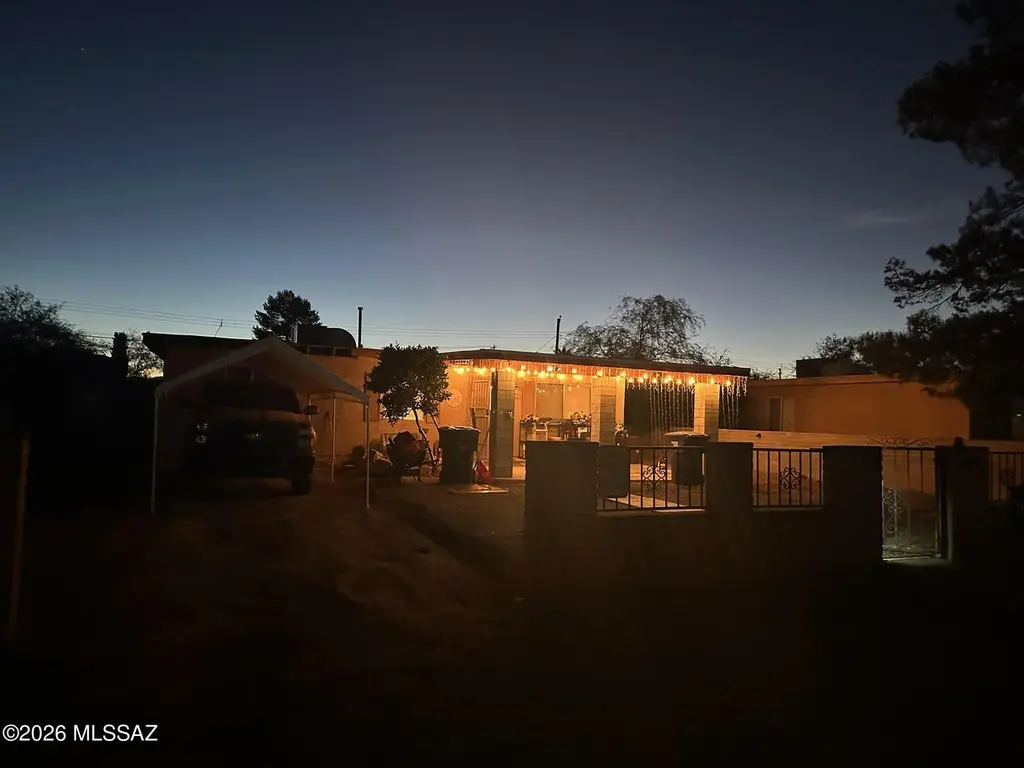
6725 S Downing Ave · Tucson, AZ
Flood risk 2/10 · Minimal
- FEMA flood zone
- X (shaded)
- Chance of flooding over 30 yrs
- 0.05%
- Est. flood insurance / yr
- $507 – $1,088
Fire risk 6/10 · Moderate
- Est. fire insurance / yr
- $610 – $1,132
Heat risk 8/10 · Major
- Hot days now (above 104°F)
- 6 days/yr
- Hot days in 30 yrs
- 16 days/yr
Wind risk 1/10 · Minimal
- Chance of severe wind over 30 yrs
- —
Air-quality risk 1/10 · Minimal
- Unhealthy air days now
- 0 days/yr
- Unhealthy air days in 30 yrs
- 0 days/yr
Risk factors via First Street. Map © Google.
Why this score? — see what drove the C- grade
The composite is a weighted blend of 9 inputs, each scored 0–100. Each bar is that input's sub-score; the figure is the points it added to the 100-point composite (weight × sub-score).
- Cash flow +18.3/30.0
- ARV discount +12.3/15.0
- DSCR +5.7/10.0
- 1% rule +3.9/10.0
- Livability +3.7/5.0
- Rent growth +2.9/5.0
- Condition / age +2.5/5.0
- Schools +1.0/10.0
- Appreciation +0.0/10.0
$239,000
🖨 Deal sheet 📄 Offer letter ✓ Due diligence
Listing remarks MLS
Beautiful brand new wood laminate floors and ceramic tile throughout. No Carpet. Freshly painted throughtout. Bright open floorplan. Oversized kitchen with large eating area. Ceiling fans. Split bedroom plan with three oversized bedrooms on one side of the house and one very private bedroom, with oversized closet, on the other side of the house. Huge backyard with patio and drive -in gate. Great access to Interstate 10. A Must See! Lots of house for the price!
Key facts
- Oversized kitchen
- Ceramic tile
- Large dining area
Tags
Property features AI
Exterior
- Security: Smoke detector(s)
- Utilities: Public water; Sewer connected
- Home design: Single-family residence; One-story; Faces west
- Construction: Frame and stucco construction; Built-up reflective roof; Built in 2026
- Exterior features: Covered patio; Patio; Block and chain-link fencing; Paved road access; Subdivided lot
Interior
- Kitchen: Dishwasher; Refrigerator; Gas range
- Flooring: Ceramic tile; Laminate
- Bathrooms: 1 full bathroom
- Heating & cooling: Forced air electric heating; Central air conditioning
- Interior features: Exhaust fan; Smoke detector(s)
- Laundry & utility: Dedicated laundry room
Neighborhood map
What this means for you Summary
Snapshot
- This is a 4-bed/1.0-bath single-family listed at $239k.
Deal economics
- At list price, monthly cash flow is $217 ($3k/yr) — positive.
- The deal already cash-flows at list — no discount required.
- To meet the 1% rule (rent ≥ 1% of price), the offer needs to be $212k (11.4% below list).
- Recommended offer: $212k (11.4% below list) — sets the bar for 1% rule.
- Cap rate 7.4% vs local median 3.7% in Tucson — top-decile yield for the area; either an underpriced asset or a hidden risk that comps aren't pricing in. Stress-test before assuming the spread holds.
Location & tenants
- Location reads 74/100 on livability (#17 in AZ, #4,502 nationally) — a middle-class / working-renter tenant base. Strengths: commute A+, cost of living A+, housing A+; Watch: health & safety C-, crime F, employment D-.
- Sunnyside Unified District (4407) (urban): math 9% / reading 15% proficiency, ranked #233 of 249 in AZ (top 94%) — low school quality limits family demand, transient renter base, plan for 1-2y turnover.
- Zoned schools: Craycroft Elementary School (math 12% / reading 22%, grade F, #814 of 1,109 statewide, top 76%, 590 students, 82% FRL); Billy Lane Lauffer Middle School (math 5% / reading 15%, grade F, #188 of 218 statewide, top 88%, 428 students, 75% FRL); Desert View High School (math 9% / reading 12%, grade F, #295 of 381 statewide, top 78%, 2,169 students, 69% FRL) — zoned schools average 75% FRL vs 56% district-wide (19 pts higher); higher-poverty schools than district average — tighter screening recommended.
- Market conditions: Rents rising (+1.5%/yr); 158 active listings in the ZIP; 8 comparable units currently listed for rent nearby; rentals at typical pace (median 24d on market — plan ~3-4 weeks tenant-placement turnaround); 5,268 units permitted in Pima County in 2024 (996 in 5+ unit buildings).
- This rent runs 35% of the median local income ($72k/yr) — at the standard rent-burdened threshold; future hikes will face affordability resistance.
Forward outlook
- Local home prices are declining (-3.0%/yr); year-one equity from $2k of loan paydown is wiped out by about $7k of value loss. Plan a longer hold.
- Pima County population projected at +8% by 2050 — modest demand growth; plan on rents tracking national, not racing it.
Negotiation context
- It's been on market 41 days — a 3% lower offer ($232k) is reasonable based on typical stale-listing flexibility.
- 5 sale attempts since 20y ago with the ask held roughly flat each time — persistent listings suggest the price (not the market) is what's stuck; bring a comps-based counter.
- Current owner paid $126k; list at $239k implies a 90% gain — meaningful room to come down on a strong offer.
Risks & watch-outs
- Climate carrying-cost: major wildfire risk; extreme-heat days projected 6→16/yr by 2055 (HVAC capex compounding) — expect insurance premiums to compound above CPI over the hold.
Questions for the listing agent
- It's been on market 41 days. Have you received any prior offers? Is the seller open to a 11% concession, seller financing, or rate buy-down credit?
- Built in 1971 — when were the roof, HVAC, electrical panel, plumbing, and water heater last replaced?
- Is there a deadline driving the sale (1031 exchange, divorce, estate, relocation)? That informs how much negotiation room exists.
- Schools are D-rated, which usually means shorter tenancies and higher turnover. Who's the typical renter profile here, and what's been the actual vacancy rate?
- Crime grade is F in this area — have there been break-ins, vandalism, or insurance claims at this property in the last 3 years? What carrier currently insures it and at what premium?
- What's the average days-on-market for RENTAL listings here right now (not sales)? A rising rental-DOM trend means longer vacancies and softer asking-rent achievability than the comps imply.
- What's the recent tenant-quality profile in this submarket — average credit score on applications, eviction rate, late-payment / NSF rate, and stable-employment percentage? A property-management company in the area should have these aggregated.
- How much new for-sale + rental construction is in the pipeline within 1–3 miles? Heavy new supply typically softens prices + rents 12–24 months out; constrained supply supports both.
Investment metrics
- 1% rule
- 0.89% ✗
- Cap rate
- 7.38%
- Cash-on-cash
- 3.89%
- DSCR
- 1.17
- GRM
- 9.4
CMA / ARV
- ARV (median comp)
- $267,302
- List price
- $239,000
- Delta
- -10.59%
- Verdict
- UNDERPRICED
- Comps
- 20 within 1.0 mi
Show comp detail 12 sales within ~0.75 mi
| Address | Dist | Beds/Ba | Sqft | Sold | Price | $/sf | Match |
|---|---|---|---|---|---|---|---|
| 5775 E Camino De Ayuda | 0.31mi | 3/2.0 (-1) | 1,268 (+2%) | 10mo | $285,000 | $225 | 65 |
| 6872 S Avenida De Aventura | 0.17mi | 3/2.0 (-1) | 1,141 (-8%) | 13mo | $279,900 | $245 | 58 |
| 5234 E Desert Straw Ln | 0.70mi | 3/2.0 (-1) | 1,256 (+1%) | 8mo | $264,900 | $211 | 51 |
| 5252 E Desert Straw Ln | 0.68mi | 3/2.0 (-1) | 1,256 (+1%) | 10mo | $275,000 | $219 | 50 |
| 5283 E Desert Straw Ln | 0.64mi | 3/2.0 (-1) | 1,321 (+6%) | 2mo | $282,000 | $213 | 50 |
| 6976 S Goshawk Dr | 0.50mi | 3/2.0 (-1) | 1,295 (+4%) | 14mo | $260,000 | $201 | 50 |
| 7172 S Shipmans Tale Ct | 0.67mi | 3/2.0 (-1) | 1,318 (+6%) | 7mo | $289,900 | $220 | 45 |
| 5295 E Agave Vista Dr | 0.53mi | 3/2.0 (-1) | 1,385 (+11%) | 4mo | $275,000 | $199 | 44 |
| 6169 E Stonechat Dr | 0.67mi | 3/2.0 (-1) | 1,212 (-3%) | 13mo | $262,500 | $217 | 44 |
| 6952 S Ladys Thumb Ln | 0.65mi | 3/2.5 (-1) | 1,340 (+8%) | 3mo | $260,000 | $194 | 44 |
| 7052 S Red Maids Dr | 0.72mi | 4/2.0 | 1,417 (+14%) | 5mo | $255,000 | $180 | 35 |
| 7021 S Red Maids Dr | 0.71mi | 3/2.5 (-1) | 1,431 (+15%) | 12mo | $290,000 | $203 | 22 |
Match score weights: distance 35% · size 25% · config 20% · recency 20%. Top-matched comps best support the ARV.
Projected returns pro-forma
-3.0% appreciation · 1.52% rent growth · sell at horizon
- IRR
- -11.8%
- Equity multiple
- 0.58×
- Total profit
- $-28,116
- Equity at exit
- $35,636
- IRR
- -4.7%
- Equity multiple
- 0.71×
- Total profit
- $-19,437
- Equity at exit
- $20,664
Cash invested: $66,920 (down + closing). Projections, not guarantees.
Landlord ↔ Tenant lean methodology
- Overall (STATE)
- 87 Strongly Landlord-Friendly
- State Arizona
- 87 Strongly Landlord-Friendly · R+3
- County
- — inherits STATE
- City
- — inherits STATE
ZIP-level market 85756
- Home prices YoY
- -19.4%
- Rents YoY
- 1.5%
- Active inventory
- 158
- Price-to-rent
- 9.4×
Monthly cashflow live
- Estimated rent
- $2,117 high interval (Pro) →
- Mortgage (P&I)
- −$1,253
- Tax from tax record
- −$103 /mo · $1,230/yr
- Insurance
- −$100
- HOA
- −$0
- Vacancy / Maint / Mgmt
- −$445
- Net cashflow
- $217
Break-even live
UW: 25.0% down · 7.5% · 30yr · 1.5% tax · 5.0% vac · 8.0% maint · 8.0% mgmt
Financing live
Cash to close
- Down payment
- $59,750
- Closing costs
- $7,170
- Reserves months
- —
- Total cash needed
- —
Loan-product check · same deal, 3 products live
Conventional
25% down · 7.5% · 30yr
- Down + closing
- —
- Monthly P&I
- —
- Monthly cashflow
- —
- DSCR
- —
- Eligible?
- —
Personal DTI + credit; lowest rate.
DSCR
20% down · 8.5% · 30yr
- Down + closing
- —
- Monthly P&I
- —
- Monthly cashflow
- —
- DSCR
- —
- Eligible?
- —
No personal income docs; deal must DSCR.
Hard money
10% down · 12.0% · 12mo
- Down + closing
- —
- Monthly P&I
- —
- Monthly cashflow
- —
- DSCR
- —
- Eligible?
- —
Short-term bridge; refi at stabilization.
Rent comps 8 comps
| Address | Beds | Baths | Sqft | Rent | $/sqft | DOM | Units | Dist |
|---|---|---|---|---|---|---|---|---|
| 6965 S Ladys Thumb Ln Tucson, AZ | 3.0 | 2.5 | 1340 | $1,750 | $1.31 | 14d | 1 | 0.61mi |
| 6385 S Ambarella Dr Tucson, AZ | 3.0 | 2.0 | 1465 | $1,799 | $1.23 | 3d | 1 | 0.62mi |
| 6974 S Ladys Thumb Ln Tucson, AZ | 3.0 | 3.0 | 1298 | $2,000 | $1.54 | 43d | 1 | 0.62mi |
| 7060 S Red Maids Dr Tucson, AZ | 4.0 | 2.0 | 1417 | $1,795 | $1.27 | 43d | 1 | 0.71mi |
| 5095 E Fishhook Ct Tucson, AZ | 3.0 | 2.0 | 1287 | $1,695 | $1.32 | 23d | 1 | 0.71mi |
| 7080 S Dunnock Dr Tucson, AZ | 3.0 | 1.0 | 1212 | $1,760 | $1.45 | 3d | 1 | 0.73mi |
| 6330 S Crescent Peak Dr Tucson, AZ | 3.0 | 2.0 | 1391 | $1,795 | $1.29 | 3d | 1 | 1.00mi |
| 6339 E Garden Stone Dr Tucson, AZ | 3.0 | 2.0 | 1284 | $1,695 | $1.32 | 43d | 1 | 1.50mi |
Listing history 34 events
-
2026-06-18days on market $239,000 Active 41 DOM
-
2026-06-17days on market $239,000 Active 40 DOM
-
2026-06-16days on market $239,000 Active 39 DOM
-
2026-06-15days on market $239,000 Active 38 DOM
-
2026-06-13days on market $239,000 Active 36 DOM
-
2026-06-13pricedays on market $239,000 Active 35 DOM
-
2026-06-10days on market $245,000 Active 33 DOM
-
2026-06-09days on market $245,000 Active 32 DOM
-
2026-06-08days on market $245,000 Active 31 DOM
-
2026-06-07days on market $245,000 Active 30 DOM
-
2026-06-05days on market $245,000 Active 27 DOM
-
2026-06-03days on market $245,000 Active 26 DOM
-
2026-06-02days on market $245,000 Active 25 DOM
-
2026-06-01days on market $245,000 Active 24 DOM
-
2026-05-31days on market $245,000 Active 23 DOM
-
2026-05-08$245,000 Active 804-char remark
-
2018-03-28status Pending 464-char remark
Show marketing remark (464 chars)
Beautiful brand new wood laminate floors and ceramic tile throughout. No Carpet. Freshly painted throughtout. Bright open floorplan. Oversized kitchen with large eating area. Ceiling fans. Split bedroom plan with three oversized bedrooms on one side of the house and one very private bedroom, with oversized closet, on the other side of the house. Huge backyard with patio and drive -in gate. Great access to Interstate 10. A Must See! Lots of house for the price!
-
2018-03-28soldstatus $125,500 Closed 464-char remark
Show marketing remark (464 chars)
Beautiful brand new wood laminate floors and ceramic tile throughout. No Carpet. Freshly painted throughtout. Bright open floorplan. Oversized kitchen with large eating area. Ceiling fans. Split bedroom plan with three oversized bedrooms on one side of the house and one very private bedroom, with oversized closet, on the other side of the house. Huge backyard with patio and drive -in gate. Great access to Interstate 10. A Must See! Lots of house for the price!
-
2018-03-16soldstatus $125,500
-
2018-02-15historical Active Contingent 464-char remark
Show marketing remark (464 chars)
Beautiful brand new wood laminate floors and ceramic tile throughout. No Carpet. Freshly painted throughtout. Bright open floorplan. Oversized kitchen with large eating area. Ceiling fans. Split bedroom plan with three oversized bedrooms on one side of the house and one very private bedroom, with oversized closet, on the other side of the house. Huge backyard with patio and drive -in gate. Great access to Interstate 10. A Must See! Lots of house for the price!
-
2018-02-12$119,900 Active 464-char remark
Show marketing remark (464 chars)
Beautiful brand new wood laminate floors and ceramic tile throughout. No Carpet. Freshly painted throughtout. Bright open floorplan. Oversized kitchen with large eating area. Ceiling fans. Split bedroom plan with three oversized bedrooms on one side of the house and one very private bedroom, with oversized closet, on the other side of the house. Huge backyard with patio and drive -in gate. Great access to Interstate 10. A Must See! Lots of house for the price!
-
2008-06-06historical
-
2008-02-07$129,900
-
2008-01-23soldstatus $87,500
-
2007-08-07$133,000
-
2006-07-31soldstatus $145,000
-
2006-07-31soldstatus $145,000
-
2006-02-02$154,900
-
2005-10-18soldstatus $85,000
-
2005-10-18soldstatus $90,000
-
1996-02-29soldstatus $56,000
-
1989-09-01soldstatus $41,000
-
1988-09-01soldstatus $40,000
-
1987-09-01soldstatus $42,800
ⓘ Source: listings_history table (triggers on properties + properties_extension) + one-shot
backfill from property_details.listing_events for pre-trigger history.
Tax reassessment forecast AZ · Resets to sale price
- Current annual tax
- $1,230 · $103/mo
- Projected year-2 tax
- $1,577 · $131/mo
- Expected delta
- +$347/yr (+$29/mo · 28.2%)
ⓘ Screening estimate from a state-policy table — verify with the county assessor before closing.
Climate risk First Street
- Flood 2/10 Low FEMA zone X (shaded) · 5% chance over 30 yrs
- Wildfire 6/10 Major
- Heat 8/10 Severe 6 d/yr ≥104°F today · 16 d/yr by 30 yrs out
- Wind 1/10 Low
- Air quality 1/10 Low 0 unhealthy d/yr today · 0 by 30 yrs out
Nearby sold comps map
Loading sold comps map…
Walkable amenities ~0.75 mi
Loading nearby amenities…
Taxation est. · year 1
- Rental income
- $25,401
- − Mortgage interest
- −$13,388
- − Property taxes
- −$1,230
- − Insurance
- −$1,195
- − Repairs & maintenance
- −$2,032
- − Management
- −$2,032
- − Depreciation
- −$6,953
- Taxable loss
- −$1,429
- Est. tax savings @ 24.0%
- +$343
- After-tax cash flow
- $2,944/yr
For passive investors: Depreciation is non-cash, so a rental often shows a tax loss while cash-flowing — sheltering income. Rental losses are passive: they offset passive income freely, and up to $25,000/yr can offset ordinary (W-2) income if you actively participate and your MAGI is under $100k (phasing out to $0 by $150k); unused losses carry forward. On sale, claimed depreciation is recaptured at up to 25%, and gains may owe capital-gains tax (a 1031 exchange can defer both). Figures are a year-1 estimate at your 24.0% rate — not tax advice; consult a CPA.
Schools (NCES district)
- District
- Sunnyside Unified District (4407)
- NCES district ID
- 0408170
- Math proficiency
- 9% ▼ -21.00%
- Reading proficiency
- 15% ▼ -14.00%
- Median HH income
- $34,365
- Composite
- 9.76/100
- National rank
- #9827
- State rank
- #233 of 249 in AZ
Livability — Tucson
- Score
- 74/100
- State rank
- #17
- US rank
- #4502
Category grades
Schools grade is shown separately in the Schools card above.
Census & demographics
- Census place
- Tucson, AZ
- County
- Pima County · 1,012,107 people
- City population
- 839,336
- Metro
- Tucson, AZ
- Population (ZIP)
- 37,700
- Household income
- $72,490
- Rent vs Own
- Severe rent burden
- 265.0
Population outlook (Pima County) Hauer SSP2
- Today (2025)
- 1,066,056 people
- By 2030
- 1,086,684 · +1.9%
- By 2040
- 1,117,160 · +4.8%
- By 2050
- 1,149,778 · +7.9%
- By 2075
- 1,271,480 · +19.3%
- By 2100
- 1,321,160 · +23.9%
Race, ethnicity, and origin ACS 2023
- Neighborhood character
- Diverse neighborhood (Simpson 0.56)
- Race & ethnicity
- Hispanic / Latino 59% White 29% Two or more races 23% Black 7% Native American 4% Asian 2%
- Hispanic origin (detail)
- Mexican 49%
- Common ancestry
- Italian 2% Slovak 1% Portuguese 1%
- Foreign-born
- 18% · Canada, China
- Languages at home
- 57% English-only · Spanish 39% Chinese 1%
Political lean MEDSL · Pima
- 2024 margin
- D (+15.2) · D 57.0% · R 41.8% · Other 1.2%
- 2008→2024 swing
- +9.1pp toward D · 2008: 6.1pp · 2024: 15.2pp
- All cycles
- 2024: D+15.2 2020: D+18.7 2016: D+13.5 2012: D+5.8 2008: D+6.1
Not yet ingested
- Civics
- —
Market trends
- HPI YoY
- ▼ -73.28%
- Current HPI
- 304.0243
- Rent YoY
- ▲ 1.52%
- Metro
- Tucson, AZ
- State GDP YoY
- ▲ 4.54%
- F500 in state
- 20
Industry mix (Fortune 500 HQ in AZ)
| Industry | F500 HQs | Revenue |
|---|---|---|
| Technology | 2 | $13B |
|
||
| Mining / Metals | 1 | $23B |
|
||
| Environmental Services | 1 | $16B |
|
||
| Metals / Steel | 1 | $14B |
|
||
| Technology Distribution | 1 | $9B |
|
||
| Homebuilding | 1 | $8B |
|
||
Price history
+458.4% since first listed20 events — show timeline
- 2026-06-12 Price Changed $239,000 MLSSAZ
- 2026-05-08 Listed $245,000 MLSSAZ
- 2018-03-28 Pending — MLSSAZ
- 2018-03-28 Sold (MLS) $125,500 MLSSAZ
- 2018-03-16 Sold (Public Records) $125,500 Public Records
- 2018-02-15 Contingent — MLSSAZ
- 2018-02-12 Listed $119,900 MLSSAZ
- 2008-06-06 Listing Removed — MLSSAZ
- 2008-02-07 Listed $129,900 MLSSAZ
- 2008-01-23 Sold (MLS) $87,500 MLSSAZ
- 2007-08-07 Listed $133,000 MLSSAZ
- 2006-07-31 Sold (Public Records) $145,000 Public Records
- 2006-07-31 Sold (MLS) $145,000 MLSSAZ
- 2006-02-02 Listed $154,900 MLSSAZ
- 2005-10-18 Sold (Public Records) $90,000 Public Records
- 2005-10-18 Sold (Public Records) $85,000 Public Records
- 1996-02-29 Sold (Public Records) $56,000 Public Records
- 1989-09-01 Sold (Public Records) $41,000 Public Records
- 1988-09-01 Sold (Public Records) $40,000 Public Records
- 1987-09-01 Sold (Public Records) $42,800 Public Records
Property tax history
+6.0%/yrLatest (2025): $1,230 · +4.5% YoY. Source: county tax records.
Cash-flow waterfall
monthlySold comps — $/sqft
last 12 mo · ≤1 miLoading sold comps…