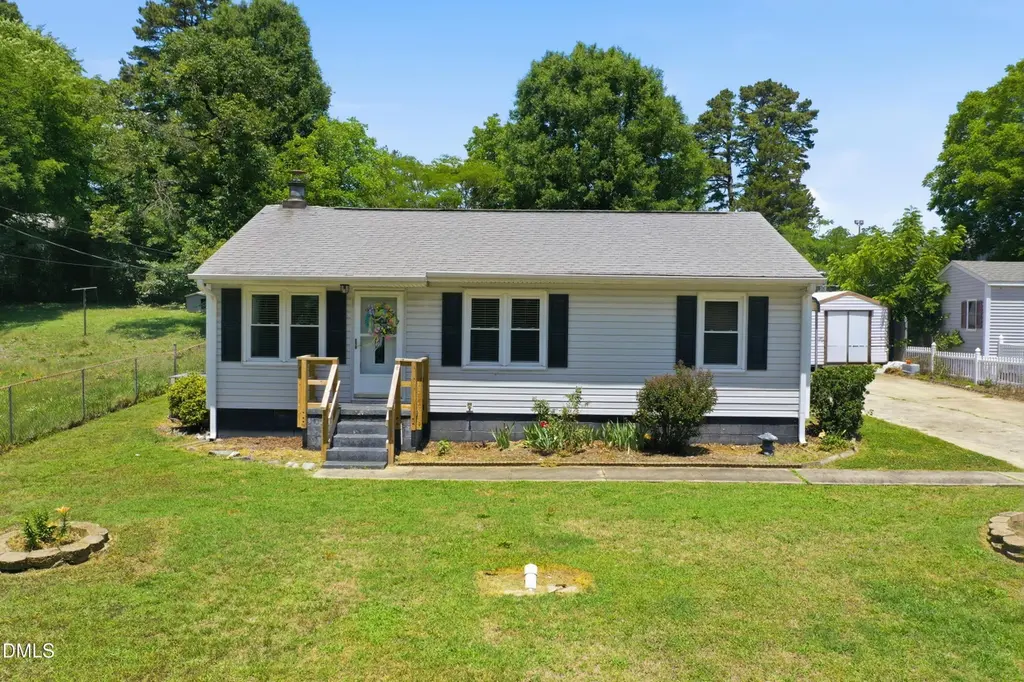
521 Graham Dr · Graham, NC
Flood risk 1/10 · Minimal
- FEMA flood zone
- X (unshaded)
- Chance of flooding over 30 yrs
- 0.0%
- Est. flood insurance / yr
- $507 – $1,088
Fire risk 1/10 · Minimal
- Est. fire insurance / yr
- $906 – $1,684
Heat risk 6/10 · Moderate
- Hot days now (above 105°F)
- 7 days/yr
- Hot days in 30 yrs
- 17 days/yr
Wind risk 5/10 · Moderate
- Chance of severe wind over 30 yrs
- 23.0%
Air-quality risk 2/10 · Minimal
- Unhealthy air days now
- 2 days/yr
- Unhealthy air days in 30 yrs
- 2 days/yr
Risk factors via First Street. Map © Google.
Why this score? — see what drove the C+ grade
The composite is a weighted blend of 9 inputs, each scored 0–100. Each bar is that input's sub-score; the figure is the points it added to the 100-point composite (weight × sub-score).
- Cash flow +22.8/30.0
- ARV discount +15.0/15.0
- DSCR +7.3/10.0
- 1% rule +4.6/10.0
- Livability +3.5/5.0
- Schools +3.0/10.0
- Rent growth +2.5/5.0
- Condition / age +2.5/5.0
- Appreciation +0.0/10.0
$150,000
🖨 Deal sheet (PDF) 📄 Offer letter ✓ Due diligence
Listing remarks MLS
FIXER UPPER Opportunity in convenient Graham location! One level home with 3 bedrooms, 1 bath. Living Room. Eat in Kitchen with Fridge/Stove/Washer/Dryer convey. Side deck. Metal carport. Multiple outbuildings/storage options. Paved driveway. Property will be sold AS IS. School zone: Newlin Elem, Graham Middle & Graham High. **Den & Family Room offer 350+ sq ft; Den has low ceiling (6'2) and Bonus Room is not heated/cooled. These spaces are not included in finished sq ftg**
Key facts
- Eat in kitchen
- Side deck
- Paved driveway
Tags
Property features AI
Finance
- Other: Property listed as fixer; Lot approximately 0.32 acre; City street with public maintenance and asphalt surface
- HOA & community: No association
Exterior
- Parking: Detached 2-space carport; Driveway (paved)
- Utilities: Public water; Public sewer; Natural gas connected; Sewer connected; Water connected
- Home design: Site-built single-story home; One level
- Construction: Block and vinyl siding construction; Block foundation; Shingle roof; Built as site-built
- Exterior features: Deck; Porch; Outbuilding; Storage (exterior)
Interior
- Kitchen: Free-standing electric oven; Kitchen laundry area
- Bedrooms: 3 bedrooms (all on the main level)
- Flooring: Carpet; Linoleum
- Bathrooms: 1 full bathroom
- Heating & cooling: No heating; Central air conditioning (electric); Gas pack cooling
- Interior features: Free-standing electric oven; Storage
- Laundry & utility: Laundry located in the kitchen
Neighborhood map
What this means for you Summary
Snapshot
- This is a 3-bed/1.0-bath single-family listed at $150k.
Deal economics
- At list price, monthly cash flow is $261 ($3k/yr) — positive.
- The deal already cash-flows at list — no discount required.
- To meet the 1% rule (rent ≥ 1% of price), the offer needs to be $144k (3.9% below list).
- Recommended offer: $144k (3.9% below list) — sets the bar for 1% rule.
- Cap rate 8.4% vs local median 3.3% in Graham — top-decile yield for the area; either an underpriced asset or a hidden risk that comps aren't pricing in. Stress-test before assuming the spread holds.
Location & tenants
- Location reads 69/100 on livability (#144 in NC) — a middle-class / working-renter tenant base. Strengths: cost of living A+, housing A+, health & safety A+; Watch: crime C-, schools D-, amenities F.
- Alamance-Burlington Schools (rural): math 30% / reading 40% proficiency, ranked #133 of 178 in NC (top 75%) — families likely to look elsewhere, expect single-tenant / working-renter base with shorter leases.
- Market conditions: 395 active listings in the ZIP; 13 comparable units currently listed for rent nearby; rentals at typical pace (median 23d on market — plan ~3-4 weeks tenant-placement turnaround); 2,466 units permitted in Alamance County in 2024 (403 in 5+ unit buildings).
Forward outlook
- Local home prices are declining (-3.0%/yr); year-one equity from $1k of loan paydown is wiped out by about $4k of value loss. Plan a longer hold.
- Alamance County population projected at +19% by 2050 — long-run rental-demand tailwind backs the buy-and-hold thesis.
Negotiation context
- Only 5 days on market — expect competitive offers; lowballing is unlikely to land.
- 2 sale attempts with the ask held roughly flat each time — persistent listings suggest the price (not the market) is what's stuck; bring a comps-based counter.
Risks & watch-outs
- Watch-outs: built in 1955 — expect roof / HVAC / electrical / plumbing capex.
- Climate carrying-cost: moderate wind risk, 23% chance of damaging wind over 30y; extreme-heat days projected 7→17/yr by 2055 (HVAC capex compounding) — expect insurance premiums to compound above CPI over the hold.
Questions for the listing agent
- Built in 1955 — when were the roof, HVAC, electrical panel, plumbing, and water heater last replaced?
- Is there a deadline driving the sale (1031 exchange, divorce, estate, relocation)? That informs how much negotiation room exists.
- Schools are D-rated, which usually means shorter tenancies and higher turnover. Who's the typical renter profile here, and what's been the actual vacancy rate?
- What's the average days-on-market for RENTAL listings here right now (not sales)? A rising rental-DOM trend means longer vacancies and softer asking-rent achievability than the comps imply.
- What's the recent tenant-quality profile in this submarket — average credit score on applications, eviction rate, late-payment / NSF rate, and stable-employment percentage? A property-management company in the area should have these aggregated.
- How much new for-sale + rental construction is in the pipeline within 1–3 miles? Heavy new supply typically softens prices + rents 12–24 months out; constrained supply supports both.
Investment metrics
- 1% rule
- 0.96% ✗
- Cap rate
- 8.38%
- Cash-on-cash
- 7.46%
- DSCR
- 1.33
- GRM
- 8.7
CMA / ARV
- ARV (on-the-fly)
- $186,068
- Comps found
- 12
Show comp detail 12 sales within ~0.75 mi
| Address | Dist | Beds/Ba | Sqft | Sold | Price | $/sf | Match |
|---|---|---|---|---|---|---|---|
| 311 W Gilbreath St | 0.59mi | 3/1.0 | 1,030 (+0%) | 4mo | $205,000 | $199 | 69 |
| 2123 Wiggins St | 0.69mi | 3/1.0 | 1,035 (+1%) | 2mo | $127,000 | $123 | 65 |
| 803 Buckner St | 0.44mi | 3/1.5 | 966 (-6%) | 7mo | $178,000 | $184 | 61 |
| 302 Bradley St | 0.44mi | 3/1.0 | 1,100 (+7%) | 9mo | $245,000 | $223 | 60 |
| 206 Border St | 0.31mi | 3/1.0 | 882 (-14%) | 7mo | $137,000 | $155 | 56 |
| 1215 Cleveland Ave | 0.65mi | 3/1.5 | 1,090 (+6%) | 3mo | $195,000 | $179 | 55 |
| 728 Ben Ct | 0.63mi | 3/1.5 | 1,120 (+9%) | 1mo | $220,000 | $196 | 53 |
| 369 Albany St | 0.71mi | 3/1.0 | 1,049 (+2%) | 13mo | $175,000 | $167 | 52 |
| 721 Banks St | 0.50mi | 2/2.0 (-1) | 1,083 (+5%) | 8mo | $180,000 | $166 | 52 |
| 310 Wilson St | 0.44mi | 2/1.0 (-1) | 906 (-12%) | 8mo | $200,000 | $221 | 48 |
| 307 Oneida St | 0.45mi | 2/1.0 (-1) | 873 (-15%) | 3mo | $140,000 | $160 | 46 |
| 310 Meadowbrook Dr | 0.66mi | 3/2.0 | 1,163 (+13%) | 13mo | $210,000 | $181 | 32 |
Match score weights: distance 35% · size 25% · config 20% · recency 20%. Top-matched comps best support the ARV.
Projected returns pro-forma
-3.0% appreciation · 3.0% rent growth · sell at horizon
- IRR
- -4.9%
- Equity multiple
- 0.82×
- Total profit
- $-7,745
- Equity at exit
- $22,365
- IRR
- 4.7%
- Equity multiple
- 1.34×
- Total profit
- $14,370
- Equity at exit
- $12,969
Cash invested: $42,000 (down + closing). Projections, not guarantees.
Landlord ↔ Tenant lean methodology
- Overall (STATE)
- 85 Strongly Landlord-Friendly
- State North Carolina
- 85 Strongly Landlord-Friendly · R+3
- County
- — inherits STATE
- City
- — inherits STATE
ZIP-level market 27253
- Home prices YoY
- -34.2%
- Active inventory
- 395
- Price-to-rent
- 8.7×
Monthly cashflow live
- Estimated rent
- $1,442 high interval (Pro) →
- Mortgage (P&I)
- −$787
- Tax from tax record
- −$29 /mo · $345/yr
- Insurance
- −$62
- HOA
- −$0
- Vacancy / Maint / Mgmt
- −$303
- Net cashflow
- $261
Break-even live
Sensitivity live
| Price | -10% $346 | -5% $304 | +0% $261 | +5% $219 | +10% $176 |
|---|---|---|---|---|---|
| Rent | -10% $147 | -5% $204 | +0% $261 | +5% $318 | +10% $375 |
| Rate | -1.0pp $337 | -0.5pp $299 | base $261 | +0.5pp $222 | +1.0pp $183 |
UW: 25.0% down · 7.5% · 30yr · 1.5% tax · 5.0% vac · 8.0% maint · 8.0% mgmt
Financing live
Cash to close
- Down payment
- $37,500
- Closing costs
- $4,500
- Reserves months
- —
- Total cash needed
- —
Loan-product check · same deal, 3 products live
Conventional
25% down · 7.5% · 30yr
- Down + closing
- —
- Monthly P&I
- —
- Monthly cashflow
- —
- DSCR
- —
- Eligible?
- —
Personal DTI + credit; lowest rate.
DSCR
20% down · 8.5% · 30yr
- Down + closing
- —
- Monthly P&I
- —
- Monthly cashflow
- —
- DSCR
- —
- Eligible?
- —
No personal income docs; deal must DSCR.
Hard money
10% down · 12.0% · 12mo
- Down + closing
- —
- Monthly P&I
- —
- Monthly cashflow
- —
- DSCR
- —
- Eligible?
- —
Short-term bridge; refi at stabilization.
Rent comps 13 comps
| Address | Beds | Baths | Sqft | Rent | $/sqft | DOM | Units | Dist |
|---|---|---|---|---|---|---|---|---|
| 511 Poplar St Unit C Graham, NC | 2.0 | 1.0 | 900 | $1,195 | $1.33 | 22d | 1 | 0.22mi |
| 318 Wilson St Graham, NC | 3.0 | 2.0 | 1279 | $1,795 | $1.40 | 14d | 1 | 0.48mi |
| 317a Atwood Dr Burlington, NC | 2.0 | 1.5 | 980 | $1,282 | $1.31 | 22d | 8 | 0.52mi |
| 212 College St Apt G Graham, NC | 2.0 | 1.5 | 1050 | $1,125 | $1.07 | 22d | 1 | 0.53mi |
| 632 New St Graham, NC | 2.0 | 1.0 | 900 | $1,200 | $1.33 | 22d | 1 | 0.69mi |
| 433 Holt Ave Graham, NC | 2.0 | 2.0 | 1205 | $1,727 | $1.43 | 14d | 1 | 0.70mi |
| 317 E Gilbreath St Unit 319 Graham, NC | 2.0 | 1.0 | 800 | $1,295 | $1.62 | 22d | 1 | 1.05mi |
| 1352 Snow Ct Burlington, NC | 3.0 | 2.0 | 1250 | $1,625 | $1.30 | 14d | 1 | 1.24mi |
| 130 W Crescent Square Dr Graham, NC | 2.0 | 2.0 | 1159 | $1,364 | $1.18 | 22d | 6 | 1.27mi |
| 709 Maryland Ave Burlington, NC | 2.0 | 1.0 | 786 | $1,225 | $1.56 | 22d | 1 | 1.33mi |
| 219 Moyer Dr Graham, NC | 3.0 | 2.5 | 1500 | $1,825 | $1.22 | 14d | 1 | 1.38mi |
| 100 Ivey Rd Unit 104 Graham, NC | 2.0 | 1.5 | 1100 | $1,195 | $1.09 | 22d | 1 | 1.49mi |
| 721 E Morehead St Burlington, NC | 4.0 | 2.0 | 1470 | $1,550 | $1.05 | 14d | 1 | 1.50mi |
Listing history 5 events
-
2026-06-09status $150,000 Pending 5 DOM
-
2026-06-08days on market $150,000 Active 5 DOM
-
2026-06-07days on market $150,000 Active 4 DOM
-
2026-06-05remarks 543-char remark
-
2026-06-05$150,000 Active 1 DOM
ⓘ Source: listings_history table (triggers on properties + properties_extension) + one-shot
backfill from property_details.listing_events for pre-trigger history.
Tax reassessment forecast NC · Resets to sale price
- Current annual tax
- $345 · $29/mo
- Projected year-2 tax
- $1,230 · $102/mo
- Expected delta
- +$885/yr (+$74/mo · 256.5%)
ⓘ Screening estimate from a state-policy table — verify with the county assessor before closing.
Climate risk First Street
- Flood 1/10 Low FEMA zone X (unshaded) · 0% chance over 30 yrs
- Wildfire 1/10 Low
- Heat 6/10 Major 7 d/yr ≥105°F today · 17 d/yr by 30 yrs out
- Wind 5/10 Major 23% chance of damaging wind over 30 yrs
- Air quality 2/10 Low 2 unhealthy d/yr today · 2 by 30 yrs out
Nearby sold comps map
Loading sold comps map…
Walkable amenities ~0.75 mi
Loading nearby amenities…
Taxation est. · year 1
- Rental income
- $17,302
- − Mortgage interest
- −$8,402
- − Property taxes
- −$345
- − Insurance
- −$750
- − Repairs & maintenance
- −$1,384
- − Management
- −$1,384
- − Depreciation
- −$4,364
- Taxable income
- $673
- Est. tax owed @ 24.0%
- −$162
- After-tax cash flow
- $2,973/yr
For passive investors: Depreciation is non-cash, so a rental often shows a tax loss while cash-flowing — sheltering income. Rental losses are passive: they offset passive income freely, and up to $25,000/yr can offset ordinary (W-2) income if you actively participate and your MAGI is under $100k (phasing out to $0 by $150k); unused losses carry forward. On sale, claimed depreciation is recaptured at up to 25%, and gains may owe capital-gains tax (a 1031 exchange can defer both). Figures are a year-1 estimate at your 24.0% rate — not tax advice; consult a CPA.
Schools (NCES district)
- District
- Alamance-Burlington Schools
- NCES district ID
- 3700030
- Math proficiency
- 30% ▼ -6.00%
- Reading proficiency
- 40% ▲ 2.00%
- Median HH income
- $43,359
- Composite
- 29.68/100
- National rank
- #6460
- State rank
- #133 of 178 in NC
Livability — Graham
- Score
- 69/100
- State rank
- #144
- US rank
- #8181
Category grades
Schools grade is shown separately in the Schools card above.
Census & demographics
- Census place
- Graham, NC
- County
- Alamance County · 173,369 people
- City population
- 33,114
- Metro
- Burlington, NC
- Population (ZIP)
- 33,114
- Household income
- $62,774
- Rent vs Own
- Severe rent burden
- 879.0
Population outlook (Alamance County) Hauer SSP2
- Today (2025)
- 173,381 people
- By 2030
- 180,609 · +4.2%
- By 2040
- 194,327 · +12.1%
- By 2050
- 206,158 · +18.9%
- By 2075
- 235,665 · +35.9%
- By 2100
- 258,626 · +49.2%
Race, ethnicity, and origin ACS 2023
- Neighborhood character
- Diverse neighborhood (Simpson 0.56)
- Race & ethnicity
- White 62% Hispanic / Latino 17% Black 16% Two or more races 9%
- Hispanic origin (detail)
- Mexican 10%
- Common ancestry
- Slovak 3% Romanian 2% Italian 1%
- Foreign-born
- 10% · Canada, Jamaica, Dominican Republic
- Languages at home
- 84% English-only · Spanish 13%
Political lean MEDSL · Alamance
- 2024 margin
- Lean R (+8.2) · D 45.4% · R 53.5% · Other 1.1%
- 2008→2024 swing
- +1.1pp toward D · 2008: -9.2pp · 2024: -8.2pp
- All cycles
- 2024: R+8.2 2020: R+8.4 2016: R+12.9 2012: R+14.1 2008: R+9.2
Not yet ingested
- Civics
- —
Market trends
- HPI YoY
- ▼ -103.91%
- Current HPI
- 200.155
- Rent YoY
- —
- Metro
- Burlington, NC
- State GDP YoY
- ▲ 3.28%
- F500 in state
- 26
Industry mix (Fortune 500 HQ in NC)
| Industry | F500 HQs | Revenue |
|---|---|---|
| Financial Services | 2 | $213B |
|
||
| Retail | 2 | $95B |
|
||
| Industrial Conglomerate | 1 | $38B |
|
||
| Metals / Steel | 1 | $35B |
|
||
| Utilities | 1 | $30B |
|
||
| Industrial Machinery | 1 | $19B |
|
||
Price history
+0.0% since first listed2 events — show timeline
- 2026-06-03 Listed $150,000 Triad MLS
- 2026-06-03 Listed $150,000 TMLS
Property tax history
-1.6%/yrLatest (2025): $345 · +5.3% YoY. Source: county tax records.
Cash-flow waterfall
monthlySold comps — $/sqft
last 12 mo · ≤1 miLoading sold comps…