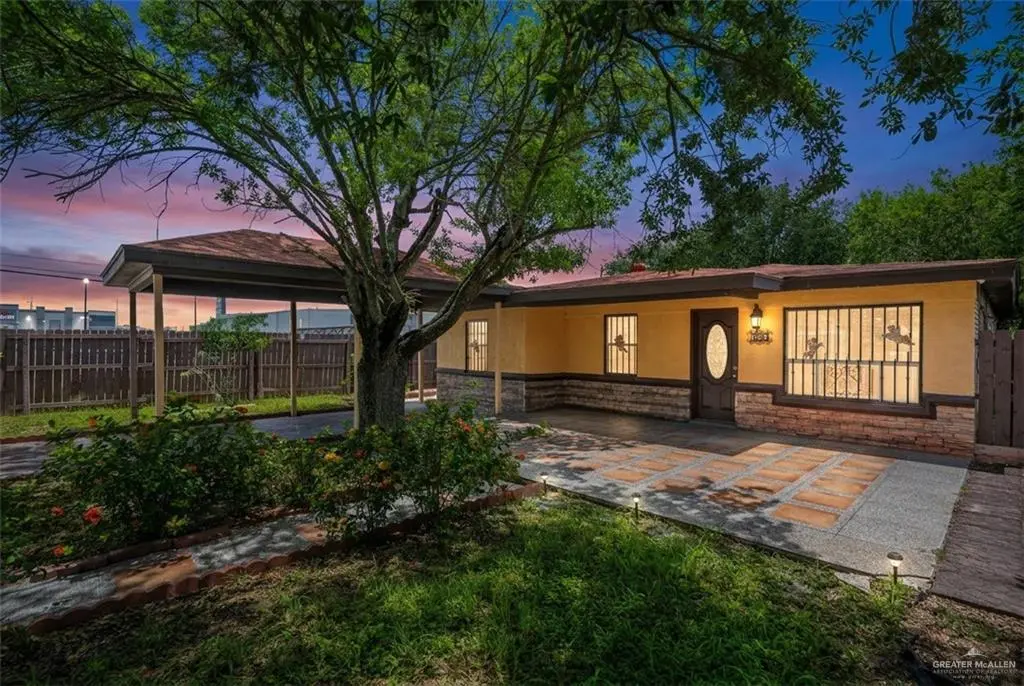
720 N Padre Ave · Weslaco, TX
Flood risk 4/10 · Minor
- FEMA flood zone
- X (shaded)
- Chance of flooding over 30 yrs
- 0.22%
- Est. flood insurance / yr
- $507 – $1,088
Fire risk 1/10 · Minimal
- Est. fire insurance / yr
- $1,222 – $2,270
Heat risk 9/10 · Severe
- Hot days now (above 111°F)
- 7 days/yr
- Hot days in 30 yrs
- 22 days/yr
Wind risk 8/10 · Major
- Chance of severe wind over 30 yrs
- 99.0%
Air-quality risk 1/10 · Minimal
- Unhealthy air days now
- 0 days/yr
- Unhealthy air days in 30 yrs
- 0 days/yr
Risk factors via First Street. Map © Google.
Why this score? — see what drove the D+ grade
The composite is a weighted blend of 9 inputs, each scored 0–100. Each bar is that input's sub-score; the figure is the points it added to the 100-point composite (weight × sub-score).
- ARV discount +15.0/15.0
- Cash flow +11.7/30.0
- Appreciation +4.7/10.0
- 1% rule +3.9/10.0
- Livability +3.6/5.0
- DSCR +3.4/10.0
- Rent growth +2.5/5.0
- Condition / age +2.5/5.0
- Schools +2.2/10.0
$135,000
🖨 Deal sheet (PDF) 📄 Offer letter ✓ Due diligence
Listing remarks MLS
HUD Case #495-671376. Square Footage information is from the FHA Appraisal and is deemed to be reliable but not guaranteed. All HUD homes are sold AS-IS. Seller will not allow any type of repairs prior to closing. Bid deadline is 07/3/11. $3,300 repair escrow if FHA insured financing.
Key facts
- Gas cooktop
- Decorative ceilings
- Prime location
Tags
Property features AI
Finance
- HOA & community: No HOA
Exterior
- Parking: 2 covered parking spaces; 2-car carport (no garage)
- Utilities: Public water; City sewer
- Home design: Not new construction
- Construction: Brick and stucco construction; Slab foundation; Composition shingle roof; Built prior to 2025
- Exterior features: Manual gate; Wood fencing; Mature trees; Paved road access
Interior
- Kitchen: Electric water heater; No conveying appliances
- Flooring: Tile
- Bathrooms: 1 full bathroom
- Interior features: Tile flooring; Laminate countertops; No window coverings
- Laundry & utility: Laundry room
Neighborhood map
What this means for you Summary
Snapshot
- This is a 3-bed/1.0-bath single-family listed at $135k.
Deal economics
- At list price, monthly cash flow is $-40 ($-479/yr) — negative.
- To cash-flow at today's rent, offer at most $128k (5.2% below list).
- To meet the 1% rule (rent ≥ 1% of price), the offer needs to be $120k (11.1% below list).
- Recommended offer: $120k (11.1% below list) — sets the bar for 1% rule.
- Cap rate 5.9% vs local median 4.1% in Weslaco — top-decile yield for the area; either an underpriced asset or a hidden risk that comps aren't pricing in. Stress-test before assuming the spread holds.
Location & tenants
- Location reads 72/100 on livability (#277 in TX) — a middle-class / working-renter tenant base. Strengths: cost of living A+, housing A+, health & safety A+; Watch: employment D+, crime F, amenities F.
- Weslaco ISD (suburban): math 23% / reading 31% proficiency, ranked #705 of 826 in TX (top 85%) — low school quality limits family demand, transient renter base, plan for 1-2y turnover.
- Zoned schools: Airport El (math 27% / reading 22%, grade F, #3,052 of 4,322 statewide, top 74%, 792 students, 86% FRL); Armando Cuellar Middle (math 22% / reading 31%, grade F, #1,200 of 1,662 statewide, top 73%, 626 students, 88% FRL); Weslaco H S (math 25% / reading 33%, grade F, #1,147 of 1,632 statewide, top 71%, 2,553 students, 73% FRL) — zoned schools average 82% FRL vs 59% district-wide (23 pts higher); higher-poverty schools than district average — tighter screening recommended.
- Market conditions: 711 active listings in the ZIP; 25 comparable units currently listed for rent nearby; rentals lingering (median 46d on market — plan ~5-8 weeks vacancy on turnover, expect pricing pressure); 96% of comp listings sitting > 30 days — soft ceiling on asking rent; 7,378 units permitted in Hidalgo County in 2024 (641 in 5+ unit buildings).
Forward outlook
- In year one you build about $144 of equity ($933 loan paydown + $-789 appreciation (-0.6% local appreciation)).
- Hidalgo County population projected at +28% by 2050 — long-run rental-demand tailwind backs the buy-and-hold thesis.
Negotiation context
- Only 4 days on market — expect competitive offers; lowballing is unlikely to land.
- 2 sale attempts since 15y ago with the ask held roughly flat each time — persistent listings suggest the price (not the market) is what's stuck; bring a comps-based counter.
Risks & watch-outs
- Climate carrying-cost: severe wind risk, 99% chance of damaging wind over 30y; extreme-heat days projected 7→22/yr by 2055 (HVAC capex compounding) — expect insurance premiums to compound above CPI over the hold.
Questions for the listing agent
- What do current leases actually rent for vs. the listed asking? Can we see a recent rent roll and the last 12 months of T-12 income?
- Is there a deadline driving the sale (1031 exchange, divorce, estate, relocation)? That informs how much negotiation room exists.
- Crime grade is F in this area — have there been break-ins, vandalism, or insurance claims at this property in the last 3 years? What carrier currently insures it and at what premium?
- The area grade is low — what's the realistic commute time and amenity access for the typical tenant pool here? Any planned neighborhood developments (good or bad) we should know about?
- What's the average days-on-market for RENTAL listings here right now (not sales)? A rising rental-DOM trend means longer vacancies and softer asking-rent achievability than the comps imply.
- What's the recent tenant-quality profile in this submarket — average credit score on applications, eviction rate, late-payment / NSF rate, and stable-employment percentage? A property-management company in the area should have these aggregated.
- How much new for-sale + rental construction is in the pipeline within 1–3 miles? Heavy new supply typically softens prices + rents 12–24 months out; constrained supply supports both.
Investment metrics
- 1% rule
- 0.89% ✗
- Cap rate
- 5.94%
- Cash-on-cash
- -1.27%
- DSCR
- 0.94
- GRM
- 9.4
CMA / ARV
- ARV (on-the-fly)
- $176,988
- Comps found
- 12
Show comp detail 12 sales within ~0.75 mi
| Address | Dist | Beds/Ba | Sqft | Sold | Price | $/sf | Match |
|---|---|---|---|---|---|---|---|
| — | 0.15mi | 3/1.0 | 1,280 (+6%) | 5mo | $179,900 | $141 | 78 |
| 621 N Nevada Ave | 0.13mi | 3/2.0 | 1,156 (-4%) | 10mo | $170,000 | $147 | 76 |
| 1903 E Llano Grande St | 0.48mi | 3/2.0 | 1,202 (-0%) | 10mo | $200,000 | $166 | 65 |
| 803 E Agostadero St | 0.39mi | 3/2.0 | 1,268 (+5%) | 11mo | $50,000 | $39 | 59 |
| 725 E Los Torritos St | 0.40mi | 3/1.0 | 1,080 (-10%) | 6mo | $166,000 | $154 | 59 |
| 1825 Largo St | 0.52mi | 3/2.0 | 1,130 (-6%) | 6mo | $179,900 | $159 | 56 |
| 231 Johann Ave | 0.66mi | 4/2.0 (+1) | 1,226 (+2%) | 5mo | $160,000 | $131 | 53 |
| 814 N Martinez Ave | 0.41mi | 3/2.0 | 1,074 (-11%) | 8mo | $159,900 | $149 | 53 |
| 1204 E 2nd St | 0.60mi | 4/1.5 (+1) | 1,152 (-4%) | 8mo | $120,000 | $104 | 52 |
| 835 N Martinez Ave | 0.42mi | 3/2.0 | 1,074 (-11%) | 10mo | $160,000 | $149 | 50 |
| 1308 E 2nd St | 0.58mi | 3/2.0 | 1,088 (-10%) | 7mo | $145,000 | $133 | 47 |
| 103 Grace Ave | 0.63mi | 2/1.0 (-1) | 1,068 (-11%) | 8mo | $60,000 | $56 | 40 |
Match score weights: distance 35% · size 25% · config 20% · recency 20%. Top-matched comps best support the ARV.
Projected returns pro-forma
-0.58% appreciation · 3.0% rent growth · sell at horizon
- IRR
- -6.0%
- Equity multiple
- 0.73×
- Total profit
- $-10,103
- Equity at exit
- $35,302
- IRR
- 0.5%
- Equity multiple
- 1.05×
- Total profit
- $1,820
- Equity at exit
- $39,438
Cash invested: $37,800 (down + closing). Projections, not guarantees.
Landlord ↔ Tenant lean methodology
- Overall (STATE)
- 87 Strongly Landlord-Friendly
- State Texas
- 87 Strongly Landlord-Friendly · R+5
- County
- — inherits STATE
- City
- — inherits STATE
ZIP-level market 78596
- Home prices YoY
- -0.2%
- Active inventory
- 711
- Price-to-rent
- 9.4×
Monthly cashflow live
- Estimated rent
- $1,200 high interval (Pro) →
- Mortgage (P&I)
- −$708
- Tax from tax record
- −$224 /mo · $2,686/yr
- Insurance
- −$56
- HOA
- −$0
- Vacancy / Maint / Mgmt
- −$252
- Net cashflow
- $-40
Break-even live
Sensitivity live
| Price | -10% $37 | -5% $-2 | +0% $-40 | +5% $-78 | +10% $-116 |
|---|---|---|---|---|---|
| Rent | -10% $-135 | -5% $-87 | +0% $-40 | +5% $7 | +10% $55 |
| Rate | -1.0pp $28 | -0.5pp $-6 | base $-40 | +0.5pp $-75 | +1.0pp $-110 |
UW: 25.0% down · 7.5% · 30yr · 1.5% tax · 5.0% vac · 8.0% maint · 8.0% mgmt
Financing live
Cash to close
- Down payment
- $33,750
- Closing costs
- $4,050
- Reserves months
- —
- Total cash needed
- —
Loan-product check · same deal, 3 products live
Conventional
25% down · 7.5% · 30yr
- Down + closing
- —
- Monthly P&I
- —
- Monthly cashflow
- —
- DSCR
- —
- Eligible?
- —
Personal DTI + credit; lowest rate.
DSCR
20% down · 8.5% · 30yr
- Down + closing
- —
- Monthly P&I
- —
- Monthly cashflow
- —
- DSCR
- —
- Eligible?
- —
No personal income docs; deal must DSCR.
Hard money
10% down · 12.0% · 12mo
- Down + closing
- —
- Monthly P&I
- —
- Monthly cashflow
- —
- DSCR
- —
- Eligible?
- —
Short-term bridge; refi at stabilization.
Rent comps 25 comps
| Address | Beds | Baths | Sqft | Rent | $/sqft | DOM | Units | Dist |
|---|---|---|---|---|---|---|---|---|
| 1601 S Airport Dr Unit 261 Weslaco, TX | 2.0 | 2.0 | 912 | $1,500 | $1.64 | 45d | 1 | 0.33mi |
| 1601 S Airport Dr Unit 283 Weslaco, TX | 3.0 | 2.0 | 1033 | $1,600 | $1.55 | 45d | 1 | 0.33mi |
| 622 E Llano Grande St Weslaco, TX | 3.0 | 2.0 | 1100 | $1,500 | $1.36 | 45d | 1 | 0.61mi |
| 309 E Mesquite St Weslaco, TX | 3.0 | 2.0 | 1100 | $1,400 | $1.27 | 45d | 1 | 0.66mi |
| 1723 Davenport St Unit 2 Weslaco, TX | 3.0 | 2.0 | 1140 | $1,175 | $1.03 | 45d | 1 | 0.71mi |
| 1804 Davenport St Unit 4 Weslaco, TX | 2.0 | 2.0 | 938 | $1,125 | $1.20 | 46d | 1 | 0.74mi |
| 1909 Davenport St Unit 3 Weslaco, TX | 3.0 | 2.0 | 1140 | $1,175 | $1.03 | 45d | 1 | 0.74mi |
| 1917 Davenport St Unit 1 Weslaco, TX | 2.0 | 2.0 | 938 | $1,100 | $1.17 | 45d | 1 | 0.76mi |
| 1805 Stauffers St Unit 3 Weslaco, TX | 3.0 | 2.0 | 1116 | $1,150 | $1.03 | 45d | 1 | 0.77mi |
| 1722 E Davenport St Unit 4 Weslaco, TX | 2.0 | 2.0 | 938 | $1,100 | $1.17 | 45d | 1 | 0.78mi |
| 1817 Stauffer St Weslaco, TX | 3.0 | 2.0 | 1116 | $1,200 | $1.08 | 45d | 1 | 0.78mi |
| 1804 Stauffers St #3 Weslaco, TX | 2.0 | 2.0 | 840 | $1,000 | $1.19 | 45d | 1 | 0.80mi |
| 1812 Redbud Ln Unit 1 Weslaco, TX | 2.0 | 2.0 | 874 | $1,025 | $1.17 | 45d | 1 | 0.87mi |
| 2108 Redbud Ln Unit 4 Weslaco, TX | 2.0 | 2.0 | 920 | $1,050 | $1.14 | 45d | 1 | 0.91mi |
| 3814 Bella Costa Dr Unit 3 Weslaco, TX | 2.0 | 2.0 | 987 | $1,025 | $1.04 | 45d | 1 | 0.92mi |
| 3707 Las Vistas Ln Apt 1 Weslaco, TX | 2.0 | 2.0 | 987 | $1,025 | $1.04 | 45d | 1 | 0.92mi |
| 1412 Vani Dr Unit 3 Weslaco, TX | 2.0 | 2.0 | 960 | $990 | $1.03 | 45d | 1 | 1.01mi |
| 1416 Vani Dr Unit 1 Weslaco, TX | 2.0 | 2.0 | 947 | $990 | $1.05 | 45d | 1 | 1.01mi |
| 1304 Petri Dr Weslaco, TX | 2.0 | 2.0 | 1067 | $1,050 | $0.98 | 45d | 1 | 1.05mi |
| 617 E Washington St Unit 4 Weslaco, TX | 3.0 | 2.0 | 1000 | $900 | $0.90 | 45d | 1 | 1.07mi |
| 607 E Washington St Weslaco, TX | 3.0 | 2.0 | 1000 | $900 | $0.90 | 45d | 1 | 1.08mi |
| 815 E Sugarcane Dr Unit E4 Weslaco, TX | 2.0 | 1.5 | 1124 | $1,200 | $1.07 | 45d | 1 | 1.10mi |
| 2808 Rosemary Dr Unit 3 Weslaco, TX | 3.0 | 2.0 | 1000 | $1,100 | $1.10 | 45d | 1 | 1.34mi |
| 2615 E Sugarcane Dr Weslaco, TX | 2.0–4.0 | 2.0–4.0 | 1108 | $972 | $0.88 | 23d | 8 | 1.37mi |
| 1306 E 11th St Unit 11 Weslaco, TX | 2.0 | 2.0 | 900 | $875 | $0.97 | 45d | 1 | 1.47mi |
Listing history 4 events
-
2026-06-21days on market $135,000 Active 4 DOM
-
2026-06-21days on market $135,000 Active 3 DOM
-
2026-06-17remarks 699-char remark
-
2026-06-17$135,000 Active 1 DOM
ⓘ Source: listings_history table (triggers on properties + properties_extension) + one-shot
backfill from property_details.listing_events for pre-trigger history.
Tax reassessment forecast TX · Resets to sale price
- Current annual tax
- $2,686 · $224/mo
- Projected year-2 tax
- $2,686 · $224/mo
- Expected delta
- $0/yr ($0/mo · 0.0%)
ⓘ Screening estimate from a state-policy table — verify with the county assessor before closing.
Climate risk First Street
- Flood 4/10 Moderate FEMA zone X (shaded) · 22% chance over 30 yrs
- Wildfire 1/10 Low
- Heat 9/10 Extreme 7 d/yr ≥111°F today · 22 d/yr by 30 yrs out
- Wind 8/10 Severe 99% chance of damaging wind over 30 yrs
- Air quality 1/10 Low 0 unhealthy d/yr today · 0 by 30 yrs out
Nearby sold comps map
Loading sold comps map…
Walkable amenities ~0.75 mi
Loading nearby amenities…
Taxation est. · year 1
- Rental income
- $14,403
- − Mortgage interest
- −$7,562
- − Property taxes
- −$2,686
- − Insurance
- −$675
- − Repairs & maintenance
- −$1,152
- − Management
- −$1,152
- − Depreciation
- −$3,927
- Taxable loss
- −$2,753
- Est. tax savings @ 24.0%
- +$661
- After-tax cash flow
- $182/yr
For passive investors: Depreciation is non-cash, so a rental often shows a tax loss while cash-flowing — sheltering income. Rental losses are passive: they offset passive income freely, and up to $25,000/yr can offset ordinary (W-2) income if you actively participate and your MAGI is under $100k (phasing out to $0 by $150k); unused losses carry forward. On sale, claimed depreciation is recaptured at up to 25%, and gains may owe capital-gains tax (a 1031 exchange can defer both). Figures are a year-1 estimate at your 24.0% rate — not tax advice; consult a CPA.
Schools (NCES district)
- District
- Weslaco ISD
- NCES district ID
- 4844960
- Math proficiency
- 23% ▼ -29.00%
- Reading proficiency
- 31% ▼ -9.00%
- Median HH income
- $32,867
- Composite
- 22.05/100
- National rank
- #8196
- State rank
- #705 of 826 in TX
Livability — Weslaco
- Score
- 72/100
- State rank
- #277
- US rank
- #6469
Category grades
Schools grade is shown separately in the Schools card above.
Census & demographics
- Census place
- Weslaco, TX
- Population (ZIP)
- 38,942
Population outlook (Hidalgo County) Hauer SSP2
- Today (2025)
- 955,232 people
- By 2030
- 1,009,774 · +5.7%
- By 2040
- 1,120,332 · +17.3%
- By 2050
- 1,225,036 · +28.2%
- By 2075
- 1,439,189 · +50.7%
- By 2100
- 1,533,429 · +60.5%
Race, ethnicity, and origin ACS 2023
- Neighborhood character
- Predominantly Hispanic (86%)
- Race & ethnicity
- Hispanic / Latino 86% Two or more races 38% White 13%
- Hispanic origin (detail)
- Mexican 82%
- Common ancestry
- Slovak 1%
- Foreign-born
- 17% · Canada
- Languages at home
- 27% English-only · Spanish 72%
Political lean MEDSL · Hidalgo
- 2024 margin
- Toss-up / Even · D 48.1% · R 51.0%
- 2008→2024 swing
- -41.6pp toward R · 2008: 38.7pp · 2024: -2.9pp
- All cycles
- 2024: R+2.9 2020: D+17.1 2016: D+40.5 2012: D+41.8 2008: D+38.7
Not yet ingested
- Civics
- —
Market trends
- HPI YoY
- ▼ -0.58%
- Current HPI
- 261.5117
- Rent YoY
- —
- Metro
- —
- State GDP YoY
- ▲ 3.95%
- F500 in state
- 110
Industry mix (Fortune 500 HQ in TX)
| Industry | F500 HQs | Revenue |
|---|---|---|
| Energy | 16 | $1,198B |
|
||
| Technology | 5 | $198B |
|
||
| Engineering / Construction | 4 | $72B |
|
||
| Energy Services | 3 | $60B |
|
||
| Utilities | 3 | $41B |
|
||
| Healthcare | 2 | $330B |
|
||
Price history
+303.0% since first listed5 events — show timeline
- 2026-06-17 Listed $135,000 MCALLENMLS
- 2011-08-16 Sold (MLS) — MCALLENMLS
- 2011-07-07 Delisted — MCALLENMLS
- 2011-06-24 Listed $33,500 MCALLENMLS
- 2003-09-17 Sold (Public Records) — Public Records
Property tax history
+8.1%/yrLatest (2025): $2,686 · +19.8% YoY. Source: county tax records.
Cash-flow waterfall
monthlySold comps — $/sqft
last 12 mo · ≤1 miLoading sold comps…