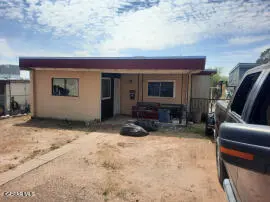
2510 Federal Ave · El Paso, TX
Flood risk 1/10 · Minimal
- FEMA flood zone
- X
- Chance of flooding over 30 yrs
- 0.0%
- Est. flood insurance / yr
- $507 – $1,088
Fire risk 3/10 · Minor
- Est. fire insurance / yr
- $1,222 – $2,270
Heat risk 6/10 · Moderate
- Hot days now (above 101°F)
- 7 days/yr
- Hot days in 30 yrs
- 27 days/yr
Wind risk 1/10 · Minimal
- Chance of severe wind over 30 yrs
- —
Air-quality risk 2/10 · Minimal
- Unhealthy air days now
- 1 days/yr
- Unhealthy air days in 30 yrs
- 1 days/yr
Risk factors via First Street. Map © Google.
Why this score? — see what drove the C- grade
The composite is a weighted blend of 9 inputs, each scored 0–100. Each bar is that input's sub-score; the figure is the points it added to the 100-point composite (weight × sub-score).
- Cash flow +18.2/30.0
- ARV discount +7.5/15.0
- 1% rule +6.8/10.0
- DSCR +5.7/10.0
- Rent growth +4.0/5.0
- Livability +4.0/5.0
- Schools +2.7/10.0
- Condition / age +2.5/5.0
- Appreciation +0.0/10.0
$90,000
🖨 Deal sheet 📄 Offer letter ✓ Due diligence
Listing remarks MLS
CASH ONLY !!!! AS IS !!!!! NO HARD MONEY LOANS!!!! FIXER UPPER. VACANT ON LOCKBOX. 2 BEDROOM 1 BATH WITH KITCHEN AREA AND OPEN LIVING AREA. LARGE BACKYARD WITH A STORAGE BUILDING. CASH ONLY !!!! AS IS. NO HARD MONEY LOANS !!! ROLLED ROOF APPROX 4 YEARS OLD. NO WASHER OR DRYER CONNECTION. NO KITCHEN CABINETS OR SINK . SHED IN THE BACKYARD. BACKYARD ACCESS. CLOSE TO ALABAMA AND FEDERAL AVE.. NO HOMESTEAD FILED. CASH ONLY !!!!! AS IS !!!!! NO HARD MONEY LOANS.
Key facts
- Rolled roof
- Shed
- Backyard access
Tags
Neighborhood map
What this means for you Summary
Snapshot
- This is a 2-bed/1.0-bath single-family listed at $90k.
Deal economics
- At list price, monthly cash flow is $81 ($978/yr) — positive.
- The deal already cash-flows at list — no discount required.
- Meets the 1% rule at list price ($1k rent vs $90k).
- Recommended offer: $79k (12.0% below list) — sets the bar for market timing.
Location & tenants
- Location reads 81/100 on livability (#23 in TX, #1,375 nationally) — a professional / high-income tenant draw. Strengths: commute A+, cost of living A+, housing A+; Watch: employment D+.
- El Paso ISD (urban): math 27% / reading 37% proficiency, ranked #591 of 826 in TX (top 72%) — families likely to look elsewhere, expect single-tenant / working-renter base with shorter leases; 65% free/reduced lunch — lower-income household profile, screen leases tightly.
- Market conditions: Rents rising fast (+5.8%/yr); 75 active listings in the ZIP; 37 comparable units currently listed for rent nearby; rentals at typical pace (median 24d on market — plan ~3-4 weeks tenant-placement turnaround); 43% of comp listings sitting > 30 days — soft ceiling on asking rent; lower-income renter base — watch delinquency; 2,196 units permitted in El Paso County in 2024 (143 in 5+ unit buildings).
- This rent runs 30% of the median local income ($42k/yr) — at the standard rent-burdened threshold; future hikes will face affordability resistance.
Forward outlook
- Local home prices are declining (-3.0%/yr); year-one equity from $622 of loan paydown is wiped out by about $3k of value loss. Plan a longer hold.
- El Paso County population projected at +10% by 2050 — modest demand growth; plan on rents tracking national, not racing it.
Negotiation context
- It's been on market 139 days — a 12% lower offer ($79k) is reasonable based on typical stale-listing flexibility.
- 3 sale attempts; this cycle's ask has dropped $35k (28%) from the opening price — seller is motivated, your offer sets the floor, not the list.
Risks & watch-outs
- Watch-outs: property tax is 3.3% of price; built in 1949 — expect roof / HVAC / electrical / plumbing capex.
- Climate carrying-cost: extreme-heat days projected 7→27/yr by 2055 (HVAC capex compounding) — expect insurance premiums to compound above CPI over the hold.
Questions for the listing agent
- It's been on market 139 days. Have you received any prior offers? Is the seller open to a 12% concession, seller financing, or rate buy-down credit?
- Built in 1949 — when were the roof, HVAC, electrical panel, plumbing, and water heater last replaced?
- Property tax is high relative to price — has the assessment been appealed recently, and will the sale trigger a re-assessment?
- Why hasn't it sold? Are there any deal-killer items the seller is aware of (foundation, flood, title, zoning, code violations)?
- Is there a deadline driving the sale (1031 exchange, divorce, estate, relocation)? That informs how much negotiation room exists.
- Schools are B-rated — typically a magnet for longer-tenancy family renters. What's the average tenant stay here, and is there a school-zone premium baked into asking?
- What's the average days-on-market for RENTAL listings here right now (not sales)? A rising rental-DOM trend means longer vacancies and softer asking-rent achievability than the comps imply.
- What's the recent tenant-quality profile in this submarket — average credit score on applications, eviction rate, late-payment / NSF rate, and stable-employment percentage? A property-management company in the area should have these aggregated.
- How much new for-sale + rental construction is in the pipeline within 1–3 miles? Heavy new supply typically softens prices + rents 12–24 months out; constrained supply supports both.
Investment metrics
- 1% rule
- 1.18% ✓
- Cap rate
- 7.38%
- Cash-on-cash
- 3.88%
- DSCR
- 1.17
- GRM
- 7.1
CMA / ARV
No comps found within radius.
Projected returns pro-forma
-3.0% appreciation · 5.85% rent growth · sell at horizon
- IRR
- -6.4%
- Equity multiple
- 0.76×
- Total profit
- $-6,158
- Equity at exit
- $13,419
- IRR
- 7.0%
- Equity multiple
- 1.61×
- Total profit
- $15,370
- Equity at exit
- $7,782
Cash invested: $25,200 (down + closing). Projections, not guarantees.
Landlord ↔ Tenant lean methodology
- Overall (STATE)
- 87 Strongly Landlord-Friendly
- State Texas
- 87 Strongly Landlord-Friendly · R+5
- County
- — inherits STATE
- City
- — inherits STATE
ZIP-level market 79930
- Home prices YoY
- -22.2%
- Rents YoY
- 5.8%
- Active inventory
- 75
- Price-to-rent
- 7.1×
Monthly cashflow live
- Estimated rent
- $1,063 high interval (Pro) →
- Mortgage (P&I)
- −$472
- Tax from tax record
- −$249 /mo · $2,988/yr
- Insurance
- −$38
- HOA
- −$0
- Vacancy / Maint / Mgmt
- −$223
- Net cashflow
- $81
Break-even live
UW: 25.0% down · 7.5% · 30yr · 1.5% tax · 5.0% vac · 8.0% maint · 8.0% mgmt
Financing live
Cash to close
- Down payment
- $22,500
- Closing costs
- $2,700
- Reserves months
- —
- Total cash needed
- —
Loan-product check · same deal, 3 products live
Conventional
25% down · 7.5% · 30yr
- Down + closing
- —
- Monthly P&I
- —
- Monthly cashflow
- —
- DSCR
- —
- Eligible?
- —
Personal DTI + credit; lowest rate.
DSCR
20% down · 8.5% · 30yr
- Down + closing
- —
- Monthly P&I
- —
- Monthly cashflow
- —
- DSCR
- —
- Eligible?
- —
No personal income docs; deal must DSCR.
Hard money
10% down · 12.0% · 12mo
- Down + closing
- —
- Monthly P&I
- —
- Monthly cashflow
- —
- DSCR
- —
- Eligible?
- —
Short-term bridge; refi at stabilization.
Rent comps 37 comps
| Address | Beds | Baths | Sqft | Rent | $/sqft | DOM | Units | Dist |
|---|---|---|---|---|---|---|---|---|
| 2318 Federal Ave Unit B El Paso, TX | 1.0 | 1.0 | 700 | $750 | $1.07 | 11d | 1 | 0.16mi |
| 2406 Lebanon Ave El Paso, TX | 1.0 | 1.0 | 1015 | $1,500 | $1.48 | 21d | 1 | 0.21mi |
| 2801 Wheeling Ave Unit C El Paso, TX | 1.0 | 1.0 | 695 | $950 | $1.37 | 23d | 1 | 0.27mi |
| 2525 Altura Ave Unit C El Paso, TX | 1.0 | 1.0 | 625 | $800 | $1.28 | 14d | 1 | 0.42mi |
| 2807 Grant Ave Unit A El Paso, TX | 2.0 | 1.0 | 1040 | $1,150 | $1.11 | 43d | 1 | 0.45mi |
| 2413 Tremont Ave El Paso, TX | 2.0 | 1.0 | 980 | $999 | $1.02 | 43d | 1 | 0.47mi |
| 2413 Tremont Ave Unit b3 El Paso, TX | 2.0 | 1.0 | 980 | $999 | $1.02 | 23d | 1 | 0.47mi |
| 2723 Grant Ave El Paso, TX | 3.0 | 1.0 | 980 | $2,550 | $2.60 | 43d | 1 | 0.47mi |
| 2111 Portland Ave #2 El Paso, TX | 1.0 | 1.0 | 725 | $745 | $1.03 | 14d | 1 | 0.48mi |
| 2201 Tremont Ave Unit B El Paso, TX | 2.0 | 1.0 | 800 | $795 | $0.99 | 14d | 1 | 0.53mi |
| 2919 Frankfort Ave El Paso, TX | 2.0 | 1.0 | 850 | $980 | $1.15 | 44d | 1 | 0.66mi |
| 2315 Montana Ave Unit 3 El Paso, TX | 1.0 | 1.0 | 716 | $900 | $1.26 | 23d | 1 | 0.83mi |
| 3403 Pershing Dr #3 El Paso, TX | 2.0 | 1.0 | 850 | $995 | $1.17 | 23d | 1 | 0.83mi |
| 3505 Douglas Ave El Paso, TX | 2.0 | 1.0 | 1025 | $925 | $0.90 | 43d | 1 | 0.85mi |
| 1831 Murchison Dr El Paso, TX | 1.0 | 1.0 | 471 | $1,468 | $3.12 | 11d | 10 | 0.87mi |
| 2618 Idalia Ave Unit A El Paso, TX | 1.0 | 1.0 | 700 | $890 | $1.27 | 43d | 1 | 0.88mi |
| 3025 E Missouri Ave El Paso, TX | 2.0 | 1.0 | 1008 | $1,395 | $1.38 | 43d | 1 | 0.90mi |
| 2635 Idalia Ave Unit A El Paso, TX | 3.0 | 2.0 | 972 | $1,250 | $1.29 | 3d | 1 | 0.92mi |
| 2717 Idalia Ave Unit B El Paso, TX | 2.0 | 1.0 | 975 | $900 | $0.92 | 23d | 1 | 0.94mi |
| 2717 Idalia Ave El Paso, TX | 2.0 | 1.0 | 975 | $900 | $0.92 | 43d | 1 | 0.94mi |
| 3814 Hueco Ave El Paso, TX | 2.0 | 1.0 | 897 | $1,245 | $1.39 | 43d | 1 | 1.19mi |
| 3120 Morehead Ave El Paso, TX | 2.0 | 1.0 | 1020 | $1,400 | $1.37 | 43d | 1 | 1.22mi |
| 3119 Frutas Ave Apt 6 El Paso, TX | 2.0 | 1.0 | 600 | $700 | $1.17 | 43d | 1 | 1.24mi |
| 3828 Altura Ave Unit B El Paso, TX | 1.0 | 1.0 | 820 | $995 | $1.21 | 23d | 1 | 1.24mi |
| 806 N Williams St El Paso, TX | 2.0 | 1.0 | 750 | $1,200 | $1.60 | 14d | 1 | 1.25mi |
| 3921 Cambridge Ave Unit A El Paso, TX | 1.0 | 1.0 | 728 | $995 | $1.37 | 19d | 1 | 1.25mi |
| 3921 Cambridge Ave Unit B El Paso, TX | 2.0 | 2.0 | 1018 | $1,295 | $1.27 | 19d | 1 | 1.25mi |
| 3121 Frutas Ave Unit 04 El Paso, TX | 2.0 | 1.0 | 540 | $700 | $1.30 | 23d | 1 | 1.26mi |
| 3900 La Luz Ave Unit D El Paso, TX | 1.0 | 1.0 | 561 | $1,000 | $1.78 | 14d | 1 | 1.29mi |
| 4012 Trowbridge Dr Unit A El Paso, TX | 2.0 | 1.0 | 1064 | $1,450 | $1.36 | 23d | 1 | 1.34mi |
| 3906 Tularosa Ave El Paso, TX | 2.0 | 1.0 | 1013 | $1,050 | $1.04 | 43d | 1 | 1.36mi |
| 3309 Nations Ave El Paso, TX | 2.0 | 1.0 | 875 | $1,100 | $1.26 | 3d | 1 | 1.38mi |
| 3030 Pera Ave Unit A El Paso, TX | 2.0 | 1.5 | 1050 | $1,350 | $1.29 | 43d | 1 | 1.39mi |
| 4116 Chester Ave El Paso, TX | 3.0 | 1.0 | 1076 | $1,600 | $1.49 | 43d | 1 | 1.43mi |
| 1509 Montana Ave El Paso, TX | 2.0 | 1.0 | 900 | $1,150 | $1.28 | 43d | 1 | 1.44mi |
| 3526 Nations Ave Unit 1/2 El Paso, TX | 1.0 | 1.0 | 600 | $695 | $1.16 | 43d | 1 | 1.47mi |
| 4011 Alabama St El Paso, TX | 1.0–4.0 | 1.0–4.0 | 1010 | $1,667 | $1.65 | 3d | 16 | 1.49mi |
Listing history 20 events
-
2026-06-16status $90,000 Pending 139 DOM
-
2026-06-15days on market $90,000 Active 139 DOM
-
2026-06-13days on market $90,000 Active 137 DOM
-
2026-06-13days on market $90,000 Active 136 DOM
-
2026-06-10days on market $90,000 Active 134 DOM
-
2026-06-09days on market $90,000 Active 133 DOM
-
2026-06-08days on market $90,000 Active 132 DOM
-
2026-06-07remarks 531-char remark
-
2026-06-07pricedays on market $90,000 Active 131 DOM
-
2026-06-05days on market $105,000 Active 128 DOM
-
2026-06-03days on market $105,000 Active 127 DOM
-
2026-06-03days on market $105,000 Active 126 DOM
-
2026-06-01days on market $105,000 Active 125 DOM
-
2026-05-31days on market $105,000 Active 124 DOM
-
2026-04-16status Active 472-char remark
Show marketing remark (472 chars)
CASH ONLY !!!! AS IS !!!!! NO HARD MONEY LOANS!!!! FIXER UPPER. VACANT ON LOCKBOX. 2 BEDROOM 1 BATH WITH KITCHEN AREA AND OPEN LIVING AREA. LARGE BACKYARD WITH A STORAGE BUILDING. CASH ONLY !!!! AS IS. NO HARD MONEY LOANS !!! ROLLED ROOF APPROX 4 YEARS OLD. NO WASHER OR DRYER CONNECTION. NO KITCHEN CABINETS OR SINK . SHED IN THE BACKYARD. BACKYARD ACCESS. CLOSE TO ALABAMA AND FEDERAL AVE.. NO HOMESTEAD FILED. CASH ONLY !!!!! AS IS !!!!! NO HARD MONEY LOANS.
-
2026-02-03historical 472-char remark
Show marketing remark (472 chars)
CASH ONLY !!!! AS IS !!!!! NO HARD MONEY LOANS!!!! FIXER UPPER. VACANT ON LOCKBOX. 2 BEDROOM 1 BATH WITH KITCHEN AREA AND OPEN LIVING AREA. LARGE BACKYARD WITH A STORAGE BUILDING. CASH ONLY !!!! AS IS. NO HARD MONEY LOANS !!! ROLLED ROOF APPROX 4 YEARS OLD. NO WASHER OR DRYER CONNECTION. NO KITCHEN CABINETS OR SINK . SHED IN THE BACKYARD. BACKYARD ACCESS. CLOSE TO ALABAMA AND FEDERAL AVE.. NO HOMESTEAD FILED. CASH ONLY !!!!! AS IS !!!!! NO HARD MONEY LOANS.
-
2025-12-16price $105,000 472-char remark
Show marketing remark (472 chars)
CASH ONLY !!!! AS IS !!!!! NO HARD MONEY LOANS!!!! FIXER UPPER. VACANT ON LOCKBOX. 2 BEDROOM 1 BATH WITH KITCHEN AREA AND OPEN LIVING AREA. LARGE BACKYARD WITH A STORAGE BUILDING. CASH ONLY !!!! AS IS. NO HARD MONEY LOANS !!! ROLLED ROOF APPROX 4 YEARS OLD. NO WASHER OR DRYER CONNECTION. NO KITCHEN CABINETS OR SINK . SHED IN THE BACKYARD. BACKYARD ACCESS. CLOSE TO ALABAMA AND FEDERAL AVE.. NO HOMESTEAD FILED. CASH ONLY !!!!! AS IS !!!!! NO HARD MONEY LOANS.
-
2025-11-18status Active 472-char remark
Show marketing remark (472 chars)
CASH ONLY !!!! AS IS !!!!! NO HARD MONEY LOANS!!!! FIXER UPPER. VACANT ON LOCKBOX. 2 BEDROOM 1 BATH WITH KITCHEN AREA AND OPEN LIVING AREA. LARGE BACKYARD WITH A STORAGE BUILDING. CASH ONLY !!!! AS IS. NO HARD MONEY LOANS !!! ROLLED ROOF APPROX 4 YEARS OLD. NO WASHER OR DRYER CONNECTION. NO KITCHEN CABINETS OR SINK . SHED IN THE BACKYARD. BACKYARD ACCESS. CLOSE TO ALABAMA AND FEDERAL AVE.. NO HOMESTEAD FILED. CASH ONLY !!!!! AS IS !!!!! NO HARD MONEY LOANS.
-
2025-08-28historical 472-char remark
Show marketing remark (472 chars)
CASH ONLY !!!! AS IS !!!!! NO HARD MONEY LOANS!!!! FIXER UPPER. VACANT ON LOCKBOX. 2 BEDROOM 1 BATH WITH KITCHEN AREA AND OPEN LIVING AREA. LARGE BACKYARD WITH A STORAGE BUILDING. CASH ONLY !!!! AS IS. NO HARD MONEY LOANS !!! ROLLED ROOF APPROX 4 YEARS OLD. NO WASHER OR DRYER CONNECTION. NO KITCHEN CABINETS OR SINK . SHED IN THE BACKYARD. BACKYARD ACCESS. CLOSE TO ALABAMA AND FEDERAL AVE.. NO HOMESTEAD FILED. CASH ONLY !!!!! AS IS !!!!! NO HARD MONEY LOANS.
-
2025-08-26$125,000 Active 472-char remark
Show marketing remark (472 chars)
CASH ONLY !!!! AS IS !!!!! NO HARD MONEY LOANS!!!! FIXER UPPER. VACANT ON LOCKBOX. 2 BEDROOM 1 BATH WITH KITCHEN AREA AND OPEN LIVING AREA. LARGE BACKYARD WITH A STORAGE BUILDING. CASH ONLY !!!! AS IS. NO HARD MONEY LOANS !!! ROLLED ROOF APPROX 4 YEARS OLD. NO WASHER OR DRYER CONNECTION. NO KITCHEN CABINETS OR SINK . SHED IN THE BACKYARD. BACKYARD ACCESS. CLOSE TO ALABAMA AND FEDERAL AVE.. NO HOMESTEAD FILED. CASH ONLY !!!!! AS IS !!!!! NO HARD MONEY LOANS.
ⓘ Source: listings_history table (triggers on properties + properties_extension) + one-shot
backfill from property_details.listing_events for pre-trigger history.
Tax reassessment forecast TX · Resets to sale price
- Current annual tax
- $2,988 · $249/mo
- Projected year-2 tax
- $2,988 · $249/mo
- Expected delta
- $0/yr ($0/mo · -0.0%)
ⓘ Screening estimate from a state-policy table — verify with the county assessor before closing.
Climate risk First Street
- Flood 1/10 Low FEMA zone X · 0% chance over 30 yrs
- Wildfire 3/10 Moderate
- Heat 6/10 Major 7 d/yr ≥101°F today · 27 d/yr by 30 yrs out
- Wind 1/10 Low
- Air quality 2/10 Low 1 unhealthy d/yr today · 1 by 30 yrs out
Nearby sold comps map
Loading sold comps map…
Walkable amenities ~0.75 mi
Loading nearby amenities…
Taxation est. · year 1
- Rental income
- $12,759
- − Mortgage interest
- −$5,041
- − Property taxes
- −$2,988
- − Insurance
- −$450
- − Repairs & maintenance
- −$1,021
- − Management
- −$1,021
- − Depreciation
- −$2,618
- Taxable loss
- −$380
- Est. tax savings @ 24.0%
- +$91
- After-tax cash flow
- $1,069/yr
For passive investors: Depreciation is non-cash, so a rental often shows a tax loss while cash-flowing — sheltering income. Rental losses are passive: they offset passive income freely, and up to $25,000/yr can offset ordinary (W-2) income if you actively participate and your MAGI is under $100k (phasing out to $0 by $150k); unused losses carry forward. On sale, claimed depreciation is recaptured at up to 25%, and gains may owe capital-gains tax (a 1031 exchange can defer both). Figures are a year-1 estimate at your 24.0% rate — not tax advice; consult a CPA.
Schools (NCES district)
- District
- El Paso ISD
- NCES district ID
- 4818300
- Math proficiency
- 27% ▼ -24.00%
- Reading proficiency
- 37% ▼ -7.00%
- Median HH income
- $38,704
- Composite
- 26.75/100
- National rank
- #7138
- State rank
- #591 of 826 in TX
Livability — El Paso
- Score
- 81/100
- State rank
- #23
- US rank
- #1375
Category grades
Schools grade is shown separately in the Schools card above.
Census & demographics
- Census place
- El Paso, TX
- County
- El Paso County · 761,266 people
- City population
- 630,223
- Metro
- El Paso, TX
- Population (ZIP)
- 24,123
- Household income
- $42,099
- Rent vs Own
- Severe rent burden
- 1384.0
Population outlook (El Paso County) Hauer SSP2
- Today (2025)
- 897,899 people
- By 2030
- 922,694 · +2.8%
- By 2040
- 960,492 · +7.0%
- By 2050
- 982,919 · +9.5%
- By 2075
- 997,266 · +11.1%
- By 2100
- 900,630 · +0.3%
Race, ethnicity, and origin ACS 2023
- Neighborhood character
- Predominantly Hispanic (89%)
- Race & ethnicity
- Hispanic / Latino 89% Two or more races 44% White 8% Black 2%
- Hispanic origin (detail)
- Mexican 84% Puerto Rican 2%
- Common ancestry
- Lithuanian 1%
- Foreign-born
- 25% · Canada
- Languages at home
- 24% English-only · Spanish 75%
Political lean MEDSL · El Paso
- 2024 margin
- D (+15.1) · D 57.0% · R 41.8% · Other 1.2%
- 2008→2024 swing
- -17.4pp toward R · 2008: 32.5pp · 2024: 15.1pp
- All cycles
- 2024: D+15.1 2020: D+35.1 2016: D+43.2 2012: D+32.6 2008: D+32.5
Not yet ingested
- Civics
- —
Market trends
- HPI YoY
- ▼ -72.03%
- Current HPI
- 252.9883
- Rent YoY
- ▲ 5.85%
- Metro
- El Paso, TX
- State GDP YoY
- ▲ 3.95%
- F500 in state
- 110
Industry mix (Fortune 500 HQ in TX)
| Industry | F500 HQs | Revenue |
|---|---|---|
| Energy | 16 | $1,198B |
|
||
| Technology | 5 | $198B |
|
||
| Engineering / Construction | 4 | $72B |
|
||
| Energy Services | 3 | $60B |
|
||
| Utilities | 3 | $41B |
|
||
| Healthcare | 2 | $330B |
|
||
Price history
-16.0% since first listed6 events — show timeline
- 2026-04-16 Relisted — GEPARMLS
- 2026-02-03 Listing Removed — GEPARMLS
- 2025-12-16 Price Changed $105,000 GEPARMLS
- 2025-11-18 Relisted — GEPARMLS
- 2025-08-28 Listing Removed — GEPARMLS
- 2025-08-26 Listed $125,000 GEPARMLS
Property tax history
+4.4%/yrLatest (2025): $2,988 · +16.2% YoY. Source: county tax records.
Cash-flow waterfall
monthlySold comps — $/sqft
last 12 mo · ≤1 miLoading sold comps…