111 S Mcdonald St · Ranson, WV
Flood risk 8/10 · Major
- FEMA flood zone
- AE
- Chance of flooding over 30 yrs
- 0.99%
- Est. flood insurance / yr
- $1,737 – $8,500
Fire risk 3/10 · Minor
- Est. fire insurance / yr
- $787 – $1,461
Heat risk 5/10 · Moderate
- Hot days now (above 102°F)
- 7 days/yr
- Hot days in 30 yrs
- 16 days/yr
Wind risk 2/10 · Minimal
- Chance of severe wind over 30 yrs
- 3.0%
Air-quality risk 2/10 · Minimal
- Unhealthy air days now
- 1 days/yr
- Unhealthy air days in 30 yrs
- 1 days/yr
Risk factors via First Street. Map © Google.
Why this score? — see what drove the C+ grade
The composite is a weighted blend of 9 inputs, each scored 0–100. Each bar is that input's sub-score; the figure is the points it added to the 100-point composite (weight × sub-score).
- Cash flow +16.5/30.0
- ARV discount +15.0/15.0
- Appreciation +10.0/10.0
- DSCR +5.1/10.0
- 1% rule +3.6/10.0
- Schools +3.4/10.0
- Livability +3.3/5.0
- Rent growth +2.5/5.0
- Condition / age +2.5/5.0
$200,000
🖨 Deal sheet 📄 Offer letter ✓ Due diligence
Listing remarks MLS
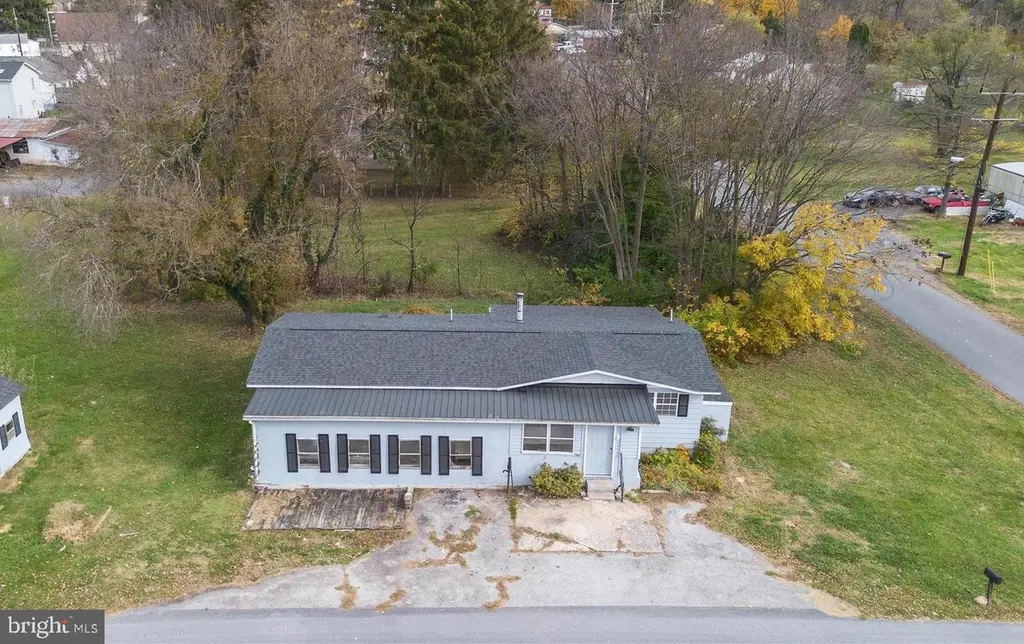
This 3-bedroom, 1.5-bath ranch-style home sits on a spacious corner lot spanning two city parcels—offering plenty of room to grow! A fantastic opportunity for investors or DIY enthusiasts, this fixer-upper features additions on both the front and back of the home, providing extra space. The back addition is where laundry is located. Enjoy privacy in the nice sized backyard, with a storage shed for all your tools and equipment. A newer roof (less than 3 years old). Located in the heart of Ranson, close to local amenities and commuter routes, this property is full of potential. Don't miss your chance to make it your own!
Key facts
- 8,520 sq ft lot
- 3 parking spots
- Built 1975
Property features AI
Neighborhood map
What this means for you Summary
Snapshot
- This is a 2-bed/1.5-bath single-family listed at $200k.
Deal economics
- At list price, monthly cash flow is $-308 ($-4k/yr) — negative.
- To cash-flow at today's rent, offer at most $146k (27.2% below list).
- To meet the 1% rule (rent ≥ 1% of price), the offer needs to be $172k (14.0% below list).
- Recommended offer: $146k (27.2% below list) — sets the bar for cash-flow.
- Cap rate 7.0% vs local median 3.8% in Ranson — top-decile yield for the area; either an underpriced asset or a hidden risk that comps aren't pricing in. Stress-test before assuming the spread holds.
Location & tenants
- Location reads 66/100 on livability (#100 in WV) — a middle-class / working-renter tenant base. Strengths: crime A+, housing A+, cost of living A-; Watch: schools F, amenities F, commute F.
- Jefferson County Schools (rural): math 29% / reading 46% proficiency, ranked #6 of 55 in WV (top 11%) — families likely to look elsewhere, expect single-tenant / working-renter base with shorter leases.
- Market conditions: 311 active listings in the ZIP; 5 comparable units currently listed for rent nearby; rentals at typical pace (median 25d on market — plan ~3-4 weeks tenant-placement turnaround); solid renter incomes; 1,162 units permitted in Jefferson County in 2024 (360 in 5+ unit buildings).
Forward outlook
- In year one you build about $21k of equity ($1k loan paydown + $20k appreciation (10.0% local appreciation)).
- Jefferson County population projected at +13% by 2050 — modest demand growth; plan on rents tracking national, not racing it.
- By year 2, paydown + projected appreciation supports a ~$34k cash-out refi (75% LTV) — recoverable capital for the next deal without selling this one.
Negotiation context
- It's been on market 48 days — a 3% lower offer ($194k) is reasonable based on typical stale-listing flexibility.
- 4 sale attempts; this cycle's ask has dropped $15k (7%) from the opening price — seller is motivated, your offer sets the floor, not the list.
- Current owner paid $135k; 48% above their basis — modest negotiation headroom, anchor on the comps not their cost.
Risks & watch-outs
- Watch-outs: flood insurance adds $427/mo.
- Climate carrying-cost: in FEMA flood zone AE (mandatory federal flood insurance); extreme-heat days projected 7→16/yr by 2055 (HVAC capex compounding) — expect insurance premiums to compound above CPI over the hold.
Questions for the listing agent
- What do current leases actually rent for vs. the listed asking? Can we see a recent rent roll and the last 12 months of T-12 income?
- It's been on market 48 days. Have you received any prior offers? Is the seller open to a 27% concession, seller financing, or rate buy-down credit?
- Built in 1975 — when were the roof, HVAC, electrical panel, plumbing, and water heater last replaced?
- What's the actual annual flood-insurance premium (NFIP or private), and is the property in a SFHA with mandatory coverage?
- Is there a deadline driving the sale (1031 exchange, divorce, estate, relocation)? That informs how much negotiation room exists.
- Schools are F-rated, which usually means shorter tenancies and higher turnover. Who's the typical renter profile here, and what's been the actual vacancy rate?
- What's the average days-on-market for RENTAL listings here right now (not sales)? A rising rental-DOM trend means longer vacancies and softer asking-rent achievability than the comps imply.
- What's the recent tenant-quality profile in this submarket — average credit score on applications, eviction rate, late-payment / NSF rate, and stable-employment percentage? A property-management company in the area should have these aggregated.
- How much new for-sale + rental construction is in the pipeline within 1–3 miles? Heavy new supply typically softens prices + rents 12–24 months out; constrained supply supports both.
Investment metrics
- 1% rule
- 0.86% ✗
- Cap rate
- 7.00%
- Cash-on-cash
- 2.53%
- DSCR
- 1.11
- GRM
- 9.7
CMA / ARV
- ARV (on-the-fly)
- $271,728
- Comps found
- 12
Show comp detail 12 sales within ~0.75 mi
| Address | Dist | Beds/Ba | Sqft | Sold | Price | $/sf | Match |
|---|---|---|---|---|---|---|---|
| 111 S Mcdonald St | 0.00mi | 3/1.5 (+1) | 1,224 (0%) | 10mo | $135,000 | $110 | 87 |
| 203 S George St | 0.22mi | 3/1.0 (+1) | 1,312 (+7%) | 2mo | $225,000 | $171 | 69 |
| 106 S Mcdonald St | 0.03mi | 3/1.0 (+1) | 1,040 (-15%) | 5mo | $250,000 | $240 | 63 |
| 120 S Water St | 0.57mi | 2/1.5 | 1,200 (-2%) | 11mo | $250,000 | $208 | 61 |
| 631 Eagle Ave | 0.52mi | 2/1.0 | 1,299 (+6%) | 5mo | $204,000 | $157 | 59 |
| 304 S Reymann St | 0.60mi | 3/1.5 (+1) | 1,120 (-8%) | 4mo | $290,000 | $259 | 50 |
| 111 N Fairfax Blvd | 0.49mi | 3/2.0 (+1) | 1,120 (-8%) | 7mo | $130,000 | $116 | 50 |
| 133 Lemon Rd | 0.67mi | 3/1.5 (+1) | 1,092 (-11%) | 0mo | $259,900 | $238 | 46 |
| 113 11th Ave | 0.57mi | 3/2.5 (+1) | 1,277 (+4%) | 14mo | $312,500 | $245 | 46 |
| 312 E 4th Ave | 0.68mi | 3/1.5 (+1) | 1,120 (-8%) | 6mo | $249,000 | $222 | 44 |
| 316 S West St | 0.67mi | 2/1.0 | 1,058 (-14%) | 3mo | $240,000 | $227 | 42 |
| 103 Davenport St | 0.54mi | 3/2.0 (+1) | 1,360 (+11%) | 16mo | $300,000 | $221 | 36 |
Match score weights: distance 35% · size 25% · config 20% · recency 20%. Top-matched comps best support the ARV.
Projected returns pro-forma
10.0% appreciation · 3.0% rent growth · sell at horizon
- IRR
- 19.6%
- Equity multiple
- 2.60×
- Total profit
- $89,485
- Equity at exit
- $180,176
- IRR
- 18.1%
- Equity multiple
- 5.99×
- Total profit
- $279,364
- Equity at exit
- $388,556
Cash invested: $56,000 (down + closing). Projections, not guarantees.
Landlord ↔ Tenant lean methodology
- Overall (STATE)
- 83 Strongly Landlord-Friendly
- State West Virginia
- 83 Strongly Landlord-Friendly · R+22
- County
- — inherits STATE
- City
- — inherits STATE
ZIP-level market 25438
- Home prices YoY
- 10.3%
- Active inventory
- 311
- Price-to-rent
- 9.7×
Monthly cashflow live
- Estimated rent
- $1,719 high interval (Pro) →
- Mortgage (P&I)
- −$1,049
- Tax from tax record
- −$108 /mo · $1,295/yr
- Insurance
- −$83
- Flood insurance flood zone
- −$427 /mo · $5,118/yr
- HOA
- −$0
- Vacancy / Maint / Mgmt
- −$361
- Net cashflow
- $-308
Break-even live
UW: 25.0% down · 7.5% · 30yr · 1.5% tax · 5.0% vac · 8.0% maint · 8.0% mgmt
Financing live
Cash to close
- Down payment
- $50,000
- Closing costs
- $6,000
- Reserves months
- —
- Total cash needed
- —
Loan-product check · same deal, 3 products live
Conventional
25% down · 7.5% · 30yr
- Down + closing
- —
- Monthly P&I
- —
- Monthly cashflow
- —
- DSCR
- —
- Eligible?
- —
Personal DTI + credit; lowest rate.
DSCR
20% down · 8.5% · 30yr
- Down + closing
- —
- Monthly P&I
- —
- Monthly cashflow
- —
- DSCR
- —
- Eligible?
- —
No personal income docs; deal must DSCR.
Hard money
10% down · 12.0% · 12mo
- Down + closing
- —
- Monthly P&I
- —
- Monthly cashflow
- —
- DSCR
- —
- Eligible?
- —
Short-term bridge; refi at stabilization.
Rent comps 5 comps
| Address | Beds | Baths | Sqft | Rent | $/sqft | DOM | Units | Dist |
|---|---|---|---|---|---|---|---|---|
| 124 E 3rd Ave Ranson, WV | 1.0 | 1.0 | 700 | $1,000 | $1.43 | 20d | 1 | 0.45mi |
| 302 N Mildred St Apt 200 Charles Town, WV | 2.0 | 1.0 | 927 | $1,800 | $1.94 | 24d | 1 | 0.49mi |
| 102 N Lawrence St Charles Town, WV | 1.0 | 1.0 | 971 | $1,500 | $1.54 | 24d | 1 | 0.51mi |
| 603 N Fairfax Blvd Ranson, WV | 3.0 | 2.0 | 1040 | $1,850 | $1.78 | 13d | 1 | 0.84mi |
| 1308 Cedar Valley Rd Unit 1308 Ranson, WV | 2.0 | 4.0 | 1333 | $1,899 | $1.42 | 24d | 1 | 1.32mi |
Listing history 18 events
-
2026-06-02days on market $200,000 Active 48 DOM
-
2026-06-01days on market $200,000 Active 47 DOM
-
2026-05-31days on market $200,000 Active 46 DOM
-
2026-05-07price $200,000
-
2026-04-16$215,000 Active
-
2026-04-08historical $215,000
-
2025-12-07historical
-
2025-11-24price $188,000
-
2025-11-07$199,900 Active
-
2025-11-01historical $1,600
-
2025-10-17$1,600
-
2025-09-03soldstatus $135,000
-
2025-08-29soldstatus $135,000 Closed 632-char remark
Show marketing remark (632 chars)
This 3-bedroom, 1.5-bath ranch-style home sits on a spacious corner lot spanning two city parcels—offering plenty of room to grow! A fantastic opportunity for investors or DIY enthusiasts, this fixer-upper features additions on both the front and back of the home, providing extra space. The back addition is where laundry is located. Enjoy privacy in the nice sized backyard, with a storage shed for all your tools and equipment. A newer roof (less than 3 years old). Located in the heart of Ranson, close to local amenities and commuter routes, this property is full of potential. Don't miss your chance to make it your own!
-
2025-08-17status Pending 632-char remark
Show marketing remark (632 chars)
This 3-bedroom, 1.5-bath ranch-style home sits on a spacious corner lot spanning two city parcels—offering plenty of room to grow! A fantastic opportunity for investors or DIY enthusiasts, this fixer-upper features additions on both the front and back of the home, providing extra space. The back addition is where laundry is located. Enjoy privacy in the nice sized backyard, with a storage shed for all your tools and equipment. A newer roof (less than 3 years old). Located in the heart of Ranson, close to local amenities and commuter routes, this property is full of potential. Don't miss your chance to make it your own!
-
2025-08-12$150,000 Active 632-char remark
Show marketing remark (632 chars)
This 3-bedroom, 1.5-bath ranch-style home sits on a spacious corner lot spanning two city parcels—offering plenty of room to grow! A fantastic opportunity for investors or DIY enthusiasts, this fixer-upper features additions on both the front and back of the home, providing extra space. The back addition is where laundry is located. Enjoy privacy in the nice sized backyard, with a storage shed for all your tools and equipment. A newer roof (less than 3 years old). Located in the heart of Ranson, close to local amenities and commuter routes, this property is full of potential. Don't miss your chance to make it your own!
-
2017-04-24soldstatus $100,000
-
2017-04-24soldstatus $100,000
-
1998-04-16soldstatus $45,600
ⓘ Source: listings_history table (triggers on properties + properties_extension) + one-shot
backfill from property_details.listing_events for pre-trigger history.
Tax reassessment forecast WV · Resets to sale price
- Current annual tax
- $1,295 · $108/mo
- Projected year-2 tax
- $1,295 · $108/mo
- Expected delta
- $0/yr ($0/mo · 0.0%)
ⓘ Screening estimate from a state-policy table — verify with the county assessor before closing.
Climate risk First Street
- Flood 8/10 Severe FEMA zone AE · 99% chance over 30 yrs
- Wildfire 3/10 Moderate
- Heat 5/10 Major 7 d/yr ≥102°F today · 16 d/yr by 30 yrs out
- Wind 2/10 Low 3% chance of damaging wind over 30 yrs
- Air quality 2/10 Low 1 unhealthy d/yr today · 1 by 30 yrs out
Nearby sold comps map
Loading sold comps map…
Walkable amenities ~0.75 mi
Loading nearby amenities…
Taxation est. · year 1
- Rental income
- $20,631
- − Mortgage interest
- −$11,203
- − Property taxes
- −$1,295
- − Insurance
- −$6,118
- − Repairs & maintenance
- −$1,650
- − Management
- −$1,650
- − Depreciation
- −$5,818
- Taxable loss
- −$7,104
- Est. tax savings @ 24.0%
- +$1,705
- After-tax cash flow
- $-1,995/yr
For passive investors: Depreciation is non-cash, so a rental often shows a tax loss while cash-flowing — sheltering income. Rental losses are passive: they offset passive income freely, and up to $25,000/yr can offset ordinary (W-2) income if you actively participate and your MAGI is under $100k (phasing out to $0 by $150k); unused losses carry forward. On sale, claimed depreciation is recaptured at up to 25%, and gains may owe capital-gains tax (a 1031 exchange can defer both). Figures are a year-1 estimate at your 24.0% rate — not tax advice; consult a CPA.
Schools (NCES district)
- District
- Jefferson County Schools
- NCES district ID
- 5400570
- Math proficiency
- 29% ▼ -13.00%
- Reading proficiency
- 46% ▼ -7.00%
- Median HH income
- $67,038
- Composite
- 33.98/100
- National rank
- #5322
- State rank
- #6 of 55 in WV
Livability — Ranson
- Score
- 66/100
- State rank
- #100
- US rank
- #11255
Category grades
Schools grade is shown separately in the Schools card above.
Census & demographics
- Census place
- Ranson, WV
- County
- Jefferson County · 28,403 people
- City population
- 7,330
- Metro
- Washington-Arlington-Alexandria, DC-VA-MD-WV
- Population (ZIP)
- 7,330
- Household income
- $81,875
- Rent vs Own
- Severe rent burden
- 90.0
Population outlook (Jefferson County) Hauer SSP2
- Today (2025)
- 61,715 people
- By 2030
- 64,052 · +3.8%
- By 2040
- 67,713 · +9.7%
- By 2050
- 69,843 · +13.2%
- By 2075
- 72,679 · +17.8%
- By 2100
- 71,872 · +16.5%
Race, ethnicity, and origin ACS 2023
- Neighborhood character
- Predominantly White (72%)
- Race & ethnicity
- White 72% Hispanic / Latino 14% Two or more races 7% Black 7% Asian 3%
- Hispanic origin (detail)
- Mexican 3% Puerto Rican 4%
- Common ancestry
- Serbian 4% Italian 2% Romanian 2%
- Foreign-born
- 7% · Canada, Philippines
- Languages at home
- 87% English-only · Spanish 9% Other Asian/Pacific 3%
Political lean MEDSL · Jefferson
- 2024 margin
- R (+15.8) · D 41.0% · R 56.8% · Other 2.1%
- 2008→2024 swing
- -20.6pp toward R · 2008: 4.8pp · 2024: -15.8pp
- All cycles
- 2024: R+15.8 2020: R+10.5 2016: R+15.3 2012: R+4.0 2008: D+4.8
Not yet ingested
- Civics
- —
Market trends
- HPI YoY
- ▲ 32.87%
- Current HPI
- 352.707
- Rent YoY
- —
- Metro
- Washington-Arlington-Alexandria, DC-VA-MD-WV
- State GDP YoY
- —
- F500 in state
- 0
Price history
+338.6% since first listed15 events — show timeline
- 2026-05-07 Price Changed $200,000 BRIGHT MLS
- 2026-04-16 Listed $215,000 BRIGHT MLS
- 2026-04-08 Coming Soon $215,000 BRIGHT MLS
- 2025-12-07 Listing Removed — BRIGHT MLS
- 2025-11-24 Price Changed $188,000 BRIGHT MLS
- 2025-11-07 Listed $199,900 BRIGHT MLS
- 2025-11-01 Rental Removed $1,600 BRIGHTMLS
- 2025-10-17 Listed for Rent $1,600 BRIGHTMLS
- 2025-09-03 Sold (Public Records) $135,000 Public Records
- 2025-08-29 Sold (MLS) $135,000 BRIGHT MLS
- 2025-08-17 Pending — BRIGHT MLS
- 2025-08-12 Listed $150,000 BRIGHT MLS
- 2017-04-24 Sold (Public Records) $100,000 Public Records
- 2017-04-24 Sold (Public Records) $100,000 Public Records
- 1998-04-16 Sold (Public Records) $45,600 Public Records
Property tax history
+0.4%/yrLatest (2025): $1,295 · +10.5% YoY. Source: county tax records.
Cash-flow waterfall
monthlySold comps — $/sqft
last 12 mo · ≤1 miLoading sold comps…