3674 Ruby Ln #35 · Nasewaupee, WI
Flood risk 1/10 · Minimal
- FEMA flood zone
- X (unshaded)
- Chance of flooding over 30 yrs
- 0.0%
- Est. flood insurance / yr
- $507 – $1,088
Fire risk 1/10 · Minimal
- Est. fire insurance / yr
- $636 – $1,182
Heat risk 1/10 · Minimal
- Hot days now (above 90°F)
- 7 days/yr
- Hot days in 30 yrs
- 13 days/yr
Wind risk 1/10 · Minimal
- Chance of severe wind over 30 yrs
- —
Air-quality risk 2/10 · Minimal
- Unhealthy air days now
- 1 days/yr
- Unhealthy air days in 30 yrs
- 1 days/yr
Risk factors via First Street. Map © Google.
Why this score? — see what drove the D+ grade
The composite is a weighted blend of 9 inputs, each scored 0–100. Each bar is that input's sub-score; the figure is the points it added to the 100-point composite (weight × sub-score).
- Cash flow +19.6/30.0
- ARV discount +7.5/15.0
- DSCR +6.2/10.0
- 1% rule +4.8/10.0
- Schools +3.8/10.0
- Rent growth +2.5/5.0
- Livability +2.5/5.0
- Condition / age +2.5/5.0
- Appreciation +0.0/10.0
$132,900
🖨 Deal sheet 📄 Offer letter ✓ Due diligence
Listing remarks MLS
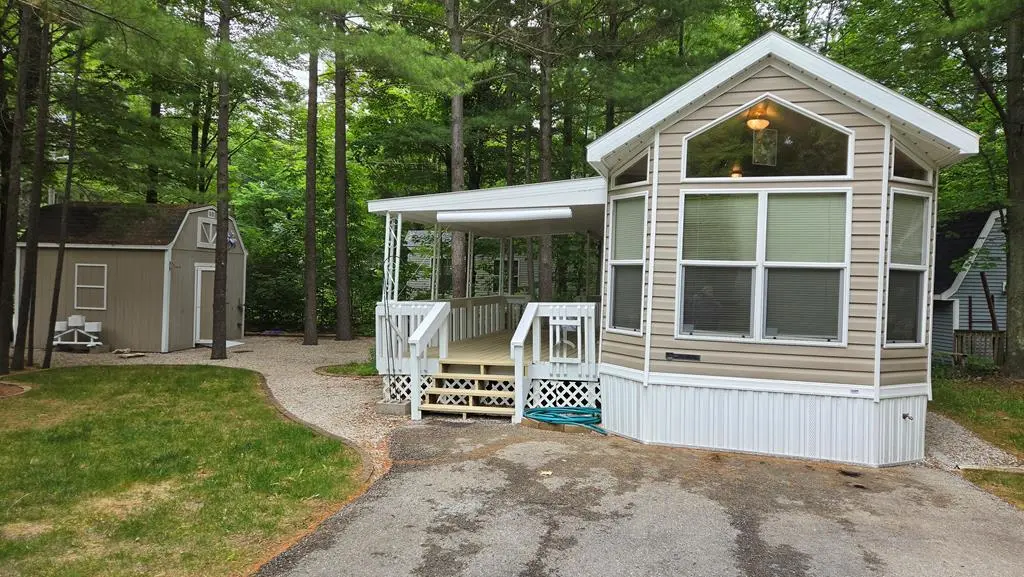
Move right in! Very well maintained property inside and out. All furnishings are included too. This Park Model has an extended loft with 2 sleeping areas. The kitchen and dining area are a combined measurement and are open to the living room which has a sleeper sofa and a room divider if you wish for extra privacy. Entertainment on your spacious 19x11 covered deck complete with patio table and chairs. The rec center is steps away with an indoor pool, whirlpool, sauna and beautiful lounge area with Door County stone fireplace. This unit has year round water. Ride your bike or walk into adjacent Potawatomi State Park.
Key facts
- Clubhouse
- Hot tub
- Swimming pool
Tags
Property features AI
Finance
- HOA & community: Homeowners association with annual fee of $1,175 (about $97.92/month)
Exterior
- Home design: Residential condominium
- Exterior features: Part of the Hidden Ridge community
Interior
- Bathrooms: 1 full bathroom
- Heating & cooling: Central Air; Forced Air heating (propane)
- Interior features: Central air conditioning; Forced air heating (propane)
Neighborhood map
What this means for you Summary
Snapshot
- This is a 3-bed/1.0-bath condo listed at $133k.
Deal economics
- At list price, monthly cash flow is $152 ($2k/yr) — positive.
- The deal already cash-flows at list — no discount required.
- To meet the 1% rule (rent ≥ 1% of price), the offer needs to be $130k (2.0% below list).
- Recommended offer: $130k (2.0% below list) — sets the bar for 1% rule.
Location & tenants
- Location reads: area grade D — affects rentability + tenant quality, not the cash-flow math above.
- Southern Door County School District (rural): math 44% / reading 43% proficiency, ranked #112 of 342 in WI (top 33%) — families likely to look elsewhere, expect single-tenant / working-renter base with shorter leases.
- Market conditions: 200 active listings in the ZIP; 306 units permitted in Door County in 2024 (0 in 5+ unit buildings).
Forward outlook
- Local home prices are declining (-3.0%/yr); year-one equity from $919 of loan paydown is wiped out by about $4k of value loss. Plan a longer hold.
- Door County population projected at -15% by 2050 — secular population decline; favor cash flow + early exit over multi-decade hold.
Negotiation context
- Only 6 days on market — expect competitive offers; lowballing is unlikely to land.
- 2 sale attempts since 7y ago with the ask held roughly flat each time — persistent listings suggest the price (not the market) is what's stuck; bring a comps-based counter.
- Current owner paid $65k; list at $133k implies a 104% gain — meaningful room to come down on a strong offer.
Questions for the listing agent
- What does the HOA fee cover, when was the last increase, and are there any pending special assessments or reserve-fund shortfalls?
- Any open or pending special assessments — roof, HVAC, plumbing, elevator, façade? What's the per-unit balance and payoff schedule, and is the seller paying it off at close or rolling it to the buyer?
- Is there a deadline driving the sale (1031 exchange, divorce, estate, relocation)? That informs how much negotiation room exists.
- The area grade is low — what's the realistic commute time and amenity access for the typical tenant pool here? Any planned neighborhood developments (good or bad) we should know about?
- What's the average days-on-market for RENTAL listings here right now (not sales)? A rising rental-DOM trend means longer vacancies and softer asking-rent achievability than the comps imply.
- What's the recent tenant-quality profile in this submarket — average credit score on applications, eviction rate, late-payment / NSF rate, and stable-employment percentage? A property-management company in the area should have these aggregated.
- How much new apartment / multifamily construction is in the pipeline within 1–3 miles? Heavy new supply (>2% of stock underway) typically softens rents 12–24 months out; light construction supports rent growth.
Investment metrics
- 1% rule
- 0.98% ✗
- Cap rate
- 7.67%
- Cash-on-cash
- 4.91%
- DSCR
- 1.22
- GRM
- 8.5
CMA / ARV
No comps found within radius.
Projected returns pro-forma
-3.0% appreciation · 3.0% rent growth · sell at horizon
- IRR
- -8.7%
- Equity multiple
- 0.68×
- Total profit
- $-11,839
- Equity at exit
- $19,816
- IRR
- 0.8%
- Equity multiple
- 1.06×
- Total profit
- $2,160
- Equity at exit
- $11,491
Cash invested: $37,212 (down + closing). Projections, not guarantees.
Landlord ↔ Tenant lean methodology
- Overall (STATE)
- 73 Landlord-Friendly
- State Wisconsin
- 73 Landlord-Friendly · R+2
- County
- — inherits STATE
- City
- — inherits STATE
ZIP-level market 54235
- Active inventory
- 200
- Price-to-rent
- 8.5×
Monthly cashflow live
- Estimated rent
- $1,302 medium interval (Pro) →
- Mortgage (P&I)
- −$697
- Tax from tax record
- −$26 /mo · $310/yr
- Insurance
- −$55
- HOA
- −$98
- Vacancy / Maint / Mgmt
- −$273
- Net cashflow
- $152
Break-even live
UW: 25.0% down · 7.5% · 30yr · 1.5% tax · 5.0% vac · 8.0% maint · 8.0% mgmt
Financing live
Cash to close
- Down payment
- $33,225
- Closing costs
- $3,987
- Reserves months
- —
- Total cash needed
- —
Loan-product check · same deal, 3 products live
Conventional
25% down · 7.5% · 30yr
- Down + closing
- —
- Monthly P&I
- —
- Monthly cashflow
- —
- DSCR
- —
- Eligible?
- —
Personal DTI + credit; lowest rate.
DSCR
20% down · 8.5% · 30yr
- Down + closing
- —
- Monthly P&I
- —
- Monthly cashflow
- —
- DSCR
- —
- Eligible?
- —
No personal income docs; deal must DSCR.
Hard money
10% down · 12.0% · 12mo
- Down + closing
- —
- Monthly P&I
- —
- Monthly cashflow
- —
- DSCR
- —
- Eligible?
- —
Short-term bridge; refi at stabilization.
HOA detail condo
- Monthly dues
- $98 · $1,176/yr
- Likely covers
- waterpool
- Assessments
- None detected in remarks — confirm with the listing agent.
Listing history 7 events
-
2026-06-18days on market $132,900 Active 6 DOM
-
2026-06-17days on market $132,900 Active 5 DOM
-
2026-06-16days on market $132,900 Active 4 DOM
-
2026-06-15days on market $132,900 Active 3 DOM
-
2026-06-15days on market $132,900 Active 2 DOM
-
2026-06-12remarks 471-char remark
-
2026-06-12$132,900 Active 1 DOM
ⓘ Source: listings_history table (triggers on properties + properties_extension) + one-shot
backfill from property_details.listing_events for pre-trigger history.
Tax reassessment forecast WI · Partial reset (capped growth)
- Current annual tax
- $310 · $26/mo
- Projected year-2 tax
- $1,384 · $115/mo
- Expected delta
- +$1,074/yr (+$90/mo · 346.6%)
ⓘ Screening estimate from a state-policy table — verify with the county assessor before closing.
Climate risk First Street
- Flood 1/10 Low FEMA zone X (unshaded) · 0% chance over 30 yrs
- Wildfire 1/10 Low
- Heat 1/10 Low 7 d/yr ≥90°F today · 13 d/yr by 30 yrs out
- Wind 1/10 Low
- Air quality 2/10 Low 1 unhealthy d/yr today · 1 by 30 yrs out
Nearby sold comps map
Loading sold comps map…
Walkable amenities ~0.75 mi
Loading nearby amenities…
Taxation est. · year 1
- Rental income
- $15,623
- − Mortgage interest
- −$7,444
- − Property taxes
- −$310
- − Insurance
- −$664
- − Repairs & maintenance
- −$1,250
- − Management
- −$1,250
- − HOA
- −$1,176
- − Depreciation
- −$3,866
- Taxable loss
- −$338
- Est. tax savings @ 24.0%
- +$81
- After-tax cash flow
- $1,909/yr
For passive investors: Depreciation is non-cash, so a rental often shows a tax loss while cash-flowing — sheltering income. Rental losses are passive: they offset passive income freely, and up to $25,000/yr can offset ordinary (W-2) income if you actively participate and your MAGI is under $100k (phasing out to $0 by $150k); unused losses carry forward. On sale, claimed depreciation is recaptured at up to 25%, and gains may owe capital-gains tax (a 1031 exchange can defer both). Figures are a year-1 estimate at your 24.0% rate — not tax advice; consult a CPA.
Schools (NCES district)
- District
- Southern Door County School District
- NCES district ID
- 5514130
- Math proficiency
- 44% ▼ -5.00%
- Reading proficiency
- 43% ▲ 6.00%
- Median HH income
- $53,856
- Composite
- 37.78/100
- National rank
- #4345
- State rank
- #112 of 342 in WI
Livability — Nasewaupee
No livability data for this city. (Only ~50 U.S. cities are tracked.)
Census & demographics
- Population (ZIP)
- 17,845
Population outlook (Door County) Hauer SSP2
- Today (2025)
- 27,220 people
- By 2030
- 26,785 · -1.6%
- By 2040
- 25,167 · -7.5%
- By 2050
- 23,052 · -15.3%
- By 2075
- 18,981 · -30.3%
- By 2100
- 14,801 · -45.6%
Race, ethnicity, and origin ACS 2023
- Neighborhood character
- Predominantly White (91%)
- Race & ethnicity
- White 91% Hispanic / Latino 5% Two or more races 5% Native American 1%
- Common ancestry
- Portuguese 8% English 7% Romanian 6%
- Foreign-born
- 2% · Canada
- Languages at home
- 96% English-only · Spanish 3%
Political lean MEDSL · Door
- 2024 margin
- Toss-up / Even · D 50.6% · R 48.3% · Other 1.1%
- 2008→2024 swing
- -15.1pp toward R · 2008: 17.3pp · 2024: 2.2pp
- All cycles
- 2024: D+2.2 2020: D+1.4 2016: R+3.2 2012: D+7.0 2008: D+17.3
Not yet ingested
- Civics
- —
Market trends
- HPI YoY
- ▼ -159.61%
- Current HPI
- 197.0112
- Rent YoY
- —
- Metro
- —
- State GDP YoY
- ▲ 2.10%
- F500 in state
- 20
Industry mix (Fortune 500 HQ in WI)
| Industry | F500 HQs | Revenue |
|---|---|---|
| Industrial Machinery | 4 | $23B |
|
||
| Industrial Technology | 2 | $36B |
|
||
| Insurance | 1 | $36B |
|
||
| Professional Services | 1 | $19B |
|
||
| Utilities | 1 | $9B |
|
||
| Consumer Goods | 1 | $3B |
|
||
Price history
+195.3% since first listed5 events — show timeline
- 2026-06-12 Listed $132,900 DCBRMLS
- 2019-10-14 Sold (Public Records) $65,000 Public Records
- 2019-10-11 Sold (MLS) $65,000 DCBRMLS
- 2019-08-01 Listed $68,000 DCBRMLS
- 2002-06-07 Sold (Public Records) $45,000 Public Records
Property tax history
-3.3%/yrLatest (2025): $310 · -46.2% YoY. Source: county tax records.
Cash-flow waterfall
monthlySold comps — $/sqft
last 12 mo · ≤1 miLoading sold comps…