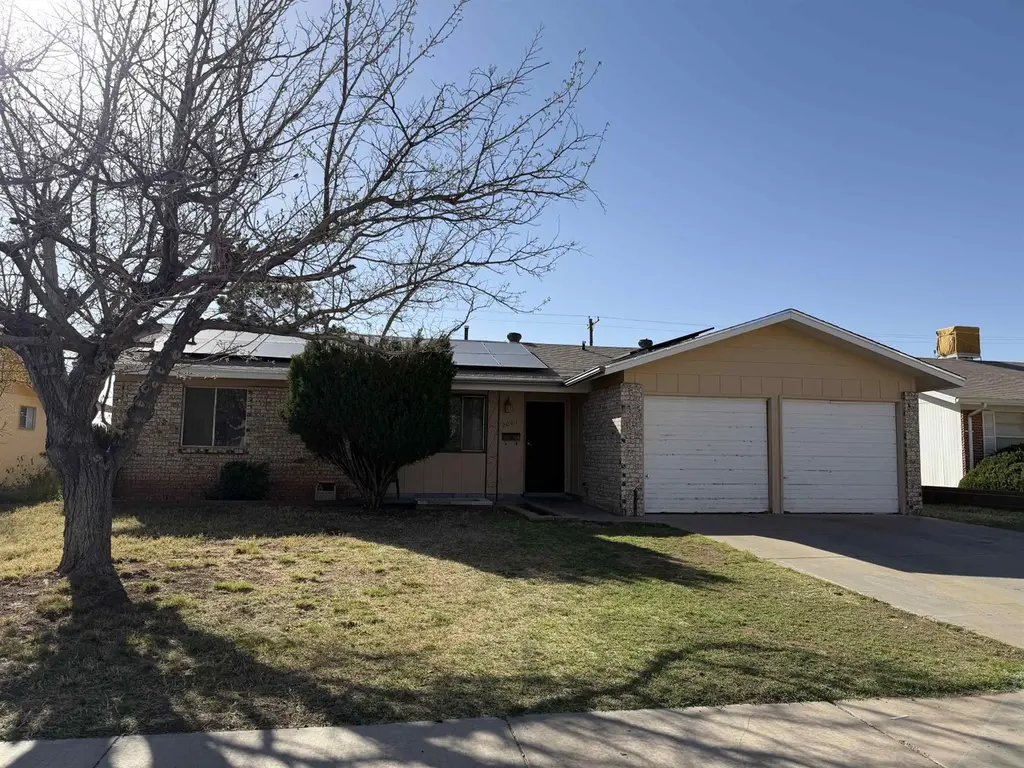
2001 Crescent Dr · Alamogordo, NM
Flood risk 1/10 · Minimal
- FEMA flood zone
- X (unshaded)
- Chance of flooding over 30 yrs
- 0.0%
- Est. flood insurance / yr
- $507 – $1,088
Fire risk 5/10 · Moderate
- Est. fire insurance / yr
- $706 – $1,312
Heat risk 5/10 · Moderate
- Hot days now (above 90°F)
- 8 days/yr
- Hot days in 30 yrs
- 27 days/yr
Wind risk 1/10 · Minimal
- Chance of severe wind over 30 yrs
- —
Air-quality risk 1/10 · Minimal
- Unhealthy air days now
- 0 days/yr
- Unhealthy air days in 30 yrs
- 0 days/yr
Risk factors via First Street. Map © Google.
Why this score? — see what drove the C grade
The composite is a weighted blend of 9 inputs, each scored 0–100. Each bar is that input's sub-score; the figure is the points it added to the 100-point composite (weight × sub-score).
- Cash flow +25.7/30.0
- DSCR +8.6/10.0
- ARV discount +7.5/15.0
- 1% rule +5.8/10.0
- Livability +3.9/5.0
- Schools +3.0/10.0
- Rent growth +2.9/5.0
- Condition / age +2.5/5.0
- Appreciation +0.0/10.0
$160,000
🖨 Deal sheet 📄 Offer letter ✓ Due diligence
Listing remarks
3 bedroom, 1.75 bath brick home on Crescent Drive in Alamogordo. Built in 1971, the home features two living areas and a fireplace. Newer hot water heater. Owned solar panels are installed on the roof. Fenced yard with back patio. Conveniently located near New Mexico State University at Alamogordo, the New Mexico Museum of Space History, and nearby medical facilities. Property offers an opportunity for a buyer looking to update and customize a home in an established area.
Key facts
- Fenced yard
- Two living areas
- Brick home
Tags
Neighborhood map
What this means for you Summary
Snapshot
- This is a 3-bed/2.0-bath single-family listed at $160k.
Deal economics
- At list price, monthly cash flow is $385 ($5k/yr) — positive.
- The deal already cash-flows at list — no discount required.
- Meets the 1% rule at list price ($2k rent vs $160k).
Location & tenants
- Location reads 77/100 on livability (#5 in NM, #3,233 nationally) — a middle-class / working-renter tenant base. Strengths: commute A+, cost of living A+, housing A+; Watch: crime D, employment D, schools F.
- Alamogordo Public Schools (town): math 26% / reading 39% proficiency, ranked #26 of 95 in NM (top 27%) — families likely to look elsewhere, expect single-tenant / working-renter base with shorter leases.
- Market conditions: Rents rising (+1.6%/yr); 444 active listings in the ZIP; 10 comparable units currently listed for rent nearby; rentals at typical pace (median 24d on market — plan ~3-4 weeks tenant-placement turnaround); 6 units permitted in Otero County in 2024 (0 in 5+ unit buildings).
- This rent runs 36% of the median local income ($57k/yr) — at the standard rent-burdened threshold; future hikes will face affordability resistance.
Forward outlook
- Local home prices are declining (-3.0%/yr); year-one equity from $1k of loan paydown is wiped out by about $5k of value loss. Plan a longer hold.
- Otero County population projected to shrink 7% by 2050 — rents likely to lag national; underwrite the cash flow, not the appreciation.
Negotiation context
- Only 11 days on market — expect competitive offers; lowballing is unlikely to land.
Risks & watch-outs
- Climate carrying-cost: moderate wildfire risk; extreme-heat days projected 8→27/yr by 2055 (HVAC capex compounding) — expect insurance premiums to compound above CPI over the hold.
Questions for the listing agent
- Built in 1971 — when were the roof, HVAC, electrical panel, plumbing, and water heater last replaced?
- Is there a deadline driving the sale (1031 exchange, divorce, estate, relocation)? That informs how much negotiation room exists.
- Schools are F-rated, which usually means shorter tenancies and higher turnover. Who's the typical renter profile here, and what's been the actual vacancy rate?
- Crime grade is D in this area — have there been break-ins, vandalism, or insurance claims at this property in the last 3 years? What carrier currently insures it and at what premium?
- What's the average days-on-market for RENTAL listings here right now (not sales)? A rising rental-DOM trend means longer vacancies and softer asking-rent achievability than the comps imply.
- What's the recent tenant-quality profile in this submarket — average credit score on applications, eviction rate, late-payment / NSF rate, and stable-employment percentage? A property-management company in the area should have these aggregated.
- How much new for-sale + rental construction is in the pipeline within 1–3 miles? Heavy new supply typically softens prices + rents 12–24 months out; constrained supply supports both.
Investment metrics
- 1% rule
- 1.08% ✓
- Cap rate
- 9.18%
- Cash-on-cash
- 10.32%
- DSCR
- 1.46
- GRM
- 7.7
CMA / ARV
No comps found within radius.
Projected returns pro-forma
-3.0% appreciation · 1.65% rent growth · sell at horizon
- IRR
- -2.3%
- Equity multiple
- 0.92×
- Total profit
- $-3,757
- Equity at exit
- $23,857
- IRR
- 6.0%
- Equity multiple
- 1.42×
- Total profit
- $18,877
- Equity at exit
- $13,834
Cash invested: $44,800 (down + closing). Projections, not guarantees.
Landlord ↔ Tenant lean methodology
- Overall (STATE)
- 55 Moderately Landlord-Leaning
- State New Mexico
- 55 Moderately Landlord-Leaning · D+3
- County
- — inherits STATE
- City
- — inherits STATE
ZIP-level market 88310
- Rents YoY
- 1.6%
- Active inventory
- 444
- Price-to-rent
- 7.7×
Monthly cashflow live
- Estimated rent
- $1,723 high interval (Pro) →
- Mortgage (P&I)
- −$839
- Tax from tax record
- −$71 /mo · $847/yr
- Insurance
- −$67
- HOA
- −$0
- Vacancy / Maint / Mgmt
- −$362
- Net cashflow
- $385
Break-even live
UW: 25.0% down · 7.5% · 30yr · 1.5% tax · 5.0% vac · 8.0% maint · 8.0% mgmt
Financing live
Cash to close
- Down payment
- $40,000
- Closing costs
- $4,800
- Reserves months
- —
- Total cash needed
- —
Loan-product check · same deal, 3 products live
Conventional
25% down · 7.5% · 30yr
- Down + closing
- —
- Monthly P&I
- —
- Monthly cashflow
- —
- DSCR
- —
- Eligible?
- —
Personal DTI + credit; lowest rate.
DSCR
20% down · 8.5% · 30yr
- Down + closing
- —
- Monthly P&I
- —
- Monthly cashflow
- —
- DSCR
- —
- Eligible?
- —
No personal income docs; deal must DSCR.
Hard money
10% down · 12.0% · 12mo
- Down + closing
- —
- Monthly P&I
- —
- Monthly cashflow
- —
- DSCR
- —
- Eligible?
- —
Short-term bridge; refi at stabilization.
Rent comps 10 comps
| Address | Beds | Baths | Sqft | Rent | $/sqft | DOM | Units | Dist |
|---|---|---|---|---|---|---|---|---|
| 2360 Mesa Ln Alamogordo, NM | 3.0 | 2.0 | 1173 | $1,600 | $1.36 | 23d | 1 | 0.26mi |
| 2116 N Scenic Dr Apt A1 Alamogordo, NM | 2.0 | 1.0 | 957 | $950 | $0.99 | 23d | 1 | 0.36mi |
| 2201 Mesa Ln Alamogordo, NM | 3.0 | 2.0 | 1408 | $3,000 | $2.13 | 23d | 1 | 0.37mi |
| 2606 Pontiac Dr Alamogordo, NM | 3.0 | 2.0 | 1785 | $1,650 | $0.92 | 23d | 1 | 0.43mi |
| 2300 Aspen Dr Alamogordo, NM | 3.0 | 2.0 | 1368 | $1,400 | $1.02 | 3d | 1 | 0.74mi |
| 1502 Campbell Pl Alamogordo, NM | 3.0 | 2.0 | 1816 | $1,450 | $0.80 | 23d | 1 | 0.88mi |
| 1301 Fillmore Ave Alamogordo, NM | 2.0 | 1.0 | 967 | $1,095 | $1.13 | 44d | 2 | 0.95mi |
| 1301 Jefferson Ave Unit LAST ONE AVAILABLE!! Alamogordo, NM | 2.0 | 2.0 | 892 | $1,425 | $1.60 | 3d | 1 | 0.98mi |
| 1514 Utah Ave Alamogordo, NM | 2.0 | 1.0 | 1119 | $1,450 | $1.30 | 14d | 1 | 0.99mi |
| 2637 Las Alturas Ct Alamogordo, NM | 3.0 | 2.0 | 1366 | $1,600 | $1.17 | 43d | 1 | 1.14mi |
Listing history 5 events
-
2026-04-21status Pending
-
2026-04-10$160,000 Active
-
2026-03-18price $168,000
-
2026-03-11price $170,000
-
2026-01-16soldstatus
ⓘ Source: listings_history table (triggers on properties + properties_extension) + one-shot
backfill from property_details.listing_events for pre-trigger history.
Tax reassessment forecast NM · Resets to sale price
- Current annual tax
- $847 · $71/mo
- Projected year-2 tax
- $1,280 · $107/mo
- Expected delta
- +$433/yr (+$36/mo · 51.2%)
ⓘ Screening estimate from a state-policy table — verify with the county assessor before closing.
Climate risk First Street
- Flood 1/10 Low FEMA zone X (unshaded) · 0% chance over 30 yrs
- Wildfire 5/10 Major
- Heat 5/10 Major 8 d/yr ≥90°F today · 27 d/yr by 30 yrs out
- Wind 1/10 Low
- Air quality 1/10 Low 0 unhealthy d/yr today · 0 by 30 yrs out
Nearby sold comps map
Loading sold comps map…
Walkable amenities ~0.75 mi
Loading nearby amenities…
Taxation est. · year 1
- Rental income
- $20,681
- − Mortgage interest
- −$8,962
- − Property taxes
- −$847
- − Insurance
- −$800
- − Repairs & maintenance
- −$1,654
- − Management
- −$1,654
- − Depreciation
- −$4,655
- Taxable income
- $2,108
- Est. tax owed @ 24.0%
- −$506
- After-tax cash flow
- $4,116/yr
For passive investors: Depreciation is non-cash, so a rental often shows a tax loss while cash-flowing — sheltering income. Rental losses are passive: they offset passive income freely, and up to $25,000/yr can offset ordinary (W-2) income if you actively participate and your MAGI is under $100k (phasing out to $0 by $150k); unused losses carry forward. On sale, claimed depreciation is recaptured at up to 25%, and gains may owe capital-gains tax (a 1031 exchange can defer both). Figures are a year-1 estimate at your 24.0% rate — not tax advice; consult a CPA.
Schools (NCES district)
- District
- Alamogordo Public Schools
- NCES district ID
- 3500030
- Math proficiency
- 26% —
- Reading proficiency
- 39% —
- Median HH income
- $42,194
- Composite
- 30.24/100
- National rank
- #11572
- State rank
- #26 of 95 in NM
Livability — Alamogordo
- Score
- 77/100
- State rank
- #5
- US rank
- #3233
Category grades
Schools grade is shown separately in the Schools card above.
Census & demographics
- Census place
- Alamogordo, NM
- County
- Otero County · 36,983 people
- City population
- 36,983
- Metro
- Alamogordo, NM
- Population (ZIP)
- 36,983
- Household income
- $57,214
- Rent vs Own
- Severe rent burden
- 1231.0
Population outlook (Otero County) Hauer SSP2
- Today (2025)
- 62,967 people
- By 2030
- 62,164 · -1.3%
- By 2040
- 60,253 · -4.3%
- By 2050
- 58,575 · -7.0%
- By 2075
- 55,411 · -12.0%
- By 2100
- 48,551 · -22.9%
Race, ethnicity, and origin ACS 2023
- Neighborhood character
- Diverse neighborhood (Simpson 0.59)
- Race & ethnicity
- White 56% Hispanic / Latino 31% Two or more races 18% Black 5% Asian 2% Native American 2%
- Hispanic origin (detail)
- Mexican 25%
- Common ancestry
- Slovak 3% Lithuanian 2% Italian 1%
- Foreign-born
- 6% · Canada
- Languages at home
- 85% English-only · Spanish 12% Tagalog/Filipino 1%
Political lean MEDSL · Otero
- 2024 margin
- Strong R (+27.0) · D 35.4% · R 62.4% · Other 2.2%
- 2008→2024 swing
- -7.7pp toward R · 2008: -19.3pp · 2024: -27.0pp
- All cycles
- 2024: R+27.0 2020: R+25.6 2016: R+29.1 2012: R+28.0 2008: R+19.3
Not yet ingested
- Civics
- —
Market trends
- HPI YoY
- ▼ -174.88%
- Current HPI
- 181.737
- Rent YoY
- ▲ 1.65%
- Metro
- Alamogordo, NM
- State GDP YoY
- —
- F500 in state
- 0
Price history
-5.9% since first listed5 events — show timeline
- 2026-04-21 Pending — OCAOR
- 2026-04-10 Listed $160,000 OCAOR
- 2026-03-18 Price Changed $168,000 OCAOR
- 2026-03-11 Price Changed $170,000 OCAOR
- 2026-01-16 Sold (Public Records) — Public Records
Property tax history
+1.6%/yrLatest (2025): $847 · +3.5% YoY. Source: county tax records.
Cash-flow waterfall
monthlySold comps — $/sqft
last 12 mo · ≤1 miLoading sold comps…