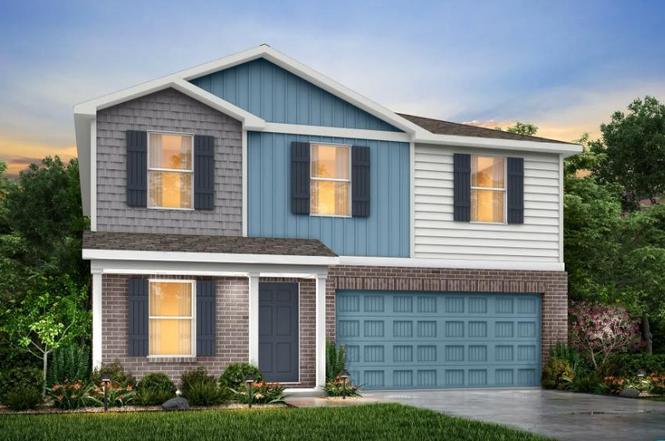
13432 Balderdash Ct · Cresson, TX
Flood risk 1/10 · Minimal
- FEMA flood zone
- X (unshaded)
- Chance of flooding over 30 yrs
- 0.0%
- Est. flood insurance / yr
- $507 – $1,088
Fire risk 6/10 · Moderate
- Est. fire insurance / yr
- $1,222 – $2,270
Heat risk 7/10 · Major
- Hot days now (above 108°F)
- 7 days/yr
- Hot days in 30 yrs
- 23 days/yr
Wind risk 6/10 · Moderate
- Chance of severe wind over 30 yrs
- 27.0%
Air-quality risk 2/10 · Minimal
- Unhealthy air days now
- 1 days/yr
- Unhealthy air days in 30 yrs
- 2 days/yr
Risk factors via First Street. Map © Google.
Why this score? — see what drove the C grade
The composite is a weighted blend of 9 inputs, each scored 0–100. Each bar is that input's sub-score; the figure is the points it added to the 100-point composite (weight × sub-score).
- Cash flow +22.7/30.0
- ARV discount +7.5/15.0
- DSCR +7.3/10.0
- 1% rule +5.4/10.0
- Appreciation +4.1/10.0
- Schools +4.0/10.0
- Livability +3.2/5.0
- Rent growth +2.5/5.0
- Condition / age +2.5/5.0
$229,990
🖨 Deal sheet 📄 Offer letter ✓ Due diligence
Listing remarks
MLS# 21095505 - Built by NHC - Ready Now! ~ The Harrison Plan from our Liberty Series offers a perfect blend of comfort, practicality, and exceptional value. This 2-story home features 4 bedrooms, 2.5 bathrooms, a 2-car garage, and 2,203 square feet of thoughtfully designed living space. As you step inside, you’ll pass the versatile flex room before reaching the staircase to the upper level, a convenient closet, and a half bathroom. The heart of the home is the open kitchen and living area, complete with a central island, a dining area, and a spacious family room — perfect for entertaining or relaxing with loved ones. Upstairs, the private primary suite awaits, featuring an en s
Key facts
- 6,534 sq ft lot
- 2 garage spots
- Built 2024
Neighborhood map
What this means for you Summary
Snapshot
- This is a 4-bed/2.5-bath land listed at $230k.
Deal economics
- At list price, monthly cash flow is $397 ($5k/yr) — positive.
- The deal already cash-flows at list — no discount required.
- Meets the 1% rule at list price ($2k rent vs $230k).
- Recommended offer: $202k (12.0% below list) — sets the bar for market timing.
- Cap rate 8.4% vs local median 3.4% in Cresson — top-decile yield for the area; either an underpriced asset or a hidden risk that comps aren't pricing in. Stress-test before assuming the spread holds.
Location & tenants
- Location reads 63/100 on livability (#843 in TX) — a middle-class / working-renter tenant base. Strengths: cost of living A+, housing A+, employment B+; Watch: health & safety D+, crime D, schools F.
- Granbury ISD (town): math 46% / reading 46% proficiency, ranked #237 of 826 in TX (top 29%) — families likely to look elsewhere, expect single-tenant / working-renter base with shorter leases.
- Market conditions: 97 active listings in the ZIP; 8 comparable units currently listed for rent nearby; rentals leasing fast (median 1d on market — plan ~1-2 weeks tenant-placement turnaround); 2,152 units permitted in Johnson County in 2024 (76 in 5+ unit buildings).
Forward outlook
- Local home prices are declining (-1.9%/yr); year-one equity from $2k of loan paydown is wiped out by about $4k of value loss. Plan a longer hold.
- Johnson County population projected at +24% by 2050 — long-run rental-demand tailwind backs the buy-and-hold thesis.
Negotiation context
- It's been on market 170 days — a 12% lower offer ($202k) is reasonable based on typical stale-listing flexibility.
- 3 sale attempts; this cycle's ask has dropped $71k (24%) from the opening price — seller is motivated, your offer sets the floor, not the list.
Risks & watch-outs
- Climate carrying-cost: major wind risk, 27% chance of damaging wind over 30y; major wildfire risk; extreme-heat days projected 7→23/yr by 2055 (HVAC capex compounding) — expect insurance premiums to compound above CPI over the hold.
Questions for the listing agent
- It's been on market 170 days. Have you received any prior offers? Is the seller open to a 12% concession, seller financing, or rate buy-down credit?
- What does the HOA fee cover, when was the last increase, and are there any pending special assessments or reserve-fund shortfalls?
- Why hasn't it sold? Are there any deal-killer items the seller is aware of (foundation, flood, title, zoning, code violations)?
- Is there a deadline driving the sale (1031 exchange, divorce, estate, relocation)? That informs how much negotiation room exists.
- Schools are F-rated, which usually means shorter tenancies and higher turnover. Who's the typical renter profile here, and what's been the actual vacancy rate?
- Crime grade is D in this area — have there been break-ins, vandalism, or insurance claims at this property in the last 3 years? What carrier currently insures it and at what premium?
- What's the average days-on-market for RENTAL listings here right now (not sales)? A rising rental-DOM trend means longer vacancies and softer asking-rent achievability than the comps imply.
- What's the recent tenant-quality profile in this submarket — average credit score on applications, eviction rate, late-payment / NSF rate, and stable-employment percentage? A property-management company in the area should have these aggregated.
- How much new for-sale + rental construction is in the pipeline within 1–3 miles? Heavy new supply typically softens prices + rents 12–24 months out; constrained supply supports both.
Investment metrics
- 1% rule
- 1.04% ✓
- Cap rate
- 8.36%
- Cash-on-cash
- 7.40%
- DSCR
- 1.33
- GRM
- 8.0
CMA / ARV
No comps found within radius.
Projected returns pro-forma
-1.87% appreciation · 3.0% rent growth · sell at horizon
- IRR
- -0.4%
- Equity multiple
- 0.99×
- Total profit
- $-936
- Equity at exit
- $46,082
- IRR
- 7.4%
- Equity multiple
- 1.65×
- Total profit
- $41,569
- Equity at exit
- $40,739
Cash invested: $64,397 (down + closing). Projections, not guarantees.
Landlord ↔ Tenant lean methodology
- Overall (STATE)
- 87 Strongly Landlord-Friendly
- State Texas
- 87 Strongly Landlord-Friendly · R+5
- County
- — inherits STATE
- City
- — inherits STATE
ZIP-level market 76035
- Home prices YoY
- -1.0%
- Active inventory
- 97
- Price-to-rent
- 8.0×
Monthly cashflow live
- Estimated rent
- $2,381 high interval (Pro) →
- Mortgage (P&I)
- −$1,206
- Tax from tax record
- −$57 /mo · $688/yr
- Insurance
- −$96
- HOA
- −$125
- Vacancy / Maint / Mgmt
- −$500
- Net cashflow
- $397
Break-even live
UW: 25.0% down · 7.5% · 30yr · 1.5% tax · 5.0% vac · 8.0% maint · 8.0% mgmt
Financing live
Cash to close
- Down payment
- $57,498
- Closing costs
- $6,900
- Reserves months
- —
- Total cash needed
- —
Loan-product check · same deal, 3 products live
Conventional
25% down · 7.5% · 30yr
- Down + closing
- —
- Monthly P&I
- —
- Monthly cashflow
- —
- DSCR
- —
- Eligible?
- —
Personal DTI + credit; lowest rate.
DSCR
20% down · 8.5% · 30yr
- Down + closing
- —
- Monthly P&I
- —
- Monthly cashflow
- —
- DSCR
- —
- Eligible?
- —
No personal income docs; deal must DSCR.
Hard money
10% down · 12.0% · 12mo
- Down + closing
- —
- Monthly P&I
- —
- Monthly cashflow
- —
- DSCR
- —
- Eligible?
- —
Short-term bridge; refi at stabilization.
Rent comps 8 comps
| Address | Beds | Baths | Sqft | Rent | $/sqft | DOM | Units | Dist |
|---|---|---|---|---|---|---|---|---|
| 13404 Balderdash Ct Cresson, TX | 3.0–5.0 | 2.0–2.5 | 2025 | $2,532 | $1.25 | 1d | 1 | 0.09mi |
| 13404 Gitty Up Cir Cresson, TX | 3.0 | 2.0 | 1653 | $2,150 | $1.30 | 1d | 1 | 0.21mi |
| 13557 Gunsmoke Ln Cresson, TX | 4.0 | 2.0 | 1790 | $2,000 | $1.12 | 1d | 1 | 0.34mi |
| 13545 Bonanza Cir Cresson, TX | 3.0 | 2.0 | 1825 | $2,490 | $1.36 | 1d | 1 | 0.40mi |
| 13553 Bonanza Cir Cresson, TX | 2.0–3.0 | 2.0–2.5 | 1644 | $2,641 | $1.61 | 1d | 90 | 0.42mi |
| 13557 Bonanza Cir Cresson, TX | 3.0 | 2.0 | 1665 | $2,325 | $1.40 | 24d | 1 | 0.43mi |
| 13589 Gunsmoke Ln Cresson, TX | 3.0 | 2.5 | 1650 | $2,350 | $1.42 | 1d | 1 | 0.43mi |
| 13565 Bonanza Cir Cresson, TX | 3.0 | 2.0 | 1550 | $2,250 | $1.45 | 24d | 1 | 0.45mi |
HOA detail
- Monthly dues
- $125 · $1,500/yr
Listing history 28 events
-
2026-04-27status Pending
-
2026-04-15status Active
-
2026-03-31status Pending
-
2026-03-25price $229,990
-
2026-03-11price $234,990
-
2026-03-06price $249,990
-
2026-03-04price $264,990
-
2026-02-27price $259,990
-
2026-02-06price $264,990
-
2026-01-26price $269,990
-
2026-01-15price $275,990
-
2026-01-05price $279,990
-
2025-12-23price $282,990
-
2025-12-17price $284,990
-
2025-12-09price $285,986
-
2025-12-09price $289,486
-
2025-11-25price $294,486
-
2025-11-10price $295,987
-
2025-11-03price $293,487
-
2025-10-25price $297,488
-
2025-10-24$300,989 Active
-
2025-09-25historical
-
2025-09-17price $312,494
-
2025-09-07price $312,996
-
2025-09-04price $312,997
-
2025-08-21price $302,990
-
2025-07-16price $314,990
-
2025-07-14$304,990 Active
ⓘ Source: listings_history table (triggers on properties + properties_extension) + one-shot
backfill from property_details.listing_events for pre-trigger history.
Tax reassessment forecast TX · Resets to sale price
- Current annual tax
- $688 · $57/mo
- Projected year-2 tax
- $4,209 · $351/mo
- Expected delta
- +$3,521/yr (+$293/mo · 512.0%)
ⓘ Screening estimate from a state-policy table — verify with the county assessor before closing.
Climate risk First Street
- Flood 1/10 Low FEMA zone X (unshaded) · 0% chance over 30 yrs
- Wildfire 6/10 Major
- Heat 7/10 Severe 7 d/yr ≥108°F today · 23 d/yr by 30 yrs out
- Wind 6/10 Major 27% chance of damaging wind over 30 yrs
- Air quality 2/10 Low 1 unhealthy d/yr today · 2 by 30 yrs out
Nearby sold comps map
Loading sold comps map…
Walkable amenities ~0.75 mi
Loading nearby amenities…
Taxation est. · year 1
- Rental income
- $28,574
- − Mortgage interest
- −$12,883
- − Property taxes
- −$688
- − Insurance
- −$1,150
- − Repairs & maintenance
- −$2,286
- − Management
- −$2,286
- − HOA
- −$1,500
- − Depreciation
- −$6,691
- Taxable income
- $1,091
- Est. tax owed @ 24.0%
- −$262
- After-tax cash flow
- $4,501/yr
For passive investors: Depreciation is non-cash, so a rental often shows a tax loss while cash-flowing — sheltering income. Rental losses are passive: they offset passive income freely, and up to $25,000/yr can offset ordinary (W-2) income if you actively participate and your MAGI is under $100k (phasing out to $0 by $150k); unused losses carry forward. On sale, claimed depreciation is recaptured at up to 25%, and gains may owe capital-gains tax (a 1031 exchange can defer both). Figures are a year-1 estimate at your 24.0% rate — not tax advice; consult a CPA.
Schools (NCES district)
- District
- Granbury ISD
- NCES district ID
- 4821390
- Math proficiency
- 46% ▬ 0.00%
- Reading proficiency
- 46% ▲ 4.00%
- Median HH income
- $55,856
- Composite
- 40.04/100
- National rank
- #3820
- State rank
- #237 of 826 in TX
Livability — Cresson
- Score
- 63/100
- State rank
- #843
- US rank
- #15205
Category grades
Schools grade is shown separately in the Schools card above.
Census & demographics
- Population (ZIP)
- 3,247
Population outlook (Johnson County) Hauer SSP2
- Today (2025)
- 179,678 people
- By 2030
- 189,208 · +5.3%
- By 2040
- 207,261 · +15.4%
- By 2050
- 223,064 · +24.1%
- By 2075
- 259,979 · +44.7%
- By 2100
- 275,395 · +53.3%
Race, ethnicity, and origin ACS 2023
- Neighborhood character
- Predominantly White (72%)
- Race & ethnicity
- White 72% Hispanic / Latino 12% Two or more races 12% Black 11%
- Hispanic origin (detail)
- Mexican 11%
- Common ancestry
- Slovak 6% Lithuanian 6% Iranian 2%
- Foreign-born
- 3% · Canada
- Languages at home
- 93% English-only · Spanish 6%
Political lean MEDSL · Johnson
- 2024 margin
- Solid R (+51.4) · D 23.9% · R 75.3%
- 2008→2024 swing
- -3.9pp toward R · 2008: -47.5pp · 2024: -51.4pp
- All cycles
- 2024: R+51.4 2020: R+53.0 2016: R+58.3 2012: R+55.6 2008: R+47.5
Not yet ingested
- Civics
- —
Market trends
- HPI YoY
- ▼ -1.87%
- Current HPI
- 187.0174
- Rent YoY
- —
- Metro
- —
- State GDP YoY
- ▲ 3.95%
- F500 in state
- 110
Industry mix (Fortune 500 HQ in TX)
| Industry | F500 HQs | Revenue |
|---|---|---|
| Energy | 16 | $1,198B |
|
||
| Technology | 5 | $198B |
|
||
| Engineering / Construction | 4 | $72B |
|
||
| Energy Services | 3 | $60B |
|
||
| Utilities | 3 | $41B |
|
||
| Healthcare | 2 | $330B |
|
||
Price history
-24.6% since first listed28 events — show timeline
- 2026-04-27 Pending — NTREIS
- 2026-04-15 Relisted — NTREIS
- 2026-03-31 Pending — NTREIS
- 2026-03-25 Price Changed $229,990 NTREIS
- 2026-03-11 Price Changed $234,990 NTREIS
- 2026-03-06 Price Changed $249,990 NTREIS
- 2026-03-04 Price Changed $264,990 NTREIS
- 2026-02-27 Price Changed $259,990 NTREIS
- 2026-02-06 Price Changed $264,990 NTREIS
- 2026-01-26 Price Changed $269,990 NTREIS
- 2026-01-15 Price Changed $275,990 NTREIS
- 2026-01-05 Price Changed $279,990 NTREIS
- 2025-12-23 Price Changed $282,990 NTREIS
- 2025-12-17 Price Changed $284,990 NTREIS
- 2025-12-09 Price Changed $285,986 NTREIS
- 2025-12-09 Price Changed $289,486 NTREIS
- 2025-11-25 Price Changed $294,486 NTREIS
- 2025-11-10 Price Changed $295,987 NTREIS
- 2025-11-03 Price Changed $293,487 NTREIS
- 2025-10-25 Price Changed $297,488 NTREIS
- 2025-10-24 Listed $300,989 NTREIS
- 2025-09-25 Listing Removed — NTREIS
- 2025-09-17 Price Changed $312,494 NTREIS
- 2025-09-07 Price Changed $312,996 NTREIS
- 2025-09-04 Price Changed $312,997 NTREIS
- 2025-08-21 Price Changed $302,990 NTREIS
- 2025-07-16 Price Changed $314,990 NTREIS
- 2025-07-14 Listed $304,990 NTREIS
Property tax history
+29.2%/yrLatest (2025): $688 · +67.4% YoY. Source: county tax records.
Cash-flow waterfall
monthlySold comps — $/sqft
last 12 mo · ≤1 miLoading sold comps…